SlideShare une entreprise Scribd logo
1  sur  1
Télécharger pour lire hors ligne
CRACKING
            THE CODE
            BEHIND FAST
            BUSINESS
            INTELLIGENCE
            As information demand and data volume continue to grow, organizations are
            faced with the challenge of analyzing and disseminating that information in a
            timely manner. That’s why Best-in-Class companies already are adopting
            visual discovery over traditional Business Intelligence (BI), resulting in
            responsive, self-service analytics.


                                                                                                                                  52%
                                                                                                                              Need agility because of
            AS THE DECISION-MAKING                                                                                             information demand

               WINDOW SHRINKS,
             AGILITY IS THE KEY
                                             It comes down to getting the right information to the right people at the right time.
                                                 We surveyed hundreds of organizations to identify Best-in-Class, industry average
                                             and laggards in information agility. This is based on their ability to find information
                                            needed in the time required, the average elapsed time to add a column to an existing
                                                report, and time to create a new dashboard.


        38%
      Need agility because
        of data volume


            Trad
                        ition
         It’s p
                 r ima
                         ri
                                  al BI
        and
               d e li v l y c o nt r o
        Of te          e re d           l l e d,
              n,              by                 dr
       data only sta corpora iven
              a re a          ti c v i           te IT.
      cha n            v               ew
             ges ailable, a s of
      mu s          or e n             nd a
           t be             h                  n
                 mad a nce me y
                         e by               nt s
                                IT.

                                                                                                      EXPOSING THE
              covery
                                                                                                  TRADITIONAL BI TIMELINE
   Visual Dis e BI)
             iv
   (Interact      ea       eiv
               users rec
    Business              tive and
               ly interac
    rich, high              owing
                 rface, all
    v isual inte         te and
               manipula directly.
     them to                n
                  formatio
      explore in


                                                                                                                                                                  Time (Days), n=237


                                                                                                               Days to add
                                                                                                           8   column to report                 30    Days to build a
                                                                                                                                                      new dashboard


                                               IN
                                           BENEF VESTIGATIN
                                                 ITS OF      G
                                                        INTER THE
                                                             ACTIV                                                                 HOW
                                            In teract
                                                                   E BI                                                                C
                                                                                                                                   ANAL OMPANIE
                                                        ivity a                                                                        Y ZIN
                                            for eve             llows
                                                                         for 65                                                50%           G TH E S A RE
                                                     r y IT m                    % mo                                                              IR DA
                                                               e mbe                      re BI u                                                        TA
                                                                        r
                                          This c
                                                   opy is
                                                                                                  se r s                      40%        44
                                                            hidde
                                                                    n und                                                  30%
                                                                            e r ne a
                                                                                     th bla
                                                                                             ck ba r
                                        Best-in
                                       likely t
                                                 - Class
                                                            c omp
                                                                                                                          20%
                                                                                                                                                     24
                                               o tu r n             anies
                                                         data in             a re t w                                    10%
                                      This is
                                                                   to det
                                                                           ailed in
                                                                                       ice as
                                                                                      forma
                                                                                                                                                            17
                                               mo re                                          tion                       0%
                                                       copy h
                                                                 idden
                                    Twice                                 unde r
                                                                                   black
                                            a s ma
                                                    ny Be                                   ba r                               Visua
                                   c omp
                                           anies             st-in- C                                                                l/
                                                                                                                                     Inter
                                                   have in             lass                                                 Both            active
                                  th a n L
                                           ag ga r           teract                                                               Tradi             BI
                                                   ds                ive da                                                 Visua        tiona
                                                                              s hb oa                                                          l and
                                                                                        rds                                       l/Inte
                                                                                                                           Tradi          ractiv
                                                                                                                                 tiona           e BI
                                                                                                                                       l BI
                                                                                                                          Time (D
                                                                                                                                    ays), n
                                                                                                                                              =237


                              CAN TAILOR
       BUSINES S USERS WHO
                          Y TO WORK
        BI A RE MORE LIKE     COMPANY
        FOR A B EST-IN-CL ASS


                                                             60% 28%
                                                                                                                           EMPOWE
     65% 22%                                      Best-in-Class Laggard                                                                                RING
                                                       ALLOW DATA MASH-UP
                                                                                                                     THE INDI
                                                                                                                   THROUG VIDUAL
Best-in-Class Laggard
  TAILOR DASHBOARDS                                                                                                        H INTERA
                                                                                                                                   CTIVIT Y

                                                                                                                                                                                47%
                                                                                                                        Percentage of                                   35%
                                                                                                                    self-service users
                                                                                                                                                                   31%
                                                                                    Visual/Interactive BI
                                                                                    Both Traditional and
                                                                                    Visual/Interactive BI                                                          30%
                                                                                    Traditional BI
                                                                                                                        Percentage of                       23%
                                                                                                                         power users
                                                                                                                                                       16%

                                                                                                                n=233                                0% 10% 20% 30% 40% 50%


                                                                                              A CLOSER LOOK AT
                                                                                              THE BEST IN CLASS
                                                              100%                            Best-in-Class companies, already using the most agile and
                                                                                              responsive analytic solutions, are more likely to use dashboards,
                                                              90%       95
                                                                                              in-memory analytics and visual data discovery tools.
                                                              80%
                                                              70%                 75
                                                              60%
                                               Respondents


                                                              50%                                                 55
Best-in-Class                                                                                                                                              47
                                                              40%
                                                                                           53                                                                      41
Industry Average                                              30%                                                        33
                                               n=199
                                                              20%
Laggards                                                                                                                                                                   29
                                                              10%
                                                                                                                                  19
                                                               0%
                                                                          Dashboards                           In-memory analytics                   Visual data discovery tools


                   IGHT                                                                     ss
     GETTING THE R                                                                   in-Cla
                                                                               Best- ers
                   E                                                                 th
     TOOLS INTO TH
                                                                               All O

     RIGHT HANDS
                              ations aren’t                                                                                                               37% 20%
      Best-in-Class organiz
                             e interactive
                                                                                                                   60% 34%
      just more likely to us                                                                                                                                          with
                                                                                                                                                          BI users scovery
                              re likely to                                                                                                             visual data
                                                                                                                                                                   di
      tools, they’re also mo                                                                                        B u
                                                                                                               interaItivsers with
                            ughly 50%                                                                                c e das
       distribute them. Ro                                                                                                    hboards
                                 board have
       of BI users across the
                             ditional BI,
       access to static, tra
                                   ost twice
       repor  ting. However, alm
        as many BI users ha
                              ve  access                                       55% 49%
        to intera ctive dashboards or
                             ry tools at                                      BI users with
        visual data discove                                                  managed reporting
                              anies.
         Best-in-Class comp


                                    THE FINDINGS
                                    The reports are clear: Interactive BI allows for agility in the face of decreasing business
                                          response time. Forty-four percent of the organizations that use just interactive BI tools
                                              are always able to provide business managers with the information they need, in the
                                               timeframe required. This holds true for just 17 percent of the organizations that rely
                                             solely on traditional BI.


                                         Companies that have complemented their traditional BI solutions with the interactive
                                        approach are almost 50 percent more likely to consistently meet the needs of business
                                          managers than those that rely solely on traditional BI solutions. A highly visual approach
                                            to BI can liberate business managers and transform their decision-making by ensuring
                                              they have access to the right information at the right time.


                                                                                                                                      it SAP at
                                                                                                                  ormation on BI , vis
                                                                                                      For more inf datavisualization.
                                                                                                                   /
                                                                                                                  sap.com

                                                                                                                                                                Data provided by


                                                                                                                                                                ©2012 Aberdeen Group.
                                                                                                                                                                www.aberdeen.com

Contenu connexe

Plus de SAP Analytics

Plus de SAP Analytics (20)

SAP Leonardo: An Overview
SAP Leonardo: An OverviewSAP Leonardo: An Overview
SAP Leonardo: An Overview
 
#askSAP Analytics Innovations Community Call: Delivering the Intelligent Ente...
#askSAP Analytics Innovations Community Call: Delivering the Intelligent Ente...#askSAP Analytics Innovations Community Call: Delivering the Intelligent Ente...
#askSAP Analytics Innovations Community Call: Delivering the Intelligent Ente...
 
Data & Analytics: The Competitive Edge for Small and Midsize Businesses
Data & Analytics: The Competitive Edge for Small and Midsize BusinessesData & Analytics: The Competitive Edge for Small and Midsize Businesses
Data & Analytics: The Competitive Edge for Small and Midsize Businesses
 
Data Analytics Help Drive Digital Transformation Infographic
Data Analytics Help Drive Digital Transformation InfographicData Analytics Help Drive Digital Transformation Infographic
Data Analytics Help Drive Digital Transformation Infographic
 
#askSAP: Journey to the Cloud: SAP Strategy and Roadmap for Cloud and Hybrid ...
#askSAP: Journey to the Cloud: SAP Strategy and Roadmap for Cloud and Hybrid ...#askSAP: Journey to the Cloud: SAP Strategy and Roadmap for Cloud and Hybrid ...
#askSAP: Journey to the Cloud: SAP Strategy and Roadmap for Cloud and Hybrid ...
 
Unify Line of Business Data with SAP Digital Boardroom
Unify Line of Business Data with SAP Digital BoardroomUnify Line of Business Data with SAP Digital Boardroom
Unify Line of Business Data with SAP Digital Boardroom
 
#asksap Analytics Innovations Community Call - Take Action in 2017 with Innov...
#asksap Analytics Innovations Community Call - Take Action in 2017 with Innov...#asksap Analytics Innovations Community Call - Take Action in 2017 with Innov...
#asksap Analytics Innovations Community Call - Take Action in 2017 with Innov...
 
Can your insights deliver 171% ROI?
Can your insights deliver 171% ROI?Can your insights deliver 171% ROI?
Can your insights deliver 171% ROI?
 
#askSAP EPM Innovations Community Call: How Planning Can Ignite Digital Trans...
#askSAP EPM Innovations Community Call: How Planning Can Ignite Digital Trans...#askSAP EPM Innovations Community Call: How Planning Can Ignite Digital Trans...
#askSAP EPM Innovations Community Call: How Planning Can Ignite Digital Trans...
 
#askSAP Analytics Innovations Community Call: Reimagine Analytics for the Dig...
#askSAP Analytics Innovations Community Call: Reimagine Analytics for the Dig...#askSAP Analytics Innovations Community Call: Reimagine Analytics for the Dig...
#askSAP Analytics Innovations Community Call: Reimagine Analytics for the Dig...
 
#askSAP Analytics Innovations Community Call: Innovation in Core BI Solutions...
#askSAP Analytics Innovations Community Call: Innovation in Core BI Solutions...#askSAP Analytics Innovations Community Call: Innovation in Core BI Solutions...
#askSAP Analytics Innovations Community Call: Innovation in Core BI Solutions...
 
#askSAP GRC Innovations Community Call: Cybersecurity Risk and Governance
#askSAP GRC Innovations Community Call: Cybersecurity Risk and Governance#askSAP GRC Innovations Community Call: Cybersecurity Risk and Governance
#askSAP GRC Innovations Community Call: Cybersecurity Risk and Governance
 
#askSAP EPM Innovations Community Call: Transform Finance into Instant Insight
#askSAP EPM Innovations Community Call: Transform Finance into Instant Insight#askSAP EPM Innovations Community Call: Transform Finance into Instant Insight
#askSAP EPM Innovations Community Call: Transform Finance into Instant Insight
 
The Big Trends in Business Intelligence Competency Centers
The Big Trends in Business Intelligence Competency CentersThe Big Trends in Business Intelligence Competency Centers
The Big Trends in Business Intelligence Competency Centers
 
#askSAP Analytics Innovations Community Call: SAP Cloud for Analytics
#askSAP Analytics Innovations Community Call: SAP Cloud for Analytics #askSAP Analytics Innovations Community Call: SAP Cloud for Analytics
#askSAP Analytics Innovations Community Call: SAP Cloud for Analytics
 
Ongoing Benefits of SAP Cloud for Analytics by Nucleus Research
Ongoing Benefits of SAP Cloud for Analytics by Nucleus ResearchOngoing Benefits of SAP Cloud for Analytics by Nucleus Research
Ongoing Benefits of SAP Cloud for Analytics by Nucleus Research
 
Adopting a Real-Time Mindset with SAP
Adopting a Real-Time Mindset with SAPAdopting a Real-Time Mindset with SAP
Adopting a Real-Time Mindset with SAP
 
#askSAP Analytics Innovations Community Call: Delivering Big Data Inisghts wi...
#askSAP Analytics Innovations Community Call: Delivering Big Data Inisghts wi...#askSAP Analytics Innovations Community Call: Delivering Big Data Inisghts wi...
#askSAP Analytics Innovations Community Call: Delivering Big Data Inisghts wi...
 
How to Enter the DataGenius Challenge
How to Enter the DataGenius ChallengeHow to Enter the DataGenius Challenge
How to Enter the DataGenius Challenge
 
Transnet
TransnetTransnet
Transnet
 

Dernier

+971581248768>> SAFE AND ORIGINAL ABORTION PILLS FOR SALE IN DUBAI AND ABUDHA...
+971581248768>> SAFE AND ORIGINAL ABORTION PILLS FOR SALE IN DUBAI AND ABUDHA...+971581248768>> SAFE AND ORIGINAL ABORTION PILLS FOR SALE IN DUBAI AND ABUDHA...
+971581248768>> SAFE AND ORIGINAL ABORTION PILLS FOR SALE IN DUBAI AND ABUDHA...
?#DUbAI#??##{{(☎️+971_581248768%)**%*]'#abortion pills for sale in dubai@
 
Artificial Intelligence: Facts and Myths
Artificial Intelligence: Facts and MythsArtificial Intelligence: Facts and Myths
Artificial Intelligence: Facts and Myths
Joaquim Jorge
 

Dernier (20)

The 7 Things I Know About Cyber Security After 25 Years | April 2024
The 7 Things I Know About Cyber Security After 25 Years | April 2024The 7 Things I Know About Cyber Security After 25 Years | April 2024
The 7 Things I Know About Cyber Security After 25 Years | April 2024
 
Boost PC performance: How more available memory can improve productivity
Boost PC performance: How more available memory can improve productivityBoost PC performance: How more available memory can improve productivity
Boost PC performance: How more available memory can improve productivity
 
Artificial Intelligence Chap.5 : Uncertainty
Artificial Intelligence Chap.5 : UncertaintyArtificial Intelligence Chap.5 : Uncertainty
Artificial Intelligence Chap.5 : Uncertainty
 
A Year of the Servo Reboot: Where Are We Now?
A Year of the Servo Reboot: Where Are We Now?A Year of the Servo Reboot: Where Are We Now?
A Year of the Servo Reboot: Where Are We Now?
 
TrustArc Webinar - Unlock the Power of AI-Driven Data Discovery
TrustArc Webinar - Unlock the Power of AI-Driven Data DiscoveryTrustArc Webinar - Unlock the Power of AI-Driven Data Discovery
TrustArc Webinar - Unlock the Power of AI-Driven Data Discovery
 
Strategies for Unlocking Knowledge Management in Microsoft 365 in the Copilot...
Strategies for Unlocking Knowledge Management in Microsoft 365 in the Copilot...Strategies for Unlocking Knowledge Management in Microsoft 365 in the Copilot...
Strategies for Unlocking Knowledge Management in Microsoft 365 in the Copilot...
 
+971581248768>> SAFE AND ORIGINAL ABORTION PILLS FOR SALE IN DUBAI AND ABUDHA...
+971581248768>> SAFE AND ORIGINAL ABORTION PILLS FOR SALE IN DUBAI AND ABUDHA...+971581248768>> SAFE AND ORIGINAL ABORTION PILLS FOR SALE IN DUBAI AND ABUDHA...
+971581248768>> SAFE AND ORIGINAL ABORTION PILLS FOR SALE IN DUBAI AND ABUDHA...
 
Partners Life - Insurer Innovation Award 2024
Partners Life - Insurer Innovation Award 2024Partners Life - Insurer Innovation Award 2024
Partners Life - Insurer Innovation Award 2024
 
Deploy with confidence: VMware Cloud Foundation 5.1 on next gen Dell PowerEdg...
Deploy with confidence: VMware Cloud Foundation 5.1 on next gen Dell PowerEdg...Deploy with confidence: VMware Cloud Foundation 5.1 on next gen Dell PowerEdg...
Deploy with confidence: VMware Cloud Foundation 5.1 on next gen Dell PowerEdg...
 
ProductAnonymous-April2024-WinProductDiscovery-MelissaKlemke
ProductAnonymous-April2024-WinProductDiscovery-MelissaKlemkeProductAnonymous-April2024-WinProductDiscovery-MelissaKlemke
ProductAnonymous-April2024-WinProductDiscovery-MelissaKlemke
 
Tata AIG General Insurance Company - Insurer Innovation Award 2024
Tata AIG General Insurance Company - Insurer Innovation Award 2024Tata AIG General Insurance Company - Insurer Innovation Award 2024
Tata AIG General Insurance Company - Insurer Innovation Award 2024
 
AWS Community Day CPH - Three problems of Terraform
AWS Community Day CPH - Three problems of TerraformAWS Community Day CPH - Three problems of Terraform
AWS Community Day CPH - Three problems of Terraform
 
Manulife - Insurer Innovation Award 2024
Manulife - Insurer Innovation Award 2024Manulife - Insurer Innovation Award 2024
Manulife - Insurer Innovation Award 2024
 
Artificial Intelligence: Facts and Myths
Artificial Intelligence: Facts and MythsArtificial Intelligence: Facts and Myths
Artificial Intelligence: Facts and Myths
 
Repurposing LNG terminals for Hydrogen Ammonia: Feasibility and Cost Saving
Repurposing LNG terminals for Hydrogen Ammonia: Feasibility and Cost SavingRepurposing LNG terminals for Hydrogen Ammonia: Feasibility and Cost Saving
Repurposing LNG terminals for Hydrogen Ammonia: Feasibility and Cost Saving
 
HTML Injection Attacks: Impact and Mitigation Strategies
HTML Injection Attacks: Impact and Mitigation StrategiesHTML Injection Attacks: Impact and Mitigation Strategies
HTML Injection Attacks: Impact and Mitigation Strategies
 
Understanding Discord NSFW Servers A Guide for Responsible Users.pdf
Understanding Discord NSFW Servers A Guide for Responsible Users.pdfUnderstanding Discord NSFW Servers A Guide for Responsible Users.pdf
Understanding Discord NSFW Servers A Guide for Responsible Users.pdf
 
Strategize a Smooth Tenant-to-tenant Migration and Copilot Takeoff
Strategize a Smooth Tenant-to-tenant Migration and Copilot TakeoffStrategize a Smooth Tenant-to-tenant Migration and Copilot Takeoff
Strategize a Smooth Tenant-to-tenant Migration and Copilot Takeoff
 
2024: Domino Containers - The Next Step. News from the Domino Container commu...
2024: Domino Containers - The Next Step. News from the Domino Container commu...2024: Domino Containers - The Next Step. News from the Domino Container commu...
2024: Domino Containers - The Next Step. News from the Domino Container commu...
 
Real Time Object Detection Using Open CV
Real Time Object Detection Using Open CVReal Time Object Detection Using Open CV
Real Time Object Detection Using Open CV
 

Visualize Data Quickly and Easily with Self-Service Analytics Infographic

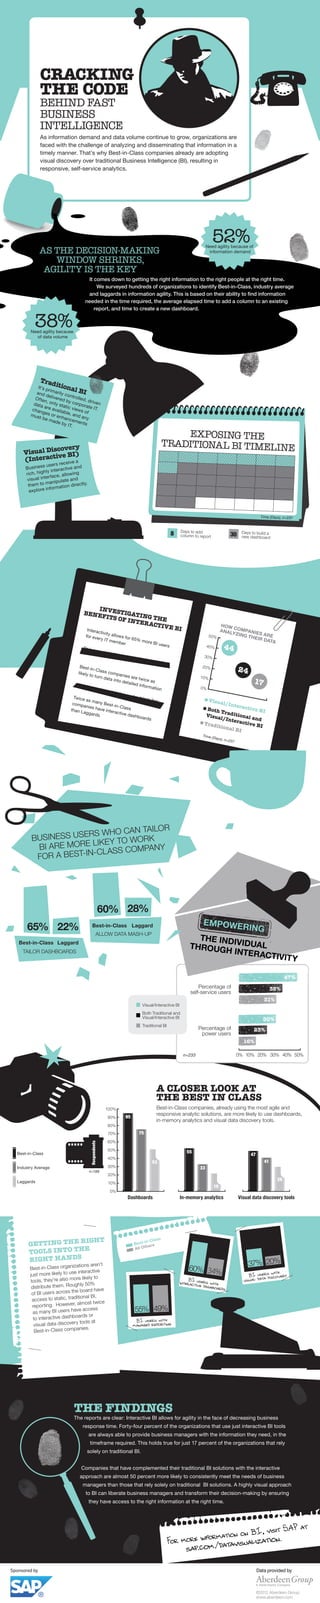
  • 1. CRACKING THE CODE BEHIND FAST BUSINESS INTELLIGENCE As information demand and data volume continue to grow, organizations are faced with the challenge of analyzing and disseminating that information in a timely manner. That’s why Best-in-Class companies already are adopting visual discovery over traditional Business Intelligence (BI), resulting in responsive, self-service analytics. 52% Need agility because of AS THE DECISION-MAKING information demand WINDOW SHRINKS, AGILITY IS THE KEY It comes down to getting the right information to the right people at the right time. We surveyed hundreds of organizations to identify Best-in-Class, industry average and laggards in information agility. This is based on their ability to find information needed in the time required, the average elapsed time to add a column to an existing report, and time to create a new dashboard. 38% Need agility because of data volume Trad ition It’s p r ima ri al BI and d e li v l y c o nt r o Of te e re d l l e d, n, by dr data only sta corpora iven a re a ti c v i te IT. cha n v ew ges ailable, a s of mu s or e n nd a t be h n mad a nce me y e by nt s IT. EXPOSING THE covery TRADITIONAL BI TIMELINE Visual Dis e BI) iv (Interact ea eiv users rec Business tive and ly interac rich, high owing rface, all v isual inte te and manipula directly. them to n formatio explore in Time (Days), n=237 Days to add 8 column to report 30 Days to build a new dashboard IN BENEF VESTIGATIN ITS OF G INTER THE ACTIV HOW In teract E BI C ANAL OMPANIE ivity a Y ZIN for eve llows for 65 50% G TH E S A RE r y IT m % mo IR DA e mbe re BI u TA r This c opy is se r s 40% 44 hidde n und 30% e r ne a th bla ck ba r Best-in likely t - Class c omp 20% 24 o tu r n anies data in a re t w 10% This is to det ailed in ice as forma 17 mo re tion 0% copy h idden Twice unde r black a s ma ny Be ba r Visua c omp anies st-in- C l/ Inter have in lass Both active th a n L ag ga r teract Tradi BI ds ive da Visua tiona s hb oa l and rds l/Inte Tradi ractiv tiona e BI l BI Time (D ays), n =237 CAN TAILOR BUSINES S USERS WHO Y TO WORK BI A RE MORE LIKE COMPANY FOR A B EST-IN-CL ASS 60% 28% EMPOWE 65% 22% Best-in-Class Laggard RING ALLOW DATA MASH-UP THE INDI THROUG VIDUAL Best-in-Class Laggard TAILOR DASHBOARDS H INTERA CTIVIT Y 47% Percentage of 35% self-service users 31% Visual/Interactive BI Both Traditional and Visual/Interactive BI 30% Traditional BI Percentage of 23% power users 16% n=233 0% 10% 20% 30% 40% 50% A CLOSER LOOK AT THE BEST IN CLASS 100% Best-in-Class companies, already using the most agile and responsive analytic solutions, are more likely to use dashboards, 90% 95 in-memory analytics and visual data discovery tools. 80% 70% 75 60% Respondents 50% 55 Best-in-Class 47 40% 53 41 Industry Average 30% 33 n=199 20% Laggards 29 10% 19 0% Dashboards In-memory analytics Visual data discovery tools IGHT ss GETTING THE R in-Cla Best- ers E th TOOLS INTO TH All O RIGHT HANDS ations aren’t 37% 20% Best-in-Class organiz e interactive 60% 34% just more likely to us with BI users scovery re likely to visual data di tools, they’re also mo B u interaItivsers with ughly 50% c e das distribute them. Ro hboards board have of BI users across the ditional BI, access to static, tra ost twice repor ting. However, alm as many BI users ha ve access 55% 49% to intera ctive dashboards or ry tools at BI users with visual data discove managed reporting anies. Best-in-Class comp THE FINDINGS The reports are clear: Interactive BI allows for agility in the face of decreasing business response time. Forty-four percent of the organizations that use just interactive BI tools are always able to provide business managers with the information they need, in the timeframe required. This holds true for just 17 percent of the organizations that rely solely on traditional BI. Companies that have complemented their traditional BI solutions with the interactive approach are almost 50 percent more likely to consistently meet the needs of business managers than those that rely solely on traditional BI solutions. A highly visual approach to BI can liberate business managers and transform their decision-making by ensuring they have access to the right information at the right time. it SAP at ormation on BI , vis For more inf datavisualization. / sap.com Data provided by ©2012 Aberdeen Group. www.aberdeen.com