SGS 2019 Half Year Results Report
•
0 j'aime•25,112 vues

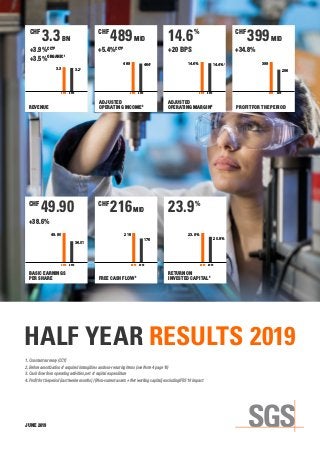
SGS delivers solid results and achieves a number of strategic milestones in H1 2019. • Total revenue grew by 3.9% at constant currency to CHF 3.3 billion. • Good organic growth of 3.5% was achieved across the business portfolio, with most business lines delivering mid-single-digit growth. • The adjusted operating income reached CHF 489 million, versus CHF 464 million in prior year, an increase of 5.4% on a constant currency basis. • The adjusted operating income margin increased by 20 bps on a constant currency basis to 14.6% You can view our financial reports here: www.sgs.com/en/our-company/investor-relations/financial-reports.

Recommandé
Recommandé
Contenu connexe
Plus de SGS
Plus de SGS (20)
Dernier
Dernier (20)
SGS 2019 Half Year Results Report
- 1. 201820192018201920182019 20182019 20182019 2018201920182019 HALF YEAR RESULTS 2019 CHF 3.3 BN +3.9%CCY1 +3.5%ORGANIC1 CHF 489 MIO +5.4%CCY1 CHF 399 MIO +34.8% 14.6% +20 BPS CHF 49.90 +38.6% CHF 216 MIO 23.9% 3.213.3 4641489 296 39914.4%114.6% 36.01 49.90 20.8% 23.9% 176 216 REVENUE ADJUSTED OPERATING INCOME2 ADJUSTED OPERATING MARGIN2 PROFIT FOR THE PERIOD BASIC EARNINGS PER SHARE RETURN ON INVESTED CAPITAL4 FREE CASH FLOW3 1. Constant currency (CCY) 2. Before amortization of acquired intangibles and non-recurring items (see Note 4 page 16) 3. Cash flow from operating activities, net of capital expenditure 4. Profit for the period (last twelve months) / (Non-current assets + Net working capital), excluding IFRS 16 impact JUNE 2019
- 3. 3 FINANCIAL HIGHLIGHTS (CHF million) JUNE 2019 JUNE 2018 CCY 1 Change in CCY % JUNE 2018 Change in % REVENUE 3 341 3 215 3.9 3 306 1.1 ADJUSTED EBITDA2 722 603 19.7 625 15.5 ADJUSTED OPERATING INCOME2 489 464 5.4 481 1.7 ADJUSTED OPERATING INCOME MARGIN2 14.6% 14.4% 14.6% OPERATING INCOME (EBIT) 636 396 60.6 411 54.7 PROFIT FOR THE PERIOD 399 284 40.5 296 34.8 PROFIT ATTRIBUTABLE TO EQUITY HOLDERS OF SGS SA 377 263 43.3 274 37.6 ADJUSTED PROFIT ATTRIBUTABLE TO EQUITY HOLDERS OF SGS SA2 280 329 (14.9) 342 (18.1) ADJUSTED BASIC EPS (CHF)2 37.04 43.26 45.01 BASIC EPS (CHF) 49.90 34.62 36.01 DILUTED EPS (CHF) 49.75 34.60 35.98 CASH FLOW FROM OPERATING ACTIVITIES 341 316 FREE CASH FLOW3 216 176 RETURN ON INVESTED CAPITAL4 23.9% 20.8% (NET DEBT) (2 090) (1 146) (NET DEBT) EXCLUDING IFRS 16 IMPACT (1 443) (1 146) WEIGHTED AVERAGE NUMBER OF SHARES ('000) 7 551 7 607 HEADCOUNT AVERAGE 96 140 96 230 1. Constant currency (CCY) 2. Before amortisation of acquired intangibles and non-recurring items (see Note 4 page 16) 3. Cash flow from operating activities, net of capital expenditure 4. Profit for the period (last twelve months) / (Non-current assets + Net working capital), excluding IFRS 16 impact
- 4. 4 SGS ACHIEVES A NUMBER OF STRATEGIC MILESTONES IN H1 2019 A number of strategic milestones have been achieved by the SGS Group in H1 2019. These achievements will help ensure SGS’ leadership position in the Testing, Inspection and Certification industry and create long-term value for SGS’ employees, customers, shareholders and for society: • The Group has disposed of Petroleum Services Corporation (PSC), a provider of downstream Plant and Terminal Operations, and acquired Maine Pointe LLC, a business process optimization consulting firm, both based in the USA. These demonstrate the Group’s capital allocation strategy of increasingly moving towards higher value-added services. • The development of cyber security laboratories and centers of excellence in Madrid, and soon in Graz, as well as a partnership with Graz University, position the organization as a key player of this rapidly growing nascent TIC activity driven by increasing regulations. It also provides a natural overlap with the Group’s current TIC services. • Structural optimization measures to streamline the business across the global network will be undertaken in H2 2019. The cost of CHF 75 million should deliver annualized savings by 2020 that will exceed this initial investment. The H1 2019 results coupled with the structural optimization measures to be implemented in H2 support the Group’s 2019 guidance and 2020 outlook, which are both confirmed. A SOLID FINANCIAL PERFORMANCE IN H1 Total REVENUE grew by 3.9% at constant currency to CHF 3.3 billion. Good ORGANIC GROWTH of 3.5% was achieved across the business portfolio, with most business lines delivering mid-single-digit growth. The ADJUSTED OPERATING INCOME reached CHF 489 million, versus CHF 464 million in prior year, an increase of 5.4% on a constant currency basis. The ADJUSTED OPERATING INCOME MARGIN increased by 20 bps on a constant currency basis to 14.6%. The increase in adjusted operating income margin was limited as the positive impact from the application of IFRS 16 was more than offset by collection delays, primarily in Governments and Institutions. Collection should improve in H2 2019. NET FINANCIAL EXPENSES increased from CHF 21 million last year to CHF 33 million in 2019 driven by the implementation of IFRS 16 in 2019, generating an increase in lease interest costs. The overall EFFECTIVE TAX RATE (ETR) for the period increased from 24% last year to 34% primarily due to valuation allowances on deferred tax assets. The effective tax rate for FY 2019 is expected to be 31%. In the years ahead, based on the business geographical footprint, changing tax environment and IFRIC 23 adoption, SGS would expect a normalized tax rate in the high 20s. PROFIT ATTRIBUTABLE TO EQUITY HOLDERS reached CHF 377 million for the period, an increase of 37.6% over last year (43.3% at constant currency) driven mainly by the gain on the disposal of the Petroleum Service Corporation business, partly offset by indirect tax provisions, the remeasurement of the Swiss pension fund obligation and the above-mentioned effective tax rate increase. The BASIC EARNINGS PER SHARE reached CHF 49.90 an increase of 38.6% over last year (44.1% at constant currency). The RETURN ON INVESTED CAPITAL (ROIC)1 improved to 23.9% from 20.8% last year. CASH FLOW FROM OPERATING ACTIVITIES reached CHF 341 million. The operating net working capital as a proportion of revenue decreased from 3.1% last year to 2.9% in 2019. INVESTMENT ACTIVITIES: Capital investment was CHF 125 million and the Group completed 7 acquisitions for a total cash consideration of CHF 138 million. In 2019, the Group paid DIVIDENDS of CHF 589 million. As of 30 June 2019, the Group’s NET DEBT position amounted to CHF 2 090 million, or CHF 1 443 million without the consideration of the lease liabilities recognized for IFRS 16, the latter comparable to CHF 1 146 million at 30 June 2018. BUSINESS GROWTH AND ADJUSTED OPERATING INCOME MARGIN H1 2019 (CHF million) REVENUE GROWTH AT CCY2 ORGANIC GROWTH AT CCY2 ADJUSTED OPERATING INCOME3 ADJUSTED OPERATING INCOME MARGIN3 AFL 525 4.8% 4.8% 73 13.9% MIN 375 5.3% 5.3% 60 16.0% OGC 620 3.3% 3.6% 60 9.7% CRS 502 5.9% 5.5% 125 24.9% CBE 196 2.6% (0.5%) 35 17.9% IND 476 7.4% 6.8% 48 10.1% EHS 261 5.7% 4.9% 28 10.7% TRP 257 (4.1%) (4.5%) 35 13.6% GIS 129 (4.4%) (4.4%) 25 19.4% TOTAL 3 341 3.9% 3.5% 489 14.6% 1. Profit for the period (last twelve months) / (Non-current assets + Net working capital), excluding IFRS 16 impact 2. Constant currency (CCY) 3. Before amortisation of acquired intangibles and non-recurring items (see Note 4 page 16)
- 5. 5 Peter Kalantzis Chairman of the Board Frankie Ng Chief Executive Officer GUIDANCE 2019 The Group expects to deliver solid organic revenue growth and higher adjusted operating income on a constant currency basis and robust cash flow generation. OUTLOOK 2020 The Group remains committed: • To deliver mid-single-digit organic growth. • To accelerate mergers and acquisitions and remain disciplined on returns. • To achieve an adjusted operating income margin of above 17% by end of period supported by network optimization. • To ensure strong cash conversion. • To maintain best-in-class return on invested capital. • To at least maintain the dividend or grow it in line with the improvement in adjusted net earnings. ACQUISITIONS AND STRATEGIC PARTNERSHIPS DATE LOCATION BUSINESS LINE FTE LeanSis Productividad 21 January 2019 Spain CBE 77 Floriaan B.V. 5 February 2019 Netherlands EHS 16 Testing, Engineering and Consulting Services, Inc. 4 April 2019 USA IND 34 PT WLN Indonesia 12 April 2019 Indonesia EHS 54 Chemical Solutions Ltd 3 May 2019 USA AFL 36 i2i Infinity Ltd 12 June 2019 United Kingdom GIS 13 Maine Pointe LLC 28 June 2019 USA CBE 83 SUBSEQUENT EVENTS The following acquisitions were made after the close of the period: Forensic Analytical Laboratories, Inc. (FALI), one of the leading providers of industrial hygiene, based in the USA; and a 20% stake in Vircon Ltd, operating in the fast growing Building Information Modelling market, based in Hong Kong. MANAGEMENT CHANGES DOMINIK DE DANIEL, joined SGS Group as Chief Financial Officer. FABRICE EGLOFF, Chief Operating Officer of Africa, has taken on an extended role to include Western Europe. CHRISTOPH HEIDLER, Chief Information Officer has been appointed to the Operations Council. Carla de Geyseleer (formerly Chief Financial Officer), Pauline Earl (formerly Chief Operating Officer of Western Europe) and Francois Marti (formerly Chief Operating Officer of North America) have left the Group. The Management would like to thank them for their dedication and service. BOARD CHANGES LUITPOLD VON FINCK, CALVIN GRIEDER and KORY SORENSON were appointed to the Board of Directors during the Annual General Meeting held in March 2019. August von Finck and Christopher Kirk did not stand for re-election. SGS would like to thank both for their support and direction. SIGNIFICANT SHAREHOLDERS As at 30 June 2019, Groupe Bruxelles Lambert (acting through Serena SARL and URDAC) held 16.60% (December 2018: 16.60%). Mr. August von Finck and members of his family acting in concert held 15.52% (December 2018: 15.52%), BlackRock, Inc. held 4% (December 2018: 4%) and MFS Investment Management held 3.02% (December 2018: 3.02%) of the share capital and voting rights of the company. At the same date, the SGS Group held 1.07% of the share capital of the company (December 2018: 1.09%). 18 July 2019
- 7. 7 (CHF million) JUNE 2019 JUNE 2018 CCY2 Change in CCY % JUNE 2018 Change in % REVENUE 525 501 4.8 516 1.7 ADJUSTED OPERATING INCOME¹ 73 68 7.4 71 2.8 MARGIN %¹ 13.9 13.6 13.7 1. Before amortization of acquired intangibles and non-recurring items (see Note 4 page 16) 2. Constant currency (CCY) (CHF million) JUNE 2019 JUNE 2018 CCY2 Change in CCY % JUNE 2018 Change in % REVENUE 375 356 5.3 370 1.4 ADJUSTED OPERATING INCOME¹ 60 53 13.2 56 7.1 MARGIN %¹ 16.0 14.9 15.2 1. Before amortization of acquired intangibles and non-recurring items (see Note 4 page 16) 2. Constant currency (CCY) AGRICULTURE, FOOD AND LIFE MINERALS Agriculture, Food and Life achieved good organic growth of 4.8%. While Food and Life activities continue to be the main growth drivers, the Agriculture segment also maintained moderate growth despite challenging market conditions persisting in H1. Strong growth in Food was fueled by high testing volumes and increased demand for certification services, particularly in Asia and the Americas. Digital initiatives continue to receive wider customer acceptance and contribute to a promising pipeline. Life Laboratory activities sustained strong underlying growth momentum partially offset by efforts to optimize the laboratory network. Clinical Research grew at double-digits driven by the Clinical Pharmacology unit and a strong performance from Biometry services. Trade and Logistics delivered moderate growth supported by strong market share in the Americas and parts of Europe despite a low carry-over of stock from the 2018/19 export season. Seed and Crop achieved moderate growth as the Group positioned the business towards laboratory and technology-based services. Adjusted operating income margin improved to 13.9% from 13.6% on a constant currency basis. A stronger performance from the Agricultural segment was complemented by increased profitability from optimization of the Life laboratory network. The Minerals market upturn continued and strong organic revenue growth of 5.3% was achieved despite a tough comparable. Good growth was reported across all geographies and strategic business units. Trade inspection delivered double-digit growth due to the increased demand for Energy Minerals and services related to bulk commodities across all geographies, particularly in Russia, China, Australia and South Africa. Geochemistry activities reported double-digit growth in outsourced laboratories, further strengthening the Group’s global leadership in this segment. Sample volumes into commercial laboratories grew at a reduced momentum, however innovative services continue to generate opportunities across the broader portfolio. Metallurgy delivered strong growth with an increase in pilot plant projects and metallurgical test work in Chile, Canada and Australia. Adjusted operating income margin improved to 16.0% from 14.9% on a constant currency basis with higher incremental margins across the strategic business units, partially offset by the unfavorable geopolitical situation in some countries. ACQUISITIONS • Chemical Solutions Ltd in the USA DISPOSALS • Life activities in Italy
- 8. 8 (CHF million) JUNE 2019 JUNE 2018 CCY2 Change in CCY % JUNE 2018 Change in % REVENUE 620 600 3.3 605 2.5 ADJUSTED OPERATING INCOME¹ 60 52 15.4 54 11.1 MARGIN %¹ 9.7 8.7 8.9 1. Before amortization of acquired intangibles and non-recurring items (see Note 4 page 16) 2. Constant currency (CCY) (CHF million) JUNE 2019 JUNE 2018 CCY2, 3 Change in CCY % JUNE 20183 Change in % REVENUE 502 474 5.9 485 3.5 ADJUSTED OPERATING INCOME¹ 125 118 5.9 122 2.5 MARGIN %¹ 24.9 24.9 25.2 1. Before amortization of acquired intangibles and non-recurring items (see Note 4 page 16) 2. Constant currency (CCY) – 3. See Note 2 page 14 OIL, GAS AND CHEMICALS CONSUMER AND RETAIL Oil, Gas and Chemicals achieved solid organic growth of 3.6%. Momentum continued to build in the Upstream segment with a focus on hydrocarbon production. Plant and Terminal Operations in the USA (PSC) was disposed end of June 2019. Trade was broadly stable, despite a strong competitive environment and pricing pressure mainly in Europe, the USA and Singapore, which was partially compensated by growth in other geographies. Upstream achieved double-digit growth with increased subsurface activity and continued improvement of activity in most geographies, despite the closure of the subsea facilities inspection activity in Spain. Non-Inspection Related Testing declined moderately due to a lack of new laboratory turn-key projects, which was partly compensated by increased volumes in North America. Oil Condition Monitoring experienced strong growth in most geographies with the exception of the USA where market penetration has been slower than expected. Adjusted operating income margin improved to 9.7% from 8.7% on a constant currency basis. Margins benefited from an improvement in Upstream with good incremental margins in the production segment and continued cost control measures. This was partially offset by price pressure, mainly in Trade. Consumer and Retail delivered strong organic revenue growth of 5.5%. This was driven by strong growth in North East Asia, South East Asia Pacific, Western Europe, and double-digit growth in Eastern Europe and the Middle East. Electrical and Electronics growth was strong as Restrictive Substance Testing services grew at double digits benefiting from the deadline to comply with the Restriction of Hazardous Substances regulation. Electrical safety activity grew in high single digits through deeper penetration in the North American market. Microelectronics testing and functional safety activities performed solidly driven by Germany, Taiwan, Korea and Japan. Wireless testing activity continued to grow and SGS is preparing for 5G and IoT-related technologies. Softlines benefited from the growth in new sourcing countries such as Vietnam, Indonesia, Cambodia and Turkey, while activity in China was stable. Increased activity in chemical risk management in the footwear industry as well as in functional testing continued to be major drivers. Performance was sustained by adding new customers and increasing volumes for key accounts. Hardlines volumes increased with eRetailers and ePlatforms as well as from DIY global key accounts. Capacity expansion in new sourcing countries also contributed to the strong growth of Hardgoods. Toys and Juvenile products delivered stable performance. Cosmetics, Personal Care and Household delivered moderate growth following the postponement of major studies to the second half of 2019 due to changes in regulations in the USA and delays in RD projects for some global key accounts. Adjusted operating income margin remained stable at 24.9% on a constant currency basis with underlying profitability improvement offset by strategic investment in the new cyber security laboratory in Austria. DISPOSALS • Petroleum Services Corporation (PSC) business in the USA • Plant and Terminal operations in the Netherlands
- 9. 9 (CHF million) JUNE 2019 JUNE 2018 CCY2, 3 Change in CCY % JUNE 20183 Change in % REVENUE 196 191 2.6 196 0.0 ADJUSTED OPERATING INCOME¹ 35 34 2.9 34 2.9 MARGIN %¹ 17.9 17.8 17.3 1. Before amortization of acquired intangibles and non-recurring items (see Note 4 page 16) 2. Constant currency (CCY) – 3. See Note 2 page 14 (CHF million) JUNE 2019 JUNE 2018 CCY2 Change in CCY % JUNE 2018 Change in % REVENUE 476 443 7.4 462 3.0 ADJUSTED OPERATING INCOME¹ 48 34 41.2 34 41.2 MARGIN %¹ 10.1 7.7 7.4 1. Before amortization of acquired intangibles and non-recurring items (see Note 4 page 16) 2. Constant currency (CCY) CERTIFICATION AND BUSINESS ENHANCEMENT INDUSTRIAL Certification and Business Enhancement organic revenue remained broadly stable. Both Certification and Training activities declined due to the reduced market demand as customers completed their standards transition in 2018. Management System Certification reported a moderate revenue decline mainly due to the end of transition audits related to ISO 9001:2015 and 14001:2015 and also the return to normal seasonality patterns. This was partially offset by double-digit growth in medical device certification. Performance Assessment benefited from the recent acquisition of LeanSis in Spain. Organic revenue also increased with growth in most regions, particularly in South America and with large contract wins from the use of the SGS Business Engine data analytics. Training revenue was impacted by the end of the transition work and an overall reduction in demand for ISO-related training courses. Australia experienced delays in both a contract renewal and the opening of a new facility. In North East Asia, China was impacted by the end of transition work which was only partially offset by strong performance in Taiwan. Adjusted operating income margin increased slightly to 17.9% from 17.8% on a constant currency basis. This increase was driven by the addition of higher margin services in Performance Assessment which compensated for a slight decrease in Certification due to post-transition market conditions. Industrial delivered strong organic growth of 6.8% benefiting from large Oil and Gas contracts and recovery in the Infrastructure market. Oil and Gas achieved high double-digit revenue growth driven by large inspection projects in Europe, South America, Africa and Middle East. Manufacturing grew strongly, particularly in the laboratory network. Mining activities increased in South America from new development initiatives. Power and Utilities activity was broadly stable including a strong increase in both earthquake testing in Korea and distribution line inspection in South and Central America. Infrastructure growth continued to be solid benefiting from laboratory testing activities. In the Supervision and Consulting activity a thorough pre-assessment of contracts is being conducted and has already improved execution and margins. Adjusted operating income margin increased significantly to 10.1% from 7.7% on a constant currency basis benefiting from the delivery of more added value services in all segments. The completion of optimization projects improved profitability in Australia, Germany, the USA, Chile and Spain. In addition, actions taken in 2018 improved profitability in Brazil and the business further strengthened its position in laboratory services. ACQUISITIONS • LeanSis Productividad in Spain • Maine Pointe LLC in the USA ACQUISITIONS • Testing, Engineering and Consulting Services, Inc. in the USA
- 10. 10 (CHF million) JUNE 2019 JUNE 2018 CCY2 Change in CCY % JUNE 2018 Change in % REVENUE 261 247 5.7 252 3.6 ADJUSTED OPERATING INCOME¹ 28 25 12.0 26 7.7 MARGIN %¹ 10.7 10.1 10.3 1. Before amortization of acquired intangibles and non-recurring items (see Note 4 page 16) 2. Constant currency (CCY) (CHF million) JUNE 2019 JUNE 2018 CCY2 Change in CCY % JUNE 2018 Change in % REVENUE 257 268 (4.1) 279 (7.9) ADJUSTED OPERATING INCOME¹ 35 41 (14.6) 43 (18.6) MARGIN %¹ 13.6 15.3 15.3 1. Before amortization of acquired intangibles and non-recurring items (see Note 4 page 16) 2. Constant currency (CCY) ENVIRONMENT, HEALTH AND SAFETY TRANSPORTATION Environment, Health Safety achieved good organic growth of 4.9% driven by the strengthening of its position in existing markets and a strategic focus of the business is on growing Laboratory and Health Safety services. Laboratory services reported moderate revenue growth due to increased sample volumes, particularly in Europe and North East Asia. In North America the completion of a large contract in 2018 was partly offset by solid routine and high-end testing in Canada. Recent investments in Australia have begun to deliver a positive impact on Perfluorooctanesulfonic acid (PFOS) testing services. Health Safety services reported double-digit growth from increased sales in Europe in Construction Safety and the hospitality sector, as well as increased Industrial Hygiene activity in the USA. The service line continues to focus on asbestos-related work. Field Monitoring services achieved high single-digit organic growth with an increase in water and soil sampling in Europe and the continuation of monitoring activities in North East Asia. Auditing Compliance services decreased revenue due to dashboard actions taken in 2018 which have benefited underlying margins. The business continues to experience good growth in South America and Asia. Adjusted operating income margin improved to 10.7% from 10.1% on a constant currency basis due to high incremental margin on revenue in Europe and North East Asia. This were supported by recovery in Australia and an upswing in South America. Transportation organic revenue declined by 4.5%. Testing services achieved strong growth but was unable to offset pressure in the other business segments. Regulated services was impacted by price pressure, a reduction in volumes in certain contracts, the completion of a contract, and increased competition in Spain. In addition, there were delays in starting new contracts. Testing services delivered strong growth reflecting high demand from automotive manufacturers and suppliers in China, Europe, India and the USA. The new eMobility laboratory in Germany is ramping up and will be at full capacity during H2. This will enhance capabilities for testing batteries for the new generation of Hybrid and Full Electric Vehicles. Field services reported lower revenue mainly due to Supply Chain Certification, as suppliers completed their certification to the new IATF (International Automotive Task Force) standard. Adjusted operating income margin declined to 13.6% from 15.3% on a constant currency basis due to the higher margin revenue loss in the regulated segment. ACQUISITIONS • Floriaan B.V. in the Netherlands • PT WLN Indonesia
- 11. 11 (CHF million) JUNE 2019 JUNE 2018 CCY2 Change in CCY % JUNE 2018 Change in % REVENUE 129 135 (4.4) 141 (8.5) ADJUSTED OPERATING INCOME¹ 25 39 (35.9) 41 (39.0) MARGIN %¹ 19.4 28.9 29.4 1. Before amortization of acquired intangibles and non-recurring items (see Note 4 page 16) 2. Constant currency (CCY) GOVERNMENTS AND INSTITUTIONS Governments and Institutions organic revenue declined by 4.4%. Growth was impacted by the lengthy implementation and enforcement of local regulations and policies required for the recently signed Government contracts, particularly the eWaste monitoring solution, SGS Renovo. Single Window, a trade facilitation platform, delivered strong revenue growth driven by solid trade volumes, especially in Mozambique and Madagascar. Product Conformity Assessments (PCA) declined moderately. The new import program in Ivory Coast is now fully operational following a six-month pilot phase and partially offset a reduction from the programs in Tanzania and Kenya. Scanning services activity declined mainly due to a reduction in volume in Cameroon. This service should gain momentum in H2 through increased volumes helped by the deployment of an additional scanner. TransitNet experienced strong double-digit growth driven by successful geographical expansion and an increase in market share in Eastern Europe and Middle East. eCustoms achieved strong results which will be further improved by the recent acquisition of i2i Infinity Ltd. Adjusted operating income margin declined to 19.4% from 28.9% on a constant currency basis due to an unfavorable comparison with collection in 2018, collection delays in H1 2019 and a change in scope for certain PCA contracts. These trends should reverse in H2. ACQUISITIONS • i2i Infinity Ltd in the United Kingdom
- 12. 12 CONDENSED INTERIM CONSOLIDATED FINANCIAL STATEMENTS FOR THE PERIOD ENDED 30 JUNE 2019 (CHF million) NOTES JUNE 2019 JUNE 2018 REVENUE 3 341 3 306 Salaries, wages and subcontractors’ expenses (1 924) (1 899) Depreciation, amortisation and impairment (274) (158) Gain on business disposal 272 - Other operating expenses (779) (838) OPERATING INCOME (EBIT) 4 636 411 Net financial expenses (33) (21) Share of profit of associates and joint ventures (1) - PROFIT BEFORE TAXES 602 390 Taxes 7 (203) (94) PROFIT FOR THE PERIOD 399 296 Profit attributable to: Equity holders of SGS SA 377 274 Non-controlling interests 22 22 BASIC EARNINGS PER SHARE (IN CHF) 6 49.90 36.01 DILUTED EARNINGS PER SHARE (IN CHF) 6 49.75 35.98 CONDENSED CONSOLIDATED INCOME STATEMENT CONDENSED CONSOLIDATED STATEMENT OF COMPREHENSIVE INCOME (CHF million) NOTES JUNE 2019 JUNE 2018 Actuarial gains on defined benefit plans 12 11 20 Income tax on actuarial gains/(losses) taken directly to equity (1) (3) Items that will not be subsequently reclassified to income statement 10 17 Exchange differences (37) (56) Items that may be subsequently reclassified to income statement (37) (56) OTHER COMPREHENSIVE INCOME/(LOSS) FOR THE PERIOD (27) (39) Profit for the period 399 296 TOTAL COMPREHENSIVE INCOME FOR THE PERIOD 372 257 Attributable to: Equity holders of SGS SA 352 235 Non-controlling interests 20 22
- 13. 13 CONDENSED CONSOLIDATED BALANCE SHEET (CHF million) JUNE 2019 DECEMBER 2018 NON-CURRENT ASSETS Property, Plant and Equipment 1 557 969 Goodwill and other intangible assets 1 475 1 426 Other non-current assets 337 372 TOTAL NON-CURRENT ASSETS 3 369 2 767 CURRENT ASSETS Unbilled revenues and Work in Progress 242 226 Trade receivables 956 969 Other current assets 759 354 Cash and marketable securities 874 1 752 TOTAL CURRENT ASSETS 2 831 3 301 TOTAL ASSETS 6 200 6 068 TOTAL EQUITY 1 374 1 743 NON-CURRENT LIABILITIES Non-current loans and lease liabilities 2 610 2 112 Provisions and other non-current liabilities 310 238 TOTAL NON-CURRENT LIABILITIES 2 920 2 350 CURRENT LIABILITIES Current loans and lease liabilities 354 378 Trade and other payables 634 709 Contract liabilities 127 112 Other current liabilities 791 776 TOTAL CURRENT LIABILITIES 1 906 1 975 TOTAL LIABILITIES 4 826 4 325 TOTAL EQUITY AND LIABILITIES 6 200 6 068 CONDENSED CONSOLIDATED STATEMENT OF CHANGES IN EQUITY ATTRIBUTABLE TO: (CHF million) NOTES EQUITY HOLDERS OF SGS SA NON-CONTROLLING INTERESTS TOTAL EQUITY BALANCE AT 1 JANUARY 2018 RESTATED 1 832 82 1 914 Total comprehensive income for the period 235 22 257 Dividends paid (573) (4) (577) Share-based payments 6 - 6 Movement in non-controlling interests 4 (6) (2) Movement on treasury shares 54 - 54 BALANCE AS AT 30 JUNE 2018 1 558 94 1 652 BALANCE AT 1 JANUARY 2019 1 668 75 1 743 IFRS 16 adjustments 3 (27) (1) (28) IFRIC 23 adjustments 3 (40) - (40) BALANCE AT 1 JANUARY 2019 RESTATED 1 601 74 1 675 Total comprehensive income for the period 352 20 372 Dividends paid (589) (9) (598) Share-based payments 9 - 9 Movement in non-controlling interests (87) 1 (86) Movement on treasury shares 2 - 2 BALANCE AS AT 30 JUNE 2019 1 288 86 1 374
- 14. 14 1. ACTIVITIES OF THE GROUP SGS SA and its subsidiaries (the “Group”) operate around the world under the name SGS. The head office of the Group is located in Geneva, Switzerland. SGS is the global leader in inspection, verification, testing and certification services supporting international trade in agriculture, minerals, petroleum and consumer products. It also provides these services to governments, international institutions and customers engaged in the industrial, environmental and life science sectors. 2. BASIS OF PREPARATION, SIGNIFICANT TRANSACTION AND SEGMENT INFORMATION RESTATEMENT BASIS OF PREPARATION These financial statements are the unaudited condensed consolidated interim financial statements of the Group for the six months ended 30 June 2019. They have been prepared in accordance with International Accounting Standard 34 “Interim Financial Reporting” and should be read in conjunction with the accounting policies described in the consolidated financial statement of the Group for the year ended 31 December 2018. SIGNIFICANT TRANSACTION As at 21 June 2019, SGS signed an agreement to dispose the Petroleum Services Corporation (PSC) business. SGS assessed that it lost control over PSC from that date due to the restrictions on decision making on key operating and capital decisions. Consequently, SGS recognized a gain of CHF 264 million, net of transaction costs. Other current assets in the Balance Sheet include the proceeds of CHF 320 million to be received. SEGMENT INFORMATION RESTATEMENT The Social Audit activity was transferred, effective as of 1 January 2019, from Consumer and Retail Services (CRS) to Certification and Business Enhancement (CBE). The previously reported 2018 segment disclosures have therefore been restated to reflect this change in organizational structure as disclosed in note 4, impacting Revenue and Adjusted Operating income for an amount of CHF 18 million and CHF 3 million respectively. 3. CHANGES TO THE GROUP’S ACCOUNTING POLICIES As of 1 January 2019, the following standard and interpretation were adopted: IFRS 16 LEASES IFRS 16 sets out the principles for the recognition, measurement, presentation and disclosure of leases and requires lessees to account for most leases under a single on-balance sheet model. The Group has adopted IFRS 16 retrospectively with the cumulative effect in the opening equity as of 1 January 2019. The Group elected to use the transition practical expedient allowing the standard to be applied only to contracts that were previously identified as leases applying IAS 17 and IFRIC 4 at the date of initial application. The Group also elected to use the recognition exemptions for lease NOTES TO THE CONDENSED CONSOLIDATED FINANCIAL STATEMENTS CONDENSED CONSOLIDATED CASH FLOW STATEMENT (CHF million) JUNE 2019 JUNE 2018 PROFIT FOR THE PERIOD 399 296 Non-cash and non-operating items 295 284 Increase in working capital (205) (124) Taxes paid (148) (140) CASH FLOW FROM OPERATING ACTIVITIES 341 316 Net purchase of fixed assets (125) (140) Net acquisition of businesses (143) (41) Decrease/(Increase) in marketable securities and other 6 (1) CASH FLOW USED BY INVESTING ACTIVITIES (262) (182) Dividends paid to equity holders of SGS SA (589) (573) Dividends paid to non-controlling interests (9) (4) Transactions with non-controlling interests (13) (4) Net cash (paid)/received on treasury shares (22) 52 Payment of corporate bonds (375) - Interest paid (56) (45) Payment of lease liabilities (87) - Increase/(Decrease) in borrowings 202 (2) CASH FLOW USED BY FINANCING ACTIVITIES (949) (576) Currency translation (8) (7) DECREASE IN CASH AND CASH EQUIVALENTS (878) (449)
- 15. 15 The following table summarizes the impact on the statement of financial position increase/(decrease) from IFRS 16 and IFRIC 23 adoption as of 1 January 2019. (CHF million) NOTES IFRS 16 ADJUSTMENT IFRIC 23 ADJUSTMENT Property, Plant and Equipment 10 685 - Other non-current assets 9 - Other current asset (8) - TOTAL ASSETS 686 - Equity Holders of SGS SA (27) (40) Non-controlling Interests (1) - TOTAL EQUITY (28) (40) Non-current loans and lease liabilities 10 551 - Provisions and other non-current liabilities 2 - Current loans and lease liabilities 10 162 - Other current liabilities (1) 40 TOTAL LIABILITIES 714 40 The following table reconciles the operating lease disclosures for the year ended 31 December 2018 and the lease liabilities recognized as of 1 January 2019. (CHF million) FUTURE MINIMUM LEASE PAYMENTS AT 31 DECEMBER 2018 573 Weighted average incremental borrowing rate at 1 January 2019 3.53% Discounted future minimum lease payments at 1 January 2019 553 Payments until contractual end date and/or optional extension periods not disclosed at 31 December 2018 160 LEASE LIABILITIES AT 1 JANUARY 2019 713 Following the adoption of IFRS 16 and IFRIC 23 as of 1 January 2019, the Group’s accounting policies have changed as follows: LEASES •• Right-of-use assets The Group recognizes right-of-use assets at the commencement date of the lease. Right-of-use assets are measured at cost, less any accumulated depreciation and impairment losses. They are adjusted for any remeasurement of lease liabilities. The cost of right-of- use assets includes the amount of lease liabilities recognized, initial direct costs incurred and lease payments made at or before the commencement date, less any lease incentives received. Unless the Group is reasonably certain to obtain ownership of the leased asset at the end of the lease term, the recognized right-of-use assets are depreciated on a straight-line basis over the shorter of its estimated useful life and the lease term. Right-of-use assets are subject to impairment. •• Lease liabilities At the commencement date of the lease, the Group recognizes lease liabilities measured at the present value of lease payments to be made over the lease term. The lease payments include fixed payments less any lease incentives receivable, variable lease payments that depend on an index or a rate, and amounts expected to be paid under residual value guarantees. The lease payments also include the exercise price of a purchase option reasonably certain to be exercised by the Group and payments of penalties for terminating a lease, if the lease term reflects the Group exercising the option to terminate. The Group uses the incremental borrowing rate at the lease commencement date if the interest rate implicit in the lease is not readily determinable. After the commencement date, the amount of lease liabilities is increased to reflect the accretion of interest and reduced for the lease payments made. Subsequently, the carrying amount of lease liabilities is remeasured if there is a modification, a change in the lease term, a change in the in-substance fixed lease payments or a change in the assessment to purchase the underlying asset. contracts, which at the commencement date, have a lease term of 12 months or less and do not contain a purchase option (‘short-term leases’), and lease contracts for which the underlying asset is of low value. IFRIC 23 INTERPRETATION UNCERTAINTY OVER INCOME TAX TREATMENT IFRIC 23 addresses the accounting for income taxes when tax treatments involve uncertainty that affects the application of IAS 12 Income Taxes. The Group elected to apply this interpretation retrospectively with the cumulative effect of initially applying the interpretation as an adjustment to the opening equity as of 1 January 2019.
- 16. 16 4. ANALYSIS OF OPERATING INCOME (CHF million) JUNE 2019 JUNE 2018 ADJUSTED OPERATING INCOME 489 481 Amortization and impairment of acquired intangibles (17) (14) Restructuring costs (16) (5) Goodwill impairment (21) - Other non-recurring items1 201 (51) OPERATING INCOME 636 411 1. 2019 includes a gain of CHF 264 million, net of transaction costs, on the disposal of Petroleum Service Corporation (PSC) business in the USA, partially offset by tax provisions and the remeasurement of the defined benefit obligation of the Swiss pension fund. 2018 includes the provision for cumulative overstated revenues in Brazil reported prior to 2018. JUNE 2019 (CHF million) REVENUE ADJUSTED OPERATING INCOME AMORTIZATION OF ACQUISITION INTANGIBLES RESTRUCTURING COSTS GOODWILL IMPAIRMENT OTHER NON-RECURRING ITEMS OPERATING INCOME BY BUSINESS 2019 AFL 525 73 (1) (1) - (10) 61 MIN 375 60 (1) (2) - (6) 51 OGC 620 60 (1) (3) - 254 310 CRS 502 125 (1) (1) - (9) 114 CBE 196 35 - (1) - (5) 29 IND 476 48 (8) (4) (21) (12) 3 EHS 261 28 (2) - - (5) 21 TRP 257 35 (3) (3) - (4) 25 GIS 129 25 - (1) - (2) 22 TOTAL 3 341 489 (17) (16) (21) 201 636 The Group applies the short-term lease and low value recognition exemptions. Lease payments on short-term leases and leases of low-value assets are recognized as expenses on a straight-line basis over the lease term. SIGNIFICANT ACCOUNTING JUDGEMENTS AND ESTIMATES LEASE TERM OF CONTRACTS WITH RENEWAL AND EXIT OPTIONS The Group determines the lease term as the non-cancellable term of the lease, together with any periods covered by an option to extend the lease if it is reasonably certain to be exercised, or any periods covered by an option to terminate the lease, if it is reasonably certain not to be exercised. The Group has the option, under some of its leases to lease the assets for additional terms. The Group applies judgement in evaluating whether it is reasonably certain to exercise the option to renew. That is, it considers all relevant factors that create an economic incentive for it to exercise the renewal. After the commencement date, the Group reassesses the lease term if there is a significant event or change in circumstances that is within its control and affects its ability to exercise (or not to exercise) the option to renew. INCOME TAXES The Group is subject to income taxes in numerous jurisdictions. Significant judgement is required in determining the worldwide provision for income taxes. There are many transactions and calculations for which the ultimate tax determination is uncertain. In assessing how an uncertain tax treatment may affect the determination of the taxable profit (tax loss), the Group assumes that a taxation authority will examine amounts and have full knowledge of all related information. If the Group concludes it is not probable that a taxation authority will accept a particular tax treatment, the Group reflects the effect of each uncertainty in determining the taxable profit (tax loss) by using one of the following methods: •• the single most likely amount •• the sum of probability-weighted amount in a range of possible outcomes. The Group recognizes liabilities for anticipated tax audit issues based on estimates of whether additional taxes will be due, including estimated interest and penalties where appropriate. Where the final tax outcome of these matters is different from the amounts that were initially recorded, such differences will impact the current and deferred income tax assets and liabilities in the period in which such determination is made.
- 17. 17 JUNE 2018 RESTATED (CHF million) REVENUE ADJUSTED OPERATING INCOME AMORTIZATION OF ACQUISITION INTANGIBLES RESTRUCTURING COSTS GOODWILL IMPAIRMENT OTHER NON-RECURRING ITEMS OPERATING INCOME BY BUSINESS 2018 AFL 516 71 (2) (1) - (2) 66 MIN 370 56 - - - - 56 OGC 605 54 (1) (1) - - 52 CRS1 485 122 (2) - - (1) 119 CBE1 196 34 - - - - 34 IND 462 34 (3) (2) - (46) (17) EHS 252 26 (2) - - (1) 23 TRP 279 43 (4) (1) - (1) 37 GIS 141 41 - - - - 41 TOTAL 3 306 481 (14) (5) - (51) 411 1. See Note 2 on Segment information restatement All segment revenues reported above are from external customers. The adjusted operating income represents the profit earned by each segment. This is the main measure reported to the chief operating decision makers for the purposes of resource allocation and assessment of segmental performances. 5. REVENUE FROM CONTRACTS WITH CUSTOMERS GROUP’S REVENUE FROM CONTRACTS WITH CUSTOMERS BY TIMING OF RECOGNITION JUNE 2019 JUNE 2018 (CHF million) SERVICES TRANSFERRED AT A POINT IN TIME SERVICES TRANSFERRED OVER TIME SERVICES TRANSFERRED AT A POINT IN TIME SERVICES TRANSFERRED OVER TIME AFL 84% 16% 100% 84% 16% 100% MIN 65% 35% 100% 65% 35% 100% OGC 60% 40% 100% 60% 40% 100% CRS 84% 16% 100% 84% 16% 100% CBE 96% 4% 100% 97% 3% 100% IND 56% 44% 100% 56% 44% 100% EHS 77% 23% 100% 77% 23% 100% TRP 80% 20% 100% 82% 18% 100% GIS 91% 9% 100% 87% 13% 100% TOTAL 74% 26% 100% 74% 26% 100%
- 18. 18 8. FAIR VALUE MEASUREMENT RECOGNISED IN THE BALANCE SHEET Marketable securities and derivative assets and liabilities are the only financial instruments measured at fair value subsequent to their initial recognition. Marketable securities of CHF 9 million qualify as Level 1 fair value measurement category. Derivative assets of CHF 13 million and liabilities of CHF 10 million qualify as Level 2 fair value measurement category in accordance with the fair value hierarchy. Level 1 fair value measurements are those derived from the quoted price in active markets. Level 2 fair value measurements are those derived from inputs other than quoted prices that are observable for the asset and liability, either directly (i.e. as prices) or indirectly (i.e. derived from prices). Derivative assets and liabilities consist of foreign currency forward contracts that are measured using quoted forward exchange rates and yield curves derived from quoted interest rates matching maturities of the contract. 9. ACQUISITIONS Since January 2019, the Group has completed 7 acquisitions. •• 60% of LeanSis Productividad, a company providing operational and manufacturing training as well as capacity building services in Spain. (effective 21 January 2019). •• 100% of Floriaan B.V., providing fire safety services to industrial and real estate companies in the Netherlands. (effective 5 February 2019). •• 100% of Testing, Engineering and Consulting Services, Inc., a leading independent testing, engineering and consulting services laboratory in the USA (effective 4 April 2019). •• 97.54% of PT WLN Indonesia, a leading provider of water, soil and air testing services in Indonesia (effective 12 April, 2019). •• 100% of Chemical Solutions Ltd, a nationally recognized testing laboratory, specializing in elemental and heavy metal testing for food, nutraceuticals, pharma and cosmetic products in the USA (effective 3 May 2019). •• 100% of of i2i Infinity Ltd, a company providing customs compliance services to exporters and chambers of commerce with the help of innovative proprietary software solutions in the United Kingdom (effective 12 June 2019). •• 60% of Maine Pointe LLC, a supply chain and operations consulting firm delivering business process optimization and improvement in the USA (effective 28 June 2019). These companies were acquired for an amount of CHF 156 million and the total goodwill generated on these transactions amounted to CHF 141 million. All the above transactions contributed a total CHF 10 million in revenues and CHF 3 million in operating income in 2019. Had all acquisitions been effective 1 January 2019, the revenues for the period from these acquisitions would have been CHF 54 million and the operating income would have been CHF 13 million. 6. EARNINGS PER SHARE JUNE 2019 JUNE 2018 Profit attributable to equity holders of SGS SA (CHF million) 377 274 Weighted average number of shares ('000) 7 551 7 607 BASIC EARNINGS PER SHARE (CHF) 49.90 36.01 JUNE 2019 JUNE 2018 Profit attributable to equity holders of SGS SA (CHF million) 377 274 Diluted weighted average number of shares ('000) 7 574 7 612 DILUTED EARNINGS PER SHARE (CHF) 49.75 35.98 (CHF million) JUNE 2019 JUNE 2018 Profit attributable to equity holders of SGS SA 377 274 Amortization of acquired intangibles 17 14 Restructuring costs net of tax 11 4 Goodwill impairment 21 - Other non-recurring items net of tax (146) 50 ADJUSTED PROFIT ATTRIBUTABLE TO EQUITY HOLDERS OF SGS SA 280 342 ADJUSTED BASIC EARNINGS PER SHARE (CHF) 37.04 45.01 ADJUSTED DILUTED EARNINGS PER SHARE (CHF) 36.93 44.97 7. TAXES (CHF million) 2019 2018 Current taxes 143 118 Deferred tax (credit)/expense relating to the origination and reversal of temporary differences 60 (24) TOTAL 203 94
- 19. 19 FAIR VALUE OF ASSETS AND LIABILITIES ARISING FROM THE ACQUISITIONS FOR THE PERIOD: (CHF million) MAINE POINTE LLC OTHER TOTAL Property, plant and equipment - 3 3 Intangible assets - 4 4 Trade receivable 2 5 7 Other current assets 14 - 14 Cash and cash equivalents 14 3 17 Current liabilities (13) (7) (20) Non-current liabilities - (1) (1) Non-controlling interests (7) (2) (9) NET ASSETS ACQUIRED 10 5 15 Goodwill 106 35 141 TOTAL PURCHASE PRICE 116 40 156 Acquired cash and cash equivalents (14) (3) (17) Consideration payable - (1) (1) Payment on prior year acquisitions - 5 5 NET CASH OUTFLOW ON ACQUISITIONS 102 41 143 The identifiable assets and liabilities are recorded at fair value at the date of acquisition. In compliance with IFRS 3, these values determined are provisional and the Group has twelve months from the date of acquisition to finalize the allocation of the acquisition price. In addition, a financial liability of CHF 65 million has been accounted for as Non-current provision. This liability represents the estimated present value of the redemption amount to acquire the remaining 40% of Maine Pointe LLC in June 2022, if the call/put option is exercised. The fair value of the redemption amount has been estimated by applying a discounted valuation method using an average revenue growth ranging from 8% to 12%, an EBITDA margin ranging from 22% to 25% and a 3% discount rate. 10. RIGHT-OF-USE ASSETS AND LEASE LIABILITES The right-of-use assets are reported under Property, plant and equipment. The following table discloses the movements of the right-of-use assets and the leaes liabilities during the period. RIGHT-OF-USE ASSETS TOTAL TOTAL LEASE LIABILITIES (CHF million) LANDS AND BUILDING MACHINERY AND EQUIPMENT OTHER TANGIBLE ASSETS AT 1 JANUARY 585 90 10 685 713 Additions 22 17 - 39 39 Depreciation expense (63) (23) (3) (89) - Interest expense - - - - 9 Payment of lease liabilities and interests - - - - (97) Exchange difference and other (7) (11) - (18) (17) AT 30 JUNE 537 73 7 617 647 11. GOODWILL (CHF million) JUNE 2019 JUNE 2018 COST At 1 January 1 224 1 238 Additions 141 31 Consideration on prior years’ acquisitions (5) - Disposal (32) - Impairment (21) - Exchange differences (13) (18) AT 30 JUNE 1 294 1 251 The goodwill arising on acquisitions relates to the value of the underlying business and expected synergies as well as the value of the qualified workforce that do not meet the criteria for recognition as separable intangible assets. None of the goodwill arising on these acquisitions is expected to be tax deductible.
- 20. 20 DISCLAIMER This material is provided for information purposes only and is not intended to confer any legal rights to you. This document does not constitute an invitation to invest in SGS shares. Any decisions you make in reliance on this information are solely your responsibility. This document is given as of the dates specified, is not updated and any forward-looking statements are made subject to the following reservations: This document contains certain forward-looking statements that are neither historical facts nor guarantees of future performance. Because these statements involve risks and uncertainties that are beyond control or estimation of SGS, there are important factors that could cause actual results to differ materially from those expressed or implied by these forward-looking statements. These statements speak only as of the date of this document. Except as required by any applicable law or regulation, SGS expressly disclaims any obligation to release publicly any updates or revisions to any forward looking statements contained herein to reflect any change in SGS Group’s expectations with regard thereto or any change in events or conditions on which any such statements are based. 12. RETIREMENT BENEFIT OBLIGATIONS During the period, an interim assessment of employee benefit obligations and actual return on plan assets has been performed for the major defined benefit pension plans. A resulting decrease in net pension liabilities of CHF 11 million has been recorded in the statement of comprehensive income. 13. APPROVAL OF INTERIM FINANCIAL STATEMENTS AND SUBSEQUENT EVENTS These condensed interim financial statements were authorized for issue by the Board of Directors on 17 July 2019. On 16 July 2019, the Group announced the acquisition of 100% of Forensic Analytical Laboratories, Inc (FALI), one of the leading providers of industrial hygiene, based in the USA. 14. EXCHANGE RATES The most significant currencies for the Group were translated at the following exchange rates into Swiss Francs. BALANCE SHEET PERIOD-END RATES INCOME STATEMENT REPORTING PERIOD AVERAGE RATES JUNE 2019 DECEMBER 2018 JUNE 2019 JUNE 2018 Australia AUD 100 68.44 69.51 70.59 74.57 Brazil BRL 100 25.54 25.44 26.01 28.34 Canada CAD 100 74.56 72.41 74.93 75.71 Chile CLP 100 0.14 0.14 0.15 0.16 China CNY 100 14.21 14.35 14.74 15.18 Eurozone EUR 100 111.05 112.91 112.96 117.03 United Kingdom GBP 100 123.71 124.67 129.32 133.03 Russia RUB 100 1.55 1.42 1.53 1.63 Taiwan TWD 100 3.15 3.22 3.23 3.27 USA USD 100 97.56 98.55 99.98 96.68
- 22. 22 SHAREHOLDER INFORMATION SGS SA CORPORATE OFFICE 1 place des Alpes P.O. Box 2152 CH – 1211 Geneva 1 t +41 (0)22 739 91 11 f +41 (0)22 739 98 86 e sgs.investor.relations@sgs.com www.sgs.com STOCK EXCHANGE LISTING SIX Swiss Exchange, SGSN STOCK EXCHANGE TRADING SIX Swiss Exchange COMMON STOCK SYMBOLS Bloomberg: Registered Share: SGSN.SW Reuters: Registered Share: SGSN.S Telekurs: Registered Share: SGSN ISIN: Registered Share: CH0002497458 Swiss security number: 249745 INVESTOR RELATIONS Toby Reeks SGS SA 1 place des Alpes P.O. Box 2152 CH – 1211 Geneva 1 t +41 (0)22 739 99 87 m +41 (0)79 641 83 02 www.sgs.com INVESTOR DAYS – CHINA AND TAIWAN Thursday and Friday 7 – 8 November 2019 2019 FULL YEAR RESULTS Tuesday, 28 January 2020 ANNUAL GENERAL MEETING OF SHAREHOLDERS Tuesday, 24 March 2020 Geneva, Switzerland MEDIA RELATIONS Daniel Rufenacht SGS SA 1 place des Alpes P.O. Box 2152 CH – 1211 Geneva 1 t +41 (0)22 739 94 01 m +41 (0)78 656 94 59 www.sgs.com