SLOPE 3rd workshop - presentation 1
•
0 j'aime•312 vues

General presentation of NIR technology in aspect of wood

Recommandé
Recommandé
Contenu connexe
Tendances
Tendances (8)
En vedette
En vedette (20)
Similaire à SLOPE 3rd workshop - presentation 1
Similaire à SLOPE 3rd workshop - presentation 1 (20)
Plus de SLOPE Project
Plus de SLOPE Project (20)
Dernier
Dernier (20)
SLOPE 3rd workshop - presentation 1
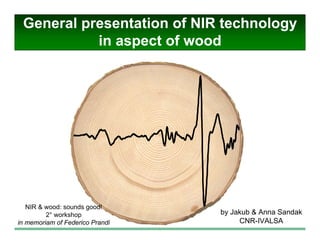
- 1. General presentation of NIR technology in aspect of wood by Jakub & Anna Sandak CNR-IVALSA NIR & wood: sounds good! 2° workshop in memoriam of Federico Prandi
- 2. 2 Outline Introduction to spectroscopy 78910111213141516171819 -0,00001 0,000005 54505950645069507450 wavenumber (cm -1 ) 2 nd derofNIRabsorbance NT 239ºC, 1h, 250mb 239ºC, 2h, 1000mb 240ºC, 6.6h, 250mb Spectra analysis & interpretation How to use NIR with wood NIR applications in wood S&T
- 3. 3 Herschel directed sunlight through a glass prism to create a spectrum and measured the temperature of each color the temperature of the colors increased from the violet to the red part of the spectrum after further studying, he concluded that there must be an invisible form of light beyond the visible spectrum NIR spectroscopy The history of NIR begins in 1800 with Frederick William Herschel it was the first time that someone showed that there were forms of light that we cannot see with our eyes
- 4. 4 Electromagnetic spectrum 1016 1018 1020 1022 1024 1014 1012 104 106 108 1010 100 102 10-16 10-14 10-12 10-10 10-8 10-6 10-4 10-2 100 102 104 106 108 frequency, ν (Hz) wavelength, λ (m) γ rays x rays UV mikrowave radio waves long radio waves FM AM 400nm 500nm 600nm 700nm near infrared NIR mid infrared MIR far infrared FIR 1μm 10μm 100μm visible light IR
- 5. 5 Principle of molecular vibrations • Spectroscopy provides information about the vibrations of functional groups in a molecule • Every molecule has specific vibration frequencies • When polar molecule is exposed to infrared light its starts vibrate since certain frequency is absorbed • Consequently a change in dipol moment of the molecule occurs
- 6. 6 Source of spectra TwistingWaggingRocking Scissoringasimmetric stretching simmetric stretching Spectra represents molecular vibrations of chemical molecules exposed to infrared light. http://en.wikipedia.org/wiki/Infrared_spectroscopy
- 7. 7 Spectrum NIR third overtones second overtones first overtones combinations bands www.asdi.com
- 8. 8 Band assignment - wood code wavenumber (cm -1 ) band assignment 1 4198 CH deformation in holocellulose 2 4280 CH stretching + CH deformation in semi- and crystalline region in cellulose 3 4404 CH2 stretching + CH2 deformation of cellulose 4 4620 OH stretching + CH deformation of cellulose 5 4890 OH stretching + CH deformation of cellulose 6 5219 OH stretching + OH deformation of water 7 5464 OH stretching + CH stretching semi- or crystalline regions of cellulose 8 5587 CH stretching semi- or crystalline regions of cellulose 9 5800 CH stretching in furanose/pyranose due to hemicelluloses 10 5883 CH stretching in aliphatic chains 11 5935 CH stretching of aromatic skeletal in lignin 12 5980 CH stretching of aromatic skeletal in lignin 13 6287 OH stretching in crystalline region in cellulose 14 6450 OH stretching in crystalline region in cellulose 15 6722 OH stretching in semi-crystalline region in cellulose 16 6785 OH stretching in semi-crystalline region of cellulose 17 7008 OH stretching in amorphous region in cellulose 18 7309 CH stretching in aliphatic chains 19 7418 CH stretching in aliphatic chains around 100 bands assigned to wood components (Schwanninger et al. 2011)
- 9. 9 NIR technique No need special sample preparation Non-destructive testing Relatively fast measurement No residues/solvents to waste Possibility for determination of many components simultaneously High degree of precision and accuracy Direct measurement with very low cost Needs sophisticated statistics methods for data analysis Overlapping of spectral peaks
- 10. 10 NIR & wood: scale Inspired by artwork by Mark Harrington (http://www.nzwood.co.nz)Inspired by artwork by Mark Harrington (http://www.nzwood.co.nz)
- 11. 11 NIR & wood: applications
- 12. 12 Measuring NIR on wood: CNR-IVALSA experiences 2. experimental design 1.problem definition 9. sample presentation 10. measurement 12. storage of results 16. calibration: qualitative analysis 17. validation of qualitative model 21. implementation of chemometric models for identification 3. sample selection 4. sample preparation 5. sample conditioning 6. istrument selection 7. instrument set-up 8. optimization of the set-up 13. exploratory analysis 15. optimal data set of spectra 14. spectra pre-processing 18. calibration: quantitative analysis 19. validation of quantitative model 22. implementation of chemometric models for prediction 20. interpretation of spectra 23. generalization of knowledge 11. reference characterizations
- 13. 13 Measuring NIR on wood: CNR-IVALSA experiences 2. experimental design 1.problem definition 9. sample presentation 3. sample selection 4. sample preparation 5. sample conditioning 6. istrument selection 7. instrument set-up 8. optimization of the set-up
- 14. 14 Measuring NIR on wood: CNR-IVALSA experiences 9. sample presentation 10. measurement 12. storage of results 5. sample conditioning 8. optimization of the set-up 13. exploratory analysis 15. optimal data set of spectra 14. spectra pre-processing 11. reference characterizations
- 15. 15 Measuring NIR on wood: CNR-IVALSA experiences 16. calibration: qualitative analysis 17. validation of qualitative model 21. implementation of chemometric models for identification 15. optimal data set of spectra 18. calibration: quantitative analysis 19. validation of quantitative model 22. implementation of chemometric models for prediction 20. interpretation of spectra 23. generalization of knowledge
- 16. 16 What can NIR measure on wood? absorbance + scatter (not lignin, cellulose, density…)
- 17. 17 wood characteristics influencing NIR measurement • sample state: solid, chipped, milled … • sample age: surface deactivation, oxidation and aging … • material properties: density, porosity, moisture, roughness … • degradation due to biotic agents: fungal decay, damage by insects, bacteria … • degradation due to a-biotic agents: waterlogging, weathering, ageing, chemical degradation … • presence, position, quantity of wood defects: knots, checks, slope of grain … • mechanical damages and geometrical alterations: cracks, delaminations, distortions, deformations …
- 18. 18 Raw spectra (absorbance) ● 60°C ▼80°C ▲100°C ■120°C ■140°C ●160°C ●180°C ●200°C 200°C 180°C 160°C 140°C 120°C 100°C 80°C 60°C
- 19. 19 Second derivative -0,00007 0 0,00007 40004500500055006000650070007500800085009000950010000 60°C 80°C 100°C 120°C 140°C 160°C 180°C 200°C a b -0,0000125 0 0,0000125 550056005700580059006000610062006300640065006600670068006900700071007200730074007500 drugapochodnaabsorbancji liczba falowa (cm -1 ) a -0,00007 0 0,00007 410042004300440045004600470048004900500051005200530054005500 liczba falowa (cm -1 ) liczba falowa (cm -1 ) b
- 20. 20 NIR: state-of-the-art instrumentation • Fourier transform near infrared spectroscopy • Dispersive fixed grating diode array (DA) • NIR spectrometer with linear variable filter (LVF) • Scanning grating or dispersive monochromator (DM) • Acoustic Optical Tunable Filters (AOTF) • Micro-Electro-Mechanical-Systems (MEMS) • Multispectral and hyperspectral cameras • ???
- 21. 21 What NIR instrument for wood? FT-NIR DA LVF DM AOTF MEMS cameras Spectral range full limited limited full limited limited full Scanning time (s) slow very fast very fast fast very fast very fast fast resolution very high high limited high limited limited high cost high middle low middle middle middle high Signal/noise high limited limited high limited limited high Calibrations transfer very good good good very good good limited limited Shock resistance no yes yes no yes yes yes
- 22. 22 Error of measurement in relation to number of averages
- 23. 23 Measurement of wood in forest
- 26. 26 teachingvalidation calibration and validation: strategy 1 20% for validation (80% for building model)
- 27. 27 teachingvalidation calibration and validation: strategy 2 1 measure for validation (4 measures for teaching)
- 28. 28 How to measure wood: strategy
- 29. 29 When we have more spectra to be analyzed...
- 30. 30 11463,4 3,75E 06 6,18E 07 3,74E 06 6,44E 06 1,81E 05 11459,54 -4E-06 2,76E-06 -4,71E-06 8,89E-06 -1,05E-05 11455,69 -3,61E-06 4,35E-06 -4,85E-06 9,23E-06 -1,68E-07 11451,83 -2,63E-06 4,01E-06 -3,96E-06 6,87E-06 7,06E-06 11447,97 -1,62E-06 2,06E-06 -3,05E-06 2,36E-06 1E-05 11444,12 -7,8E-07 1,85E-07 -2,22E-06 -2,63E-06 1,1E-05 11440,26 5,39E-07 -3,64E-07 -9,63E-07 -5,46E-06 1,12E-05 11436,4 2,28E-06 1,1E-07 6,89E-07 -4,93E-06 1,05E-05 11432,54 3,39E-06 3,76E-07 2,28E-06 -2,83E-06 7,64E-06 11428,69 3,59E-06 -9,77E-08 3,19E-06 -1,25E-06 2,92E-06 11424,83 3,23E-06 -4,28E-07 2,89E-06 -1,43E-07 -4,23E-08 11420,97 2,34E-06 -1,84E-07 1,6E-06 9,09E-07 1,39E-06 11417,12 1,51E-06 -4,19E-07 7,63E-07 1,57E-06 4,32E-06 11413,26 1,14E-06 -1,38E-06 1,32E-06 2,03E-06 4,9E-06 11409,4 4,71E-07 -1,65E-06 2,06E-06 2,71E-06 3,71E-06 11405,54 -8,71E-07 -2,68E-07 1,29E-06 3,69E-06 3,13E-06 11401,69 -2,43E-06 2,19E-06 -9,82E-07 4,45E-06 2,86E-06 11397,83 -3,41E-06 4,18E-06 -2,47E-06 4,04E-06 2,1E-06 11393,97 -3,25E-06 4,6E-06 -1,53E-06 2,63E-06 1,37E-06 11390,12 -2,72E-06 3,66E-06 -2,31E-07 1,15E-06 -4,05E-07 11386,26 -2,48E-06 2,27E-06 -5,15E-07 -3,67E-07 -3,91E-06 11382,4 -1,78E-06 1,48E-06 -7,5E-07 -1,39E-06 -6,75E-06 11378,54 -2,2E-07 1,48E-06 2,56E-07 -1,14E-06 -7,87E-06 11374,69 1,37E-06 1,2E-06 1,51E-06 -5,35E-07 -7,82E-06 11370,83 2,35E-06 8,1E-08 2,43E-06 2,77E-07 -5,29E-06 11366,97 2,85E-06 -8,2E-07 3,2E-06 2,49E-06 4,6E-07 11363,12 2,91E-06 -8,24E-07 3,4E-06 4,99E-06 7,01E-06 11359,26 2,6E-06 -9,45E-07 2,66E-06 5,18E-06 1,02E-05 11355,4 2,21E-06 -2,29E-06 1,43E-06 3,26E-06 7,83E-06 11351,54 1,14E-06 -3,86E-06 -5,78E-07 1,41E-06 2,49E-06 11347,69 -1,1E-06 -3,84E-06 -3,7E-06 3,02E-07 -6,54E-07 11343,83 -2,91E-06 -1,93E-06 -6,06E-06 -5,22E-07 4,49E-08 11339,97 -2,69E-06 8,6E-07 -5,7E-06 -6,25E-07 1,28E-06 11336,12 -1,03E-06 3,37E-06 -3,08E-06 3,23E-07 1,05E-06 11332,26 4,87E-07 4,49E-06 -2,53E-07 8,42E-07 9,15E-08 11328,4 9,16E-07 3,76E-06 1E-06 -7,84E-07 -1,72E-06 11324,54 8,93E-07 1,99E-06 1,3E-06 -3,9E-06 -4,09E-06 11320,69 1,74E-06 7,13E-07 2,46E-06 -6,47E-06 -5,53E-06 11316,83 3,27E-06 7,03E-07 3,97E-06 -7,37E-06 -4,99E-06 11312,97 3,82E-06 1,09E-06 4,05E-06 -6,37E-06 -2,53E-06 11309,12 2,51E-06 8,56E-07 2,68E-06 -3,81E-06 6,84E-08 11305,26 6,46E-07 5,1E-09 1,2E-06 -1,59E-06 1,43E-06 11301,4 -7,48E-08 -1,37E-06 3,06E-07 -1,79E-06 1,65E-06 11297,54 1,12E-07 -2,94E-06 -4,32E-07 -3,4E-06 8,21E-07 11293,69 3,23E-08 -3,87E-06 -1,3E-06 -3,25E-06 -2E-07 11289,83 -2,5E-07 -3,75E-06 -1,56E-06 -8,01E-07 1,68E-07 11285,97 1,12E-07 -2,91E-06 -2,9E-07 1,47E-06 2,01E-06 11282,12 9,86E-07 -1,78E-06 1,9E-06 2,22E-06 3,42E-06 11278,26 1,22E-06 -5,37E-07 3,09E-06 2,66E-06 3,36E-06 11274,4 4,17E-07 3E-07 2,65E-06 3,43E-06 3,07E-06 11270,54 -5,28E-07 3,78E-07 1,57E-06 3,28E-06 2,81E-06 11266,69 -8,57E-07 2,74E-07 3,78E-07 1,81E-06 1,92E-06 11262,83 -7,25E-07 8,58E-07 -8,41E-07 5,09E-07 9,22E-07 11258,97 -7,78E-07 2,13E-06 -2,12E-06 3,67E-07 7,82E-07 11255,12 -1,6E-06 3,05E-06 -3,68E-06 1,08E-06 2,19E-06 11251,26 -3,1E-06 2,97E-06 -5,32E-06 2,21E-06 4,57E-06 11247,4 -4,37E-06 2,29E-06 -6,17E-06 3,01E-06 5,81E-06 11243,54 -4,38E-06 1,07E-06 -5,23E-06 2,68E-06 4,7E-06 11239,69 -3,01E-06 -8,1E-07 -2,84E-06 1,45E-06 2,12E-06 11235,83 -1,22E-06 -2,38E-06 -4,52E-07 3,51E-07 6,91E-08 11231,97 3,19E-07 -3E-06 1,34E-06 -3,03E-07 -9,44E-07 11228,12 1,94E-06 -3,58E-06 3,04E-06 -1,55E-06 -2,29E-06 11224,26 3,47E-06 -4,55E-06 4,69E-06 -4,13E-06 -4,43E-06 11220,4 3,87E-06 -4,94E-06 5,41E-06 -6,37E-06 -6,58E-06 11216,54 2,98E-06 -3,96E-06 4,68E-06 -6,29E-06 -7,38E-06 11212,69 1,84E-06 -1,98E-06 3,14E-06 -4,7E-06 -5,96E-06 11208,83 1,2E-06 1,34E-08 1,7E-06 -3E-06 -3,79E-06 11204,97 6,7E-07 1,39E-06 7,06E-07 -1,09E-06 -2,89E-06 11201,12 -5,58E-07 2,37E-06 -1,98E-07 1,12E-06 -2,74E-06 11197,26 -2,42E-06 3,24E-06 -1,39E-06 3,42E-06 -1,37E-06 11193,4 -3,65E-06 3,79E-06 -2,31E-06 5,5E-06 1,75E-06 11189,54 -3,71E-06 3,93E-06 -2,48E-06 6,5E-06 5,48E-06 11185,69 -3,36E-06 3,73E-06 -2,15E-06 6,27E-06 7,45E-06 11181,83 -2,59E-06 3,18E-06 -1,27E-06 5,8E-06 6,19E-06 11177,97 -1,11E-06 2,69E-06 -4,1E-07 5,54E-06 3,52E-06 11174,12 3,77E-07 2,52E-06 -1,92E-07 4,43E-06 1,39E-06 11170,26 1,27E-06 2,02E-06 -1,1E-07 1,91E-06 -1,38E-06 11166,4 1,61E-06 9,27E-07 6,8E-09 -6,16E-07 -4,84E-06 11162,54 1,71E-06 2,68E-07 1,72E-08 -1,74E-06 -6,09E-06 11158,69 1,89E-06 7,29E-07 1,21E-07 -1,71E-06 -4,26E-06 11154,83 1,91E-06 1,54E-06 -8,06E-08 -1,55E-06 -1,28E-06 11150,97 1,38E-06 1,91E-06 -8,32E-07 -1,47E-06 1,35E-06 11147,12 5,42E-07 1,83E-06 -1,18E-06 -8,82E-07 3,04E-06 11143,26 4,53E-08 1,26E-06 -5,33E-07 -6,16E-07 3,27E-06 11139,4 -1,06E-07 -1,44E-07 1,04E-07 -1,97E-06 2,54E-06 11135,54 -3,02E-07 -2,15E-06 -9,26E-08 -3,91E-06 2,47E-06 11131,69 -5,26E-07 -4,16E-06 -6,26E-07 -5,14E-06 2,91E-06 11127,83 -8,12E-07 -5,67E-06 -9,87E-07 -5,59E-06 2,01E-06 11312,97 3,82E-06 1,09E-06 4,05E-06 -6,37E-06 -2,53E-06 11309,12 2,51E-06 8,56E-07 2,68E-06 -3,81E-06 6,84E-08 11305,26 6,46E-07 5,1E-09 1,2E-06 -1,59E-06 1,43E-06 11301,4 -7,48E-08 -1,37E-06 3,06E-07 -1,79E-06 1,65E-06 11297,54 1,12E-07 -2,94E-06 -4,32E-07 -3,4E-06 8,21E-07 11293,69 3,23E-08 -3,87E-06 -1,3E-06 -3,25E-06 -2E-07 11289,83 -2,5E-07 -3,75E-06 -1,56E-06 -8,01E-07 1,68E-07 11285,97 1,12E-07 -2,91E-06 -2,9E-07 1,47E-06 2,01E-06 11282,12 9,86E-07 -1,78E-06 1,9E-06 2,22E-06 3,42E-06 11278,26 1,22E-06 -5,37E-07 3,09E-06 2,66E-06 3,36E-06 11274,4 4,17E-07 3E-07 2,65E-06 3,43E-06 3,07E-06 11270,54 -5,28E-07 3,78E-07 1,57E-06 3,28E-06 2,81E-06 11266,69 -8,57E-07 2,74E-07 3,78E-07 1,81E-06 1,92E-06 11262,83 -7,25E-07 8,58E-07 -8,41E-07 5,09E-07 9,22E-07 11258,97 -7,78E-07 2,13E-06 -2,12E-06 3,67E-07 7,82E-07 11255,12 -1,6E-06 3,05E-06 -3,68E-06 1,08E-06 2,19E-06 11251,26 -3,1E-06 2,97E-06 -5,32E-06 2,21E-06 4,57E-06 11247,4 -4,37E-06 2,29E-06 -6,17E-06 3,01E-06 5,81E-06 11243,54 -4,38E-06 1,07E-06 -5,23E-06 2,68E-06 4,7E-06 11239,69 -3,01E-06 -8,1E-07 -2,84E-06 1,45E-06 2,12E-06 11235,83 -1,22E-06 -2,38E-06 -4,52E-07 3,51E-07 6,91E-08 11231,97 3,19E-07 -3E-06 1,34E-06 -3,03E-07 -9,44E-07 11228,12 1,94E-06 -3,58E-06 3,04E-06 -1,55E-06 -2,29E-06 11224,26 3,47E-06 -4,55E-06 4,69E-06 -4,13E-06 -4,43E-06 11220,4 3,87E-06 -4,94E-06 5,41E-06 -6,37E-06 -6,58E-06 11216,54 2,98E-06 -3,96E-06 4,68E-06 -6,29E-06 -7,38E-06 11212,69 1,84E-06 -1,98E-06 3,14E-06 -4,7E-06 -5,96E-06 11208,83 1,2E-06 1,34E-08 1,7E-06 -3E-06 -3,79E-06 11204,97 6,7E-07 1,39E-06 7,06E-07 -1,09E-06 -2,89E-06 11201,12 -5,58E-07 2,37E-06 -1,98E-07 1,12E-06 -2,74E-06 11197,26 -2,42E-06 3,24E-06 -1,39E-06 3,42E-06 -1,37E-06 11193,4 -3,65E-06 3,79E-06 -2,31E-06 5,5E-06 1,75E-06 11189,54 -3,71E-06 3,93E-06 -2,48E-06 6,5E-06 5,48E-06 11185,69 -3,36E-06 3,73E-06 -2,15E-06 6,27E-06 7,45E-06 11181,83 -2,59E-06 3,18E-06 -1,27E-06 5,8E-06 6,19E-06 11177,97 -1,11E-06 2,69E-06 -4,1E-07 5,54E-06 3,52E-06 11174,12 3,77E-07 2,52E-06 -1,92E-07 4,43E-06 1,39E-06 11170,26 1,27E-06 2,02E-06 -1,1E-07 1,91E-06 -1,38E-06 11166,4 1,61E-06 9,27E-07 6,8E-09 -6,16E-07 -4,84E-06 11162,54 1,71E-06 2,68E-07 1,72E-08 -1,74E-06 -6,09E-06 11158,69 1,89E-06 7,29E-07 1,21E-07 -1,71E-06 -4,26E-06 11154,83 1,91E-06 1,54E-06 -8,06E-08 -1,55E-06 -1,28E-06 11150,97 1,38E-06 1,91E-06 -8,32E-07 -1,47E-06 1,35E-06 11147,12 5,42E-07 1,83E-06 -1,18E-06 -8,82E-07 3,04E-06 11143,26 4,53E-08 1,26E-06 -5,33E-07 -6,16E-07 3,27E-06 11139,4 -1,06E-07 -1,44E-07 1,04E-07 -1,97E-06 2,54E-06 11135,54 -3,02E-07 -2,15E-06 -9,26E-08 -3,91E-06 2,47E-06 11131,69 -5,26E-07 -4,16E-06 -6,26E-07 -5,14E-06 2,91E-06 11127,83 -8,12E-07 -5,67E-06 -9,87E-07 -5,59E-06 2,01E-06 11123,97 -1,07E-06 -5,99E-06 -9,32E-07 -4,77E-06 -5,5E-07 11120,12 -8,48E-07 -5E-06 -3,8E-07 -2,78E-06 -3,55E-06 11116,26 -4,42E-07 -3,67E-06 5,93E-08 -1,08E-06 -5,78E-06 11112,4 -5,25E-07 -2,73E-06 1,25E-07 -1,4E-07 -6,57E-06 11108,54 -8,82E-07 -1,73E-06 3,38E-07 1,02E-06 -6,36E-06 11104,69 -7,89E-07 -1,09E-07 8,34E-07 2,7E-06 -5,51E-06 11100,83 1,98E-07 1,95E-06 1,56E-06 4,09E-06 -3,27E-06 11096,97 1,79E-06 3,46E-06 2,49E-06 4,35E-06 -2,51E-07 11093,12 2,85E-06 3,73E-06 2,99E-06 3,65E-06 2,06E-06 11089,26 2,75E-06 3,36E-06 2,87E-06 3,13E-06 3,89E-06 11085,4 2,36E-06 3,12E-06 2,69E-06 2,96E-06 5,55E-06 11081,54 2,22E-06 2,63E-06 2,18E-06 1,91E-06 5,3E-06 11077,69 1,4E-06 1,3E-06 5,32E-07 -4,23E-07 2,2E-06 11073,83 -4,44E-07 -4,48E-07 -1,61E-06 -2,86E-06 -1,44E-06 11069,97 -1,92E-06 -1,73E-06 -2,7E-06 -4,26E-06 -3,6E-06 11066,12 -2,03E-06 -1,96E-06 -2,35E-06 -4,28E-06 -4,1E-06 11062,26 -1,35E-06 -1E-06 -1,45E-06 -3,07E-06 -2,58E-06 11058,4 -7,96E-07 3,84E-07 -7,88E-07 -1,24E-06 3,19E-08 11054,54 -5,68E-07 1,08E-06 -6,75E-07 5,17E-07 2,1E-06 11050,69 -7,57E-07 1,07E-06 -1,09E-06 1,83E-06 2,97E-06 11046,83 -1,23E-06 1,05E-06 -1,68E-06 2,43E-06 2,02E-06 11042,97 -1,22E-06 8,26E-07 -1,87E-06 2,21E-06 1,97E-07 11039,12 -4,57E-07 8,96E-08 -1,2E-06 1,75E-06 1,15E-07 11035,26 3,08E-07 -6,7E-07 -8,2E-09 1,39E-06 2,03E-06 11031,4 4,35E-07 -1,14E-06 7,6E-07 6,79E-07 3,82E-06 11027,54 2,7E-07 -1,2E-06 6,69E-07 -6,2E-08 4,05E-06 11023,69 4,45E-07 -8,16E-07 2,52E-07 -5,26E-07 1,92E-06 11019,83 5,64E-07 -4,67E-07 -1,9E-07 -1,66E-06 -2,69E-06 11015,97 1,34E-07 -3,25E-07 -5,76E-07 -3,21E-06 -7,07E-06 11012,12 1,24E-07 -1,88E-07 -1,34E-07 -3,5E-06 -8,2E-06 11008,26 1,39E-06 6,71E-08 1,45E-06 -1,93E-06 -6,67E-06 11004,4 3,03E-06 5,88E-07 3,18E-06 5,62E-07 -3,87E-06 11000,54 3,93E-06 1,13E-06 4,4E-06 2,39E-06 1,19E-07 10996,69 4,01E-06 1,17E-06 5,08E-06 2,98E-06 4,45E-06 10992,83 3,32E-06 8,62E-07 4,62E-06 2,92E-06 7,31E-06 10988,97 1,69E-06 7,72E-07 2,79E-06 2,08E-06 6,85E-06 10985,12 -4,76E-07 7,94E-07 5,63E-07 3,24E-07 3,4E-06 10981,26 -2,2E-06 4,13E-07 -9,28E-07 -8,47E-07 7,43E-07 10977 4 3 05E 06 7 37E 08 1 34E 06 2 23E 07 1 41E 06 11999,54 -1,96E-06 -1,93E-06 -3,96E-06 9,97E-06 -3,92E-05 11995,69 -1,96E-06 -1,93E-06 -3,96E-06 9,97E-06 -3,92E-05 11991,83 -1,96E-06 -1,93E-06 -3,96E-06 9,97E-06 -3,92E-05 11987,97 -1,96E-06 -1,93E-06 -3,96E-06 9,97E-06 -3,92E-05 11984,11 -1,96E-06 -1,93E-06 -3,96E-06 9,97E-06 -3,92E-05 11980,26 -1,96E-06 -1,93E-06 -3,96E-06 9,97E-06 -3,92E-05 11976,4 -1,96E-06 -1,93E-06 -3,96E-06 9,97E-06 -3,92E-05 11972,54 -1,96E-06 -1,93E-06 -3,96E-06 9,97E-06 -3,92E-05 11968,69 -1,96E-06 -1,93E-06 -3,96E-06 9,97E-06 -3,92E-05 11964,83 -1,52E-06 3,79E-08 -3,16E-06 1,35E-05 -3,58E-05 11960,97 -8,16E-07 1,33E-06 -1,66E-06 1,53E-05 -1,78E-05 11957,11 -7,85E-07 1,76E-06 -1,13E-06 1,3E-05 1,54E-06 11953,26 -6,13E-07 3E-06 -1,43E-06 6,14E-06 1,35E-05 11949,4 -1,17E-07 5,8E-06 -1,67E-06 -3,48E-06 2,12E-05 11945,54 -3,61E-07 8,11E-06 -2,8E-06 -1,09E-05 2,7E-05 11941,69 -1,54E-06 7,46E-06 -5,01E-06 -1,39E-05 2,88E-05 11937,83 -2,82E-06 3,82E-06 -6,03E-06 -1,6E-05 2,43E-05 11933,97 -3,56E-06 -2,6E-07 -5,06E-06 -1,81E-05 1,48E-05 11930,11 -3,56E-06 -2,66E-06 -3,03E-06 -1,65E-05 1,09E-05 11926,26 -2,73E-06 -3,75E-06 -5E-09 -1,05E-05 1,97E-05 11922,4 -9,14E-07 -4,32E-06 3,2E-06 -2,92E-06 3E-05 11918,54 1,43E-06 -4,86E-06 5,11E-06 3,04E-06 2,87E-05 11914,69 3,08E-06 -5,44E-06 6,11E-06 7,07E-06 1,78E-05 11910,83 4,03E-06 -5,08E-06 7,4E-06 1,15E-05 4,11E-06 11906,97 5,01E-06 -3,6E-06 8,7E-06 1,61E-05 -8,45E-06 11903,11 4,98E-06 -2,5E-06 8,53E-06 1,71E-05 -1,77E-05 11899,26 2,97E-06 -2,56E-06 5,83E-06 1,22E-05 -2,77E-05 11895,4 -1,29E-07 -2,57E-06 4,49E-07 3,92E-06 -4,21E-05 11891,54 -3,17E-06 -1,91E-06 -5,99E-06 -4,86E-06 -5,32E-05 11887,69 -5E-06 -1,23E-06 -1,04E-05 -1E-05 -4,41E-05 11883,83 -4,51E-06 2,04E-07 -1,14E-05 -6,3E-06 -5,29E-06 11879,97 -2,72E-06 2,61E-06 -1,04E-05 1,34E-06 3,57E-05 11876,11 -1,99E-06 4E-06 -8,74E-06 2,08E-06 4,26E-05 11872,26 -2,12E-06 3,64E-06 -6,35E-06 -3,08E-06 2,41E-05 11868,4 -1,04E-06 2,36E-06 -2,52E-06 -5,68E-06 8,56E-06 11864,54 1E-06 9,95E-07 1,04E-06 -4,41E-06 1,41E-06 11860,69 1,89E-06 6,64E-07 2,41E-06 -2,29E-06 -6,97E-06 11856,83 1,13E-06 1,27E-06 3,25E-06 -3,37E-07 -2,16E-05 11852,97 -7,27E-08 1,6E-06 5,57E-06 7,02E-07 -3,89E-05 11849,11 -6,31E-07 1,44E-06 8,12E-06 -1,7E-07 -5E-05 11845,26 -6,37E-07 1,4E-06 8,58E-06 -2,25E-06 -5,04E-05 11841,4 -9,76E-07 1,26E-06 6,23E-06 -4,46E-06 -4,32E-05 11837,54 -1,34E-06 1,52E-07 2,27E-06 -5,93E-06 -3,16E-05 11833,69 -5,01E-07 -1,36E-06 -1,11E-06 -4,81E-06 -1,7E-05 11829,83 2,13E-06 -1,57E-06 -2,13E-06 2,16E-07 3,45E-06 11825,97 6,23E-06 -2,17E-07 -6,54E-07 7,87E-06 3,38E-05 11822,11 9,68E-06 9,1E-07 6,69E-07 1,36E-05 6,04E-05 11818,26 9,62E-06 5,8E-09 -1,13E-06 1,17E-05 5,74E-05 11814,4 6,45E-06 -2,26E-06 -4,6E-06 2,94E-06 3,16E-05 11810,54 3,56E-06 -3,98E-06 -5,35E-06 -5,28E-06 1,26E-05 11806,69 2,05E-06 -4,58E-06 -3E-06 -8,41E-06 5,32E-06 11802,83 -4,72E-07 -4,24E-06 -1,14E-06 -7,53E-06 -9,71E-07 11798,97 -4,55E-06 -2,66E-06 -5,53E-07 -4,66E-06 -7,26E-06 11795,11 -7,66E-06 -1,24E-07 6,21E-07 -1,59E-06 -8,79E-06 11791,26 -8,31E-06 1,7E-06 2,26E-06 -6,42E-07 -2,81E-06 11787,4 -7,45E-06 1,74E-06 2,6E-06 -1,92E-06 5,6E-06 11783,54 -6,8E-06 6,9E-07 8,79E-07 -3,06E-06 4,31E-06 11779,69 -7,03E-06 -7,05E-07 -1,6E-06 -3,2E-06 -8,4E-06 11775,83 -6,71E-06 -1,85E-06 -2,46E-06 -3,2E-06 -1,95E-05 11771,97 -4,14E-06 -1,49E-06 -1,07E-06 -3,04E-06 -2,05E-05 11768,11 -1,4E-07 6,89E-07 3,47E-07 -1,81E-06 -1,33E-05 11764,26 3E-06 2,81E-06 3,26E-07 5,05E-07 -3,29E-06 11760,4 4,09E-06 3,36E-06 -3,66E-07 2,71E-06 3,58E-06 11756,54 3,81E-06 3,34E-06 -6,47E-07 3,86E-06 5,04E-06 11752,69 3,8E-06 3,6E-06 4,84E-07 3,45E-06 2,76E-06 11748,83 4,43E-06 3,07E-06 3,23E-06 2,03E-06 -1,35E-06 11744,97 4,75E-06 1,55E-06 6,3E-06 2,32E-06 -3,5E-06 11741,11 4,13E-06 6,35E-07 7,9E-06 5,59E-06 -1,36E-07 11737,26 2,45E-06 8,82E-07 6,64E-06 8,6E-06 7,07E-06 11733,4 4,6E-08 1,04E-06 2,83E-06 8,39E-06 1,32E-05 11729,54 -2,62E-06 -2,39E-07 -1,6E-06 5,86E-06 1,49E-05 11725,69 -5,17E-06 -2,76E-06 -5,66E-06 2,47E-06 9,51E-06 11721,83 -6,9E-06 -4,92E-06 -9,24E-06 -1,04E-06 -1,12E-06 11717,97 -6,69E-06 -5,16E-06 -1,09E-05 -3,01E-06 -8,91E-06 11714,11 -3,93E-06 -3,16E-06 -9,51E-06 -3,06E-06 -9,03E-06 11710,26 4,34E-07 -1,98E-07 -6,03E-06 -2,99E-06 -4,72E-06 11706,4 4,11E-06 1,83E-06 -2,23E-06 -3,12E-06 -1,2E-06 11702,54 5,65E-06 1,77E-06 1,24E-06 -2,98E-06 5,59E-08 11698,69 5,98E-06 2,46E-07 4,58E-06 -3,77E-06 5,29E-07 11694,83 6,32E-06 -7,64E-07 7,4E-06 -5,78E-06 2,42E-06 11690,97 6,18E-06 -3,55E-07 8,98E-06 -7,66E-06 6,72E-06 11687,11 4,69E-06 4,15E-07 9,03E-06 -7,74E-06 1,1E-05 11683 26 2 21E-06 1E-06 7 52E-06 -4 67E-06 1 39E-05 , , , , , , 11382,4 -1,78E-06 1,48E-06 -7,5E-07 -1,39E-06 -6,75E-06 11378,54 -2,2E-07 1,48E-06 2,56E-07 -1,14E-06 -7,87E-06 11374,69 1,37E-06 1,2E-06 1,51E-06 -5,35E-07 -7,82E-06 11370,83 2,35E-06 8,1E-08 2,43E-06 2,77E-07 -5,29E-06 11366,97 2,85E-06 -8,2E-07 3,2E-06 2,49E-06 4,6E-07 11363,12 2,91E-06 -8,24E-07 3,4E-06 4,99E-06 7,01E-06 11359,26 2,6E-06 -9,45E-07 2,66E-06 5,18E-06 1,02E-05 11355,4 2,21E-06 -2,29E-06 1,43E-06 3,26E-06 7,83E-06 11351,54 1,14E-06 -3,86E-06 -5,78E-07 1,41E-06 2,49E-06 11347,69 -1,1E-06 -3,84E-06 -3,7E-06 3,02E-07 -6,54E-07 11343,83 -2,91E-06 -1,93E-06 -6,06E-06 -5,22E-07 4,49E-08 11339,97 -2,69E-06 8,6E-07 -5,7E-06 -6,25E-07 1,28E-06 11336,12 -1,03E-06 3,37E-06 -3,08E-06 3,23E-07 1,05E-06 11332,26 4,87E-07 4,49E-06 -2,53E-07 8,42E-07 9,15E-08 11328,4 9,16E-07 3,76E-06 1E-06 -7,84E-07 -1,72E-06 11324,54 8,93E-07 1,99E-06 1,3E-06 -3,9E-06 -4,09E-06 11320,69 1,74E-06 7,13E-07 2,46E-06 -6,47E-06 -5,53E-06 11316,83 3,27E-06 7,03E-07 3,97E-06 -7,37E-06 -4,99E-06 11312,97 3,82E-06 1,09E-06 4,05E-06 -6,37E-06 -2,53E-06 11309,12 2,51E-06 8,56E-07 2,68E-06 -3,81E-06 6,84E-08 11305,26 6,46E-07 5,1E-09 1,2E-06 -1,59E-06 1,43E-06 11301,4 -7,48E-08 -1,37E-06 3,06E-07 -1,79E-06 1,65E-06 11297,54 1,12E-07 -2,94E-06 -4,32E-07 -3,4E-06 8,21E-07 11293,69 3,23E-08 -3,87E-06 -1,3E-06 -3,25E-06 -2E-07 11289,83 -2,5E-07 -3,75E-06 -1,56E-06 -8,01E-07 1,68E-07 11285,97 1,12E-07 -2,91E-06 -2,9E-07 1,47E-06 2,01E-06 11282,12 9,86E-07 -1,78E-06 1,9E-06 2,22E-06 3,42E-06 11278,26 1,22E-06 -5,37E-07 3,09E-06 2,66E-06 3,36E-06 11274,4 4,17E-07 3E-07 2,65E-06 3,43E-06 3,07E-06 11270,54 -5,28E-07 3,78E-07 1,57E-06 3,28E-06 2,81E-06 11266,69 -8,57E-07 2,74E-07 3,78E-07 1,81E-06 1,92E-06 11262,83 -7,25E-07 8,58E-07 -8,41E-07 5,09E-07 9,22E-07 11258,97 -7,78E-07 2,13E-06 -2,12E-06 3,67E-07 7,82E-07 11255,12 -1,6E-06 3,05E-06 -3,68E-06 1,08E-06 2,19E-06 11251,26 -3,1E-06 2,97E-06 -5,32E-06 2,21E-06 4,57E-06 11247,4 -4,37E-06 2,29E-06 -6,17E-06 3,01E-06 5,81E-06 11243,54 -4,38E-06 1,07E-06 -5,23E-06 2,68E-06 4,7E-06 11239,69 -3,01E-06 -8,1E-07 -2,84E-06 1,45E-06 2,12E-06 11235,83 -1,22E-06 -2,38E-06 -4,52E-07 3,51E-07 6,91E-08 11231,97 3,19E-07 -3E-06 1,34E-06 -3,03E-07 -9,44E-07 11228,12 1,94E-06 -3,58E-06 3,04E-06 -1,55E-06 -2,29E-06 11224,26 3,47E-06 -4,55E-06 4,69E-06 -4,13E-06 -4,43E-06 11220,4 3,87E-06 -4,94E-06 5,41E-06 -6,37E-06 -6,58E-06 11216,54 2,98E-06 -3,96E-06 4,68E-06 -6,29E-06 -7,38E-06 11212,69 1,84E-06 -1,98E-06 3,14E-06 -4,7E-06 -5,96E-06 11208,83 1,2E-06 1,34E-08 1,7E-06 -3E-06 -3,79E-06 11204,97 6,7E-07 1,39E-06 7,06E-07 -1,09E-06 -2,89E-06 11201,12 -5,58E-07 2,37E-06 -1,98E-07 1,12E-06 -2,74E-06 11197,26 -2,42E-06 3,24E-06 -1,39E-06 3,42E-06 -1,37E-06 11193,4 -3,65E-06 3,79E-06 -2,31E-06 5,5E-06 1,75E-06 11189,54 -3,71E-06 3,93E-06 -2,48E-06 6,5E-06 5,48E-06 11185,69 -3,36E-06 3,73E-06 -2,15E-06 6,27E-06 7,45E-06 11181,83 -2,59E-06 3,18E-06 -1,27E-06 5,8E-06 6,19E-06 11177,97 -1,11E-06 2,69E-06 -4,1E-07 5,54E-06 3,52E-06 11174,12 3,77E-07 2,52E-06 -1,92E-07 4,43E-06 1,39E-06 11170,26 1,27E-06 2,02E-06 -1,1E-07 1,91E-06 -1,38E-06 11166,4 1,61E-06 9,27E-07 6,8E-09 -6,16E-07 -4,84E-06 11162,54 1,71E-06 2,68E-07 1,72E-08 -1,74E-06 -6,09E-06 11158,69 1,89E-06 7,29E-07 1,21E-07 -1,71E-06 -4,26E-06 11154,83 1,91E-06 1,54E-06 -8,06E-08 -1,55E-06 -1,28E-06 11150,97 1,38E-06 1,91E-06 -8,32E-07 -1,47E-06 1,35E-06 11147,12 5,42E-07 1,83E-06 -1,18E-06 -8,82E-07 3,04E-06 11143,26 4,53E-08 1,26E-06 -5,33E-07 -6,16E-07 3,27E-06 11139,4 -1,06E-07 -1,44E-07 1,04E-07 -1,97E-06 2,54E-06 11135,54 -3,02E-07 -2,15E-06 -9,26E-08 -3,91E-06 2,47E-06 11131,69 -5,26E-07 -4,16E-06 -6,26E-07 -5,14E-06 2,91E-06 11127,83 -8,12E-07 -5,67E-06 -9,87E-07 -5,59E-06 2,01E-06 11123,97 -1,07E-06 -5,99E-06 -9,32E-07 -4,77E-06 -5,5E-07 11120,12 -8,48E-07 -5E-06 -3,8E-07 -2,78E-06 -3,55E-06 11116,26 -4,42E-07 -3,67E-06 5,93E-08 -1,08E-06 -5,78E-06 11112,4 -5,25E-07 -2,73E-06 1,25E-07 -1,4E-07 -6,57E-06 11108,54 -8,82E-07 -1,73E-06 3,38E-07 1,02E-06 -6,36E-06 11104,69 -7,89E-07 -1,09E-07 8,34E-07 2,7E-06 -5,51E-06 11100,83 1,98E-07 1,95E-06 1,56E-06 4,09E-06 -3,27E-06 11096,97 1,79E-06 3,46E-06 2,49E-06 4,35E-06 -2,51E-07 11093,12 2,85E-06 3,73E-06 2,99E-06 3,65E-06 2,06E-06 11089,26 2,75E-06 3,36E-06 2,87E-06 3,13E-06 3,89E-06 11085,4 2,36E-06 3,12E-06 2,69E-06 2,96E-06 5,55E-06 11081,54 2,22E-06 2,63E-06 2,18E-06 1,91E-06 5,3E-06 11077,69 1,4E-06 1,3E-06 5,32E-07 -4,23E-07 2,2E-06 11073,83 -4,44E-07 -4,48E-07 -1,61E-06 -2,86E-06 -1,44E-06 11069,97 -1,92E-06 -1,73E-06 -2,7E-06 -4,26E-06 -3,6E-06 11066,12 -2,03E-06 -1,96E-06 -2,35E-06 -4,28E-06 -4,1E-06 11062,26 -1,35E-06 -1E-06 -1,45E-06 -3,07E-06 -2,58E-06 11058,4 -7,96E-07 3,84E-07 -7,88E-07 -1,24E-06 3,19E-08 11054,54 -5,68E-07 1,08E-06 -6,75E-07 5,17E-07 2,1E-06 11050 69 -7 57E-07 1 07E-06 -1 09E-06 1 83E-06 2 97E-06 11162,54 1,71E 06 2,68E 07 1,72E 08 1,74E 06 6 11158,69 1,89E-06 7,29E-07 1,21E-07 -1,71E-06 -4 11154,83 1,91E-06 1,54E-06 -8,06E-08 -1,55E-06 -1 11150,97 1,38E-06 1,91E-06 -8,32E-07 -1,47E-06 1 11147,12 5,42E-07 1,83E-06 -1,18E-06 -8,82E-07 3 11143,26 4,53E-08 1,26E-06 -5,33E-07 -6,16E-07 3 11139,4 -1,06E-07 -1,44E-07 1,04E-07 -1,97E-06 2 11135,54 -3,02E-07 -2,15E-06 -9,26E-08 -3,91E-06 2 11131,69 -5,26E-07 -4,16E-06 -6,26E-07 -5,14E-06 2 11127,83 -8,12E-07 -5,67E-06 -9,87E-07 -5,59E-06 2 11123,97 -1,07E-06 -5,99E-06 -9,32E-07 -4,77E-06 - 11120,12 -8,48E-07 -5E-06 -3,8E-07 -2,78E-06 -3 11116,26 -4,42E-07 -3,67E-06 5,93E-08 -1,08E-06 -5 11112,4 -5,25E-07 -2,73E-06 1,25E-07 -1,4E-07 -6 11108,54 -8,82E-07 -1,73E-06 3,38E-07 1,02E-06 -6 11104,69 -7,89E-07 -1,09E-07 8,34E-07 2,7E-06 -5 11100,83 1,98E-07 1,95E-06 1,56E-06 4,09E-06 -3 11096,97 1,79E-06 3,46E-06 2,49E-06 4,35E-06 -2 11093,12 2,85E-06 3,73E-06 2,99E-06 3,65E-06 2 11089,26 2,75E-06 3,36E-06 2,87E-06 3,13E-06 3 11085,4 2,36E-06 3,12E-06 2,69E-06 2,96E-06 5 11081,54 2,22E-06 2,63E-06 2,18E-06 1,91E-06 11077,69 1,4E-06 1,3E-06 5,32E-07 -4,23E-07 11073,83 -4,44E-07 -4,48E-07 -1,61E-06 -2,86E-06 -1 11069,97 -1,92E-06 -1,73E-06 -2,7E-06 -4,26E-06 - 11066,12 -2,03E-06 -1,96E-06 -2,35E-06 -4,28E-06 - 11062,26 -1,35E-06 -1E-06 -1,45E-06 -3,07E-06 -2 11058,4 -7,96E-07 3,84E-07 -7,88E-07 -1,24E-06 3 11054,54 -5,68E-07 1,08E-06 -6,75E-07 5,17E-07 11050,69 -7,57E-07 1,07E-06 -1,09E-06 1,83E-06 2 11046,83 -1,23E-06 1,05E-06 -1,68E-06 2,43E-06 2 11042,97 -1,22E-06 8,26E-07 -1,87E-06 2,21E-06 1 11039,12 -4,57E-07 8,96E-08 -1,2E-06 1,75E-06 1 11035,26 3,08E-07 -6,7E-07 -8,2E-09 1,39E-06 2 11031,4 4,35E-07 -1,14E-06 7,6E-07 6,79E-07 3 11027,54 2,7E-07 -1,2E-06 6,69E-07 -6,2E-08 4 11023,69 4,45E-07 -8,16E-07 2,52E-07 -5,26E-07 1 11019,83 5,64E-07 -4,67E-07 -1,9E-07 -1,66E-06 -2 11015,97 1,34E-07 -3,25E-07 -5,76E-07 -3,21E-06 -7 11012,12 1,24E-07 -1,88E-07 -1,34E-07 -3,5E-06 - 11008,26 1,39E-06 6,71E-08 1,45E-06 -1,93E-06 -6 11004,4 3,03E-06 5,88E-07 3,18E-06 5,62E-07 -3 11000,54 3,93E-06 1,13E-06 4,4E-06 2,39E-06 1 10996,69 4,01E-06 1,17E-06 5,08E-06 2,98E-06 4 10992,83 3,32E-06 8,62E-07 4,62E-06 2,92E-06 7 10988,97 1,69E-06 7,72E-07 2,79E-06 2,08E-06 6 10985,12 -4,76E-07 7,94E-07 5,63E-07 3,24E-07 10981,26 -2,2E-06 4,13E-07 -9,28E-07 -8,47E-07 7 10977,4 -3,05E-06 -7,37E-08 -1,34E-06 -2,23E-07 1 10973,54 -3,42E-06 -2,23E-07 -1,53E-06 8,23E-07 3 10969,69 -3,7E-06 -3,11E-07 -2,55E-06 5,46E-07 2 10965,83 -3,81E-06 -3,39E-07 -3,96E-06 -3,41E-07 9 10961,97 -3,6E-06 -2,67E-07 -4,52E-06 -7,02E-07 -1 10958,12 -3,03E-06 -5,5E-07 -4,23E-06 -9E-07 -5 10954,26 -1,72E-06 -1,12E-06 -3,39E-06 -1,13E-06 -6 10950,4 4,65E-07 -1,8E-06 -1,66E-06 -1,19E-06 -5 10946,54 2,74E-06 -2,6E-06 5,55E-07 -1,35E-06 -3 10942,69 4,05E-06 -2,87E-06 2,45E-06 -1,51E-06 -1 10938,83 3,89E-06 -2,24E-06 3,41E-06 -1,35E-06 1 10934,97 2,39E-06 -1,26E-06 2,6E-06 -1,32E-06 10931,12 2,11E-07 -3,83E-07 1,2E-07 -2E-06 5 10927,26 -1,65E-06 2,16E-07 -2,39E-06 -3,19E-06 -3 10923,4 -2,53E-06 3,95E-07 -3,36E-06 -3,84E-06 -5 10919,54 -2,43E-06 3,54E-07 -2,71E-06 -3,03E-06 -4 10915,69 -1,87E-06 4,68E-07 -1,44E-06 -1,54E-06 8 10911,83 -1,58E-06 8,24E-07 -5,91E-07 -2,6E-07 4 10907,97 -1,68E-06 1,2E-06 -3,93E-07 1,33E-06 8 10904,12 -1,44E-06 1,18E-06 -2,99E-07 2,95E-06 8 10900,26 -3,99E-07 4,91E-07 -1,04E-08 3,73E-06 6 10896,4 1,1E-06 -3,22E-07 3,73E-07 3,9E-06 2 10892,54 2,46E-06 -5,44E-07 9,64E-07 3,83E-06 5 10888,69 2,88E-06 -4,03E-07 1,54E-06 3,59E-06 -9 10884,83 1,84E-06 -3,02E-07 1,61E-06 3,36E-06 -1 10880,97 -2E-07 -2,98E-08 1,16E-06 3,24E-06 -1 10877,12 -2,24E-06 3,58E-07 1,82E-07 2,87E-06 -8 10873,26 -3,39E-06 4,02E-07 -1,04E-06 1,56E-06 -7 10869,4 -3,14E-06 1,22E-07 -1,47E-06 -3,17E-07 -8 10865,55 -1,84E-06 -1,29E-07 -5,2E-07 -1,94E-06 -1 10861,69 -4,59E-07 -2,74E-07 1,23E-06 -3,53E-06 -1 10857,83 5,57E-07 -2,66E-07 2,63E-06 -5,08E-06 -2 10853,97 1,39E-06 1,21E-07 2,93E-06 -5,52E-06 -1 10850,12 2,11E-06 8,83E-07 2,43E-06 -3,95E-06 1 10846,26 2,73E-06 1,71E-06 1,93E-06 -1,24E-06 5 10842,4 3,25E-06 2,35E-06 1,57E-06 8,27E-07 -9 10838,55 3,27E-06 2,79E-06 1,23E-06 2,23E-06 -8 10834,69 2,51E-06 2,95E-06 9,75E-07 3,5E-06 2 10830,83 9,95E-07 2,44E-06 3,81E-07 4,12E-06 5 10826,97 -9,53E-07 1,17E-06 -8,33E-07 3,87E-06 5
- 31. but… Data is not the same as information Too much data - too little information (Harald Martens)
- 32. 32 Chemometrics the chemical discipline that uses mathematical and statistical methods to design or select optimal procedures and experiments, and to provide maximum chemical information by analyzing chemical data definition of the Chemometrics Society
- 33. 33 Multivariate data analysis • Exploratory data analysis (data mining) – attempts to find the hidden structure in large complex data sets – Cluster analysis – Principal Component Analysis • Regression analysis and Predictive Models (developing the models from available data and predict desired response) – Partial Least Squares Regression – Multiplicative Linear Regression • Classification Models (separation of group of object into one or more classes based on distinguished characteristic) – Cluster Analysis Test – Identity Test – SIMCA
- 34. 34 Cluster analysis: CA analyze spectra for their similarity, divide most similar spectra into groups, which are called clusters or classes The spectral distance – heterogeneity explains the similarity between the spectra The spectral distance 0 means that the spectra are identical heterogeneity0 Sample1 Sample2 Sample3 Sample4
- 35. 35 Coniphora putana Postia placenta Trametes versicolorGleophyllum trabeum reference casestudysample CA example
- 36. 36 Principal Component Analysis It is used for de-correlation of highly correlated data to reduce multidimensional data set to lower dimensions it can separate set of input data into groups of peculiar similarities x y PC1 PC2
- 37. 37 PCA example PCA of NIR spectra of non coated samples exposed to South (4 years of natural weathering); Reggio Emilia Roma Loninghens Macerata Udine Trento Lecce standard a
- 38. 38 Identity test Compare the unknown spectrum with all reference spectra The result of comparison between two spectra is the spectral distance called hit quality The better spectra match the smaller is spectral distance; HQ for identical spectra is 0 Model sample1 HQ1 > treshold1 Model sample3 HQ3 > treshold3 Model samplen HQn > tresholdn Model sample2 HQ2 < treshold2 ??? sample
- 39. 39 Ita Pol S” Est Fin Pol S’ Pol N 0 0,1 0,2 0,3 0,4 0,5 0,6 0,7 0,8 Finlandia Finlandia Finlandia Finlandia Finlandia Finlandia Estonia Estonia Estonia Estonia Estonia Estonia PolskaN PolskaN PolskaN PolskaN PolskaN PolskaN PolskaS' PolskaS' PolskaS' PolskaS'' PolskaS'' PolskaS'' Włochy Włochy Włochy Włochy Włochy Włochy dystansspektralny(HQ),próg(T)threshold(T),spectraldistance(HQ) Finland Finland Finland Finland Finland Finland Estonia Estonia Estonia Estonia Estonia Estonia PolandS’ PolandS’ PolandS’ Italy Italy Italy Italy Italy Italy PolandS” PolandS” PolandS” PolandN PolandN PolandN PolandN PolandN PolandN 0 0,1 0,2 0,3 0,4 0,5 0,6 0,7 0,8 Finlandia Finlandia Finlandia Finlandia Finlandia Finlandia Estonia Estonia Estonia Estonia Estonia Estonia PolskaN PolskaN PolskaN PolskaN PolskaN PolskaN PolskaS' PolskaS' PolskaS' PolskaS'' PolskaS'' PolskaS'' Włochy Włochy Włochy Włochy Włochy Włochy dystansspektralny(HQ),próg(T) próg (T) threshold(T),spectraldistance(HQ) Finland Finland Finland Finland Finland Finland Estonia Estonia Estonia Estonia Estonia Estonia PolandS’ PolandS’ PolandS’ Italy Italy Italy Italy Italy Italy PolandS” PolandS” PolandS” PolandN PolandN PolandN PolandN PolandN PolandN threshold (T) 0 0,1 0,2 0,3 0,4 0,5 0,6 0,7 0,8 Finlandia Finlandia Finlandia Finlandia Finlandia Finlandia Estonia Estonia Estonia Estonia Estonia Estonia PolskaN PolskaN PolskaN PolskaN PolskaN PolskaN PolskaS' PolskaS' PolskaS' PolskaS'' PolskaS'' PolskaS'' Włochy Włochy Włochy Włochy Włochy Włochy dystansspektralny(HQ),próg(T) próg (T) dystans spektralny (HQ) threshold (T) spectral distance (HQ)threshold(T),spectraldistance(HQ) Finland Finland Finland Finland Finland Finland Estonia Estonia Estonia Estonia Estonia Estonia PolandS’ PolandS’ PolandS’ Italy Italy Italy Italy Italy Italy PolandS” PolandS” PolandS” PolandN PolandN PolandN PolandN PolandN PolandN Identity test (IT)
- 41. 41 How it works? + calibration (PLS) 0,3 0,4 0,5 0,6 0,7 0,3 0,4 0,5 0,6 0,7 gęstość referencja (g/cm3 ) gęstośćestymacja(g/cm 3 ) r2 = 64,94 RMSECV = 0,039 RPD = 1,69 density 45 45,5 46 45 45,5 46 celuloza referencja (%) celulozaestymacja(%) r2 = 84,98 RMSECV = 0,0638 RPD = 2,58 cellulose 26 27 28 29 30 26 27 28 29 30 lignina referencja (%) ligninaestymacja(%) r2 = 98,67 RMSECV = 0,102 RPD = 8,86 lignin R 2 = 0.984 0 10 20 30 40 50 60 0 10 20 30 40 50 60 reference stress (MPa) predictedstress(MPa) Tensile strength spectra reference data
- 42. 42 • Spectroscopy is the study of the interaction between matter and electromagnetic radiation • Spectroscopic data is often represented by a spectrum, a plot of the response of interest as a function of wavelength or frequency • Absorption bands in the NIR are the result of combination and overtone bands from the fundamental vibrations seen in the mid-IR • The overtone and combination bands are 10 – 100 X less intense than the fundamental bands in mid-IR, but are better fitting for interpretation of wood • Differences in NIR spectra are often very subtle, often overlapping bands are present; difficult to interpret requiring training of analysts to recognize these differences Summarizing…
- 43. 43 + to be continued on NIR&wood 2° 2. experimental design 1.problem definition 9. sample presentation 10. measurement 12. storage of results 16. calibration: qualitative analysis 17. validation of qualitative model 21. implementation of chemometric models for identification 3. sample selection 4. sample preparation 5. sample conditioning 6. istrument selection 7. instrument set-up 8. optimization of the set-up 13. exploratory analysis 15. optimal data set of spectra 14. spectra pre-processing 18. calibration: quantitative analysis 19. validation of quantitative model 22. implementation of chemometric models for prediction 20. interpretation of spectra 23. generalization of knowledge 11. reference characterizations
- 44. 44