1437 - Water Management of Yield Record Holding SRI Farmer in Indonesia; A Case Study and Its Implications
•
0 j'aime•1,313 vues

Poster presentation at the 4th International Rice Congress (2014) Authors: Kazunobu Toriyama and Shigeki Yokoyama Title: Water management of yield record holding SRI farmer in Indonesia; a case study and its implications Venue: BITEC, Bangkok, Thailand Dates: October 27-41, 2014
Recommandé

Recommandé
Contenu connexe
Tendances
Tendances (20)
En vedette
En vedette (20)
Similaire à 1437 - Water Management of Yield Record Holding SRI Farmer in Indonesia; A Case Study and Its Implications
Similaire à 1437 - Water Management of Yield Record Holding SRI Farmer in Indonesia; A Case Study and Its Implications (20)
Plus de SRI-Rice, Dept. of Global Development, CALS, Cornell University
Plus de SRI-Rice, Dept. of Global Development, CALS, Cornell University (20)
Dernier
Dernier (20)
1437 - Water Management of Yield Record Holding SRI Farmer in Indonesia; A Case Study and Its Implications
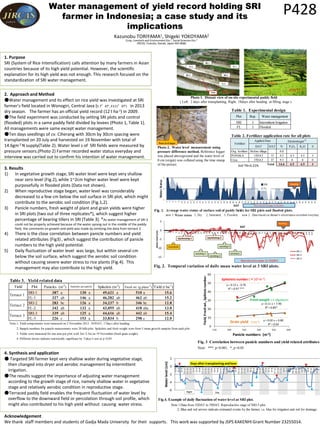
- 1. Water management of yield record holding SRI farmer in Indonesia; a case study and its implications Kazunobu TORIYAMA1, Shigeki YOKOYAMA2 Crop, Livestock and Environment Div.1, Social Sciences Div.2 JIRCAS, Tsukuba, Ibaraki, Japan 943-8686 P428 1. Purpose SRI (System of Rice Intensification) calls attention by many farmers in Asian countries because of its high yield potential. However, the scientific explanation for its high yield was not enough. This research focused on the standardization of SRI water management. 2. Approach and Method ●Water management and its effect on rice yield was investigated at SRI farmer’s field located in Wonogiri, Central Java (S 7°47′, E111°07′) in 2013 dry season. The farmer has an official yield record (12 t ha-1) in 2009. ●The field experiment was conducted by setting SRI plots and control (flooded) plots in a same paddy field divided by levees (Photo 1, Table 1). All managements were same except water management. ●Ten days seedlings of cv. Ciherang with 30cm by 30cm spacing were transplanted on 20 July and harvested on 19 November with total of 14.6gm-2 N supply(Table 2). Water level s of SRI fields were measured by pressure sensors.(Photo 2) Farmer recorded water status everyday and interview was carried out to confirm his intention of water management. 3. Results 1)In vegetative growth stage, SRI water level were kept very shallow near zero level (Fig.2), while 1~2cm higher water level were kept purposefully in flooded plots (Data not shown). 2)When reproductive stage began, water level was considerably decreased to a few cm below the soil surface in SRI plot, which might contribute to the aerobic soil condition (Fig.1,2). 3)Panicle numbers, fresh weight of plant and grain yields were higher in SRI plots (two out of three replicates*), which suggest higher percentage of bearing tillers in SRI (Table 3). *As water management of SRI-2 could not be properly achieved because of the water sprang out in the middle of the paddy field, the comments on growth and yield was made by omitting the data from terrace 2. 4)There is the close correlation between panicle numbers and yield related attributes (Fig3) , which suggest the contribution of panicle numbers to the high yield potential. 5)Daily fluctuation of water level was large, but within several cm below the soil surface, which suggest the aerobic soil condition without causing severe water stress to rice plants (Fig.4). This management may also contribute to the high yield. 4. Synthesis and application ● Targeted SRI farmer kept very shallow water during vegetative stage, then changed into dryer and aerobic management by intermittent irrigation. ●The results suggest the importance of adjusting water management according to the growth stage of rice, namely shallow water in vegetative stage and relatively aerobic condition in reproductive stage. ●Terraced paddy field enables the frequent fluctuation of water level by overflow to the downward field or percolation through soil profile, which might also contributed to his high yield without causing water stress. Photo 1. Distant view of on-site experimental paddy field ( Left: 2 days after transplanting, Right: 18days after heading :at filling stage ) Photo 2. Water level measurement using pressure difference method. Reference logger was placed aboveground and the water level of 0 cm (origin) was collated using the time stamp of the picture. Water level logger rrace-1 Table 1. Experimental design SRI3Intermittent IrrigationFL3Flooded PlotRep.Water management Acknowledgement We thank staff members and students of Gadja Mada University for their supports. This work was supported by JSPS KAKENHI Grant Number 23255014. Fig. 2. Temporal variation of daily mean water level at 3 SRI plots. -15-10-505 13579111315171921232527293133353739414345474951535557596163656769717375777981838587899193959799101103105107Water level (cm) DATSRI-1SRI-2SRI-3top dressing-1top dressing-2weeding-1weeding-2weeding-4Insecticideweeding-3Reproductive stage(0-35DBH) HeadingTable 2. Fertilizer application rate for all plotsDATDATNP2O5K2OSOrg. fertilizerBefore tillage0.8PONSKA15DAT154.54.54.53Urea37DAT379.300014.64.54.53 TotalFertilizerElements(gm-2)Applied DateNote 1:Data from 52DAT to 59DAT: Reproductive stage of SRI-3 plot. 2; Blue and red arrows indicate estimated events by the farmer, i.e. blue for irrigation and red for drainage. Fig.4. Example of daily fluctuation of water level at SRI plot. -6-4-202 52-052-452-852-1252-1652-2053-053-453-853-1253-1653-2054-054-454-854-1254-1654-2055-055-455-855-1255-1655-2056-056-456-856-1256-1656-2057-057-457-857-1257-1657-2058-058-458-858-1258-1658-2059-059-459-859-1259-1659-20Water level (cm) Days after transplanting and hourDayNightSRISRISRI 常時湛水常時湛水 常時湛水 FL-1 SRI-3 SRI-2 SRI-1 FL-2 FL-3 Levee Terrace1 Terrace 3 Terrace2 Terrace1 Terrace 2 Terrace 3 2013.11.2 2013.7.22 Soil TN=0.21% Table 3. Yield related dataFieldPlotYield (t ha-1) SRI-1387a130a49,621a510a15.6FL-1327ab146a46,282ab462ab15.2SRI-2283bc126a34,237b346bc12.8FL-2342ab132a43,055ab418abc13.0SRI-3339ab125a44,616ab442ab15.4FL-3226c153a33,834b298c12.0Note 1: Yield compornents were measured on 2 November 2013. 103DAT, 17days after heading. 2; Sample numbers for panicle measurments were 20 hills/plot. Spikelets and fresh weight were from 5 mean growth samples from each plot. 3: Yields were measured for one area per plot with 2m×2.5m on 19 November (fresh grain weight). 4: Different letters indicate statistically significace by Tukey's test at p<0.05. Fresh wt. (g plant-1) Terrace 1Terrace 2Terrace 3Panicles (m-2)Spikelets per panicleSpikelets (m-2) Fig. 3 Correlation between panicle numbers and yield related attributesNote: ***; p<0.001, *; p<0.05y = 0.11 x + 7.90 R² = 0.85* y = 0.13 x -0.76 R² = 0.97 *** y = 0.02 x + 6.80 R² = 0.64 0 10 20 30 40 50 60 150 200 250 300 350 400 Yield, Fresh wt., Spiklets number Panicle numbers (m-2) Fresh weight(×10g/plant) Grainyield(tha-1) Spikelets number(×103 m-2)