Contenu connexe
Plus de Santosh Sridharan (12)
Book1
- 1. Mar-92 Mar-93 Mar-94 Mar-95 Mar-96 Mar-97 Mar-98
Unit ExpressionOriental Bank Of Commerce Commerce Commerce Commerce Commerce Commerce Comme
Oriental Bank Of Bank Of Bank Of Bank Of Bank Of Bank Of
Oriental Oriental Oriental Oriental Oriental
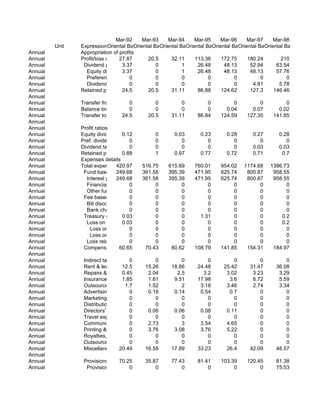
Annual Appropriation of profits
Annual Profit/loss after tax
27.87 20.5 32.11 113.36 172.75 180.24 210
Annual Dividend paid 3.37 0 1 26.48 48.13 52.94 63.54
Annual Equity dividend3.37 0 1 26.48 48.13 48.13 57.76
Annual Preference dividend 0 0 0 0 0 0 0
Annual Dividend tax 0 0 0 0 0 4.81 5.78
Annual Retained profits 24.5 20.5 31.11 86.88 124.62 127.3 146.46
Annual
Annual Transfer from reserves
0 0 0 0 0 0 0
Annual Balance brought forward
0 0 0 0 0.04 0.07 0.02
Annual Transfer to reserves
24.5 20.5 31.11 86.84 124.59 127.35 141.85
Annual
Annual Profit ratios
Annual Equity dividend / 0.12 after tax 0
Profit 0.03 0.23 0.28 0.27 0.28
Annual Pref. dividend / Profit after tax 0
0 0 0 0 0 0
Annual Dividend tax / Profit 0after tax 0 0 0 0 0.03 0.03
Annual Retained profit / Profit after tax 1
0.88 0.97 0.77 0.72 0.71 0.7
Annual Expenses details
Annual Total expenses420.97 516.75 615.69 760.01 954.02 1174.68 1386.73
Annual Fund based financial services expenses
249.68 361.58 395.39 471.95 625.74 800.87 958.55
Annual Interest paid249.68 361.58 395.39 471.95 625.74 800.87 958.55
Annual Financial charges on instruments
0 0 0 0 0 0 0
Annual Other fund based financial services expenses
0 0 0 0 0 0 0
Annual Fee based financial0 services expenses 0
0 0 0 0 0
Annual Bill discounting charges
0 0 0 0 0 0 0
Annual Bank charges, guarantee fees, etc.
0 0 0 0 0 0 0
Annual Treasury operations expenses 0
0.03 0 1.31 0 0 0.2
Annual Loss on sale of0.03
investments 0 0 0 0 0 0.2
Annual Loss on sale of long term investment 0
0 0 0 0 0 0
Annual Loss on sale of current investment
0 0 0 0 0 0 0
Annual Loss relating to forex transactions
0 0 0 0 0 0 0
Annual Compensation 60.65
to employees 70.43 80.62 108.79 141.85 154.31 184.97
Annual
Annual Indirect taxes 0 0 0 0 0 0 0
Annual Rent & lease rent12.5 15.26 18.86 24.48 25.42 31.47 36.08
Annual Repairs & maintenance
0.45 2.04 2.5 3.2 3.02 3.23 3.29
Annual Insurance premium paid
1.85 1.81 9.51 17.98 3.6 6.72 5.59
Annual Outsourced professional jobs
1.7 1.52 2 3.18 3.46 2.74 3.34
Annual Advertising expenses 0 0.18 0.14 0.54 0.7 0 0
Annual Marketing expenses 0 0 0 0 0 0 0
Annual Distribution expenses0 0 0 0 0 0 0
Annual Directors' fees 0 0.06 0.06 0.08 0.11 0 0
Annual Travel expenses 0 0 0 0 0 0 0
Annual Communications expenses 2.73
0 3 3.54 4.65 0 0
Annual Printing & stationery expenses
0 3.76 3.08 3.76 5.22 0 0
Annual Royalties, technical 0
know-how 0fees, etc. 0 0 0 0 0
Annual Outsourced jobs 0 0 0 0 0 0 0
Annual Miscellaneous expenditure16.58
20.49 17.89 33.23 26.4 42.09 48.57
Annual
Annual Provisions & contingencies
70.25 35.87 77.43 81.41 103.39 120.45 81.38
Annual Provision for NPAs0 0 0 0 0 0 75.53
- 2. Annual Provisions for dimunition in investments 0
0 0 0 0 0 4.1
Annual Provisions for 70.25
unspecified contingencies
35.87 77.43 81.41 103.39 120.45 1.75
Annual Depreciation (net of transfer4.93 reval.5.21
3.27 from reserves) 6.56 10.45 12.31 17.25
Annual Amortisation 0 0 0 0 0 0 0
Annual Write-offs 0 0 0 0 0 0 0
Annual Less: Expenses capitalised
0 0 0 0 0 0 0
Annual Less: DRE & expenses charged to others 0
0 0 0 0 0 0
Annual
Annual Prior period and extra-ordinary 0
0 expenses 0 0 0.01 0 0.03
Annual Prior period expenses
0 0 0 0 0 0 0
Annual Cash prior period0expenses 0 0 0 0 0 0
Annual Prior period taxes
0 0 0 0 0 0 0
Annual Residual and combined cash prior period expenses
0 0 0 0 0 0 0
Annual Non cash prior period expenses
0 0 0 0 0 0 0
Annual Prior period depreciation 0
0 0 0 0 0 0
Annual Residual and combined non cash prior0period expenses
0 0 0 0 0 0
Annual Extra-ordinary expenses
0 0 0 0 0.01 0 0.03
Annual Loss on impairment of assets
0 0 0 0 0 0 0
Annual Loss on sale of assets
0 0 0 0 0.01 0 0.03
Annual Tax on extra-ordinary income
0 0 0 0 0 0 0
Annual Loss on change in0 accounting0policies 0 0 0 0 0
Annual
Annual Provision for direct tax
0 0 0 0 0 0 46
Annual Corporate tax 0 0 0 0 0 0 46
Annual Deferred tax 0 0 0 0 0 0 0
Annual Less: Deferred tax0 assets / credit
0 0 0 0 0 0
Annual Other direct taxes 0 0 0 0 0 0 0
Annual Fringe benefit tax0 0 0 0 0 0 0
Annual Income details
Annual Total Income 448.84 537.25 647.8 873.37 1126.77 1354.92 1596.73
Annual Income from financial services
447.12 536.38 646.78 868.9 1121.73 1348.42 1582.61
Annual Fund based financial services income
421.23 495.8 592.66 786.12 1026.21 1251.32 1463.27
Annual Interest income
295.33 495.8 592.66 785.96 1025.95 756.99 789.51
Annual Dividends 125.9 0 0 0.16 0.26 494.33 673.76
Annual Income from leasing, etc. 0
0 0 0 0 0 0
Annual Fee based financial services income37.42
16.15 25.96 46.93 65.41 66.34 72.01
Annual Income from treasury operations
9.74 14.62 16.7 35.85 30.11 30.76 47.33
Annual Profit on sale of investments
0.03 0.69 0.24 13.9 1.5 2.23 14.77
Annual Profit on long term investment
0 0 0 0 0 0 0
Annual Profit on current0investment 0 0 0 0 0 0
Annual Income from other treasury operations
0 0.66 0.66 0 0 0 0
Annual Gain relating to forex transactions 15.8
9.71 13.27 21.95 28.61 28.53 32.56
Annual Income from non-financial services
0 0 0 0 0 0 0
Annual
Annual Other income 0.52 0.76 0.97 4.34 4.96 6.46 14
Annual
Annual Prior period & extra-ordinary income 0.05
1.2 0.11 0.13 0.08 0.04 0.12
Annual Prior period income
1.1 0 0 0 0 0 0
Annual Cash prior period0income 0 0 0 0 0 0
Annual Bad debts recovered
0 0 0 0 0 0 0
Annual Residual and combined cash prior period income 0
0 0 0 0 0 0
Annual Non-cash prior 1.1
period income0 0 0 0 0 0
Annual Provisions written back
1.1 0 0 0 0 0 0
- 3. Annual Residual and combined non cash prior0period income
0 0 0 0 0 0
Annual Extra-ordinary income
0.1 0.11 0.05 0.13 0.08 0.04 0.12
Annual Profit on sale of fixed assets
0.1 0.11 0.05 0.13 0.08 0.04 0.12
Annual Insurance claims0 0 0 0 0 0 0
Annual Gain on change in0 accounting0policies 0 0 0 0 0
Annual Liabilities
Annual Rs. Crore Net Worth 114 164 244.6 709.48 824.1 941.4 1082.46
Annual Rs. Crore Authorised capital 0 0 0 1500 1500 1500 1500
Annual Rs. Crore Issued equity capital 0 0 0 192.54 192.54 192.54 192.54
Annual Rs. Crore Paid up equity capital (net of forfeited capital) 192.54
48 0 0 192.54 192.54 192.54
Annual Rs. Crore Forfeited equity capital
0 0 0 0 0 0 0
Annual Rs. Crore Paid up preference 0 capital (net0 forfeited0
of capital) 0 0 0 0
Annual Rs. Crore Capital contibution, 0 suspense 78 application money 0
and 128 0 0 0
Annual
Annual Rs. Crore Reserves & surplus6
6 86 116.6 516.94 631.56 748.86 889.92
Annual Rs. Crore Free Reserves 0 0 0 365.94 401.42 463.72 540.78
Annual Rs. Crore Security premium reserves (Net of deductions)322.7
0 0 0 322.7 322.7 322.7
Annual Rs. Crore Other free reserves
0 0 0 43.24 78.72 141.02 218.08
Annual Rs. Crore Specific reserves66 86 116.6 151 230.14 285.14 349.14
Annual Rs. Crore Revaluation reserves
0 0 0 0 0 0 0
Annual Rs. Crore Less Accumulated0 losses 0 0 0 0 0 0
Annual
Annual Rs. Crore Deposits 3599.1 4276.72 5239.06 6673.46 8710.89 10054.06 13058.02
Annual Rs. Crore Demand deposits
495.13 562.25 710.41 910.2 1032.97 1217.47 1379.42
Annual Rs. Crore from banks 5.94 3.52 4.26 2.92 3.11 24.24 27.97
Annual Rs. Crore from others89.19
4 558.73 706.15 907.28 1029.86 1193.23 1351.45
Annual Rs. Crore Saving deposits
843.41 861.05 1071.72 1412.94 1643.41 1934.55 2417.55
Annual Rs. Crore Term deposits
2260.56 2853.42 3456.93 4350.32 6034.51 6902.04 9261.05
Annual Rs. Crore from banks103.14 84.16 83.03 43.31 170.22 184.6 155.85
Annual Rs. Crore from others
2157.42 2769.26 3373.9 4307.01 5864.29 6717.44 9105.2
Annual
Annual Rs. Crore Deposits from india 4276.72
3591.1 5239.06 6673.46 8710.88 10054.06 13058.02
Annual Rs. Crore Deposits from outside india 0
0 0 0 0 0 0
Annual
Annual Rs. Crore Total borrowings99.88 121.67 223.09 421.74 575.45 107.25 99.4
Annual Rs. Crore Bank borrowings2.06 1.19 0.99 1.27 3.85 3.38 1.52
Annual Rs. Crore Short term bank borrowings
2.06 1.19 0.99 1.27 3.85 0 0
Annual Rs. Crore Long term bank borrowings 0
0 0 0 0 0 0
Annual Rs. Crore Financial institutional borrowings
78.88 0 0 0 0 81.68 59.67
Annual Rs. Crore Central & state govt. (usually sales tax deferrals)
0 0 0 0 0 0 0
Annual Rs. Crore Debentures / bonds0 0 0 0 0 0 0
Annual Rs. Crore Convertible 0 0 0 0 0 0 0
Annual Rs. Crore Non-convertible 0 0 0 0 0 0 0
Annual Rs. Crore Fixed deposits 0 0 0 0 0 0 0
Annual Rs. Crore Foreign borrowings
18.94 35.4 27.03 41.82 58 22.19 38.21
Annual Rs. Crore Of which : euro convertible bonds
0 0 0 0 0 0 0
Annual Rs. Crore Borrowings from corporate bodies
0 0 0 0 0 0 0
Annual Rs. Crore Group / associate0 cos. 0 0 0 0 0 0
Annual Rs. Crore Borrowings from promoters / directors
0 0 0 0 0 0 0
Annual Rs. Crore Commercial paper 0 0 0 0 0 0 0
Annual Rs. Crore Hire purchase borrowings
0 0 0 0 0 0 0
Annual Rs. Crore Deferred credit 0 0 0 0 0 0 0
Annual Rs. Crore Other borrowings 0 85.08 195.07 378.65 513.6 0 0
- 4. Annual
Annual Rs. Crore Secured borrowings
80.94 0 0 0 0 85.06 61.19
Annual Rs. Crore Unsecured borrowings 121.67
18.94 123.09 112.74 136.46 22.19 38.21
Annual Rs. Crore Current portion of long term debt
0 0 0 0 0 0 0
Annual
Annual Rs. Crore Current liabilities & provisions
181.66 180.54 288.05 432.31 413.61 456.29 541.65
Annual Rs. Crore Sundry creditors 0 0 0 0 0 120.95 0
Annual Rs. Crore Acceptances 54.49 51.25 83.06 122.31 170.77 0 105.1
Annual Rs. Crore Deposits & advances from customers and 0
0 0 employees0 0 0 0
Annual Rs. Crore Interest accrued 0.19
1 45.67 49.79 57.29 72.6 64.18 56.5
Annual Rs. Crore Share application money 0 0 0 0 0 0 0
Annual Rs. Crore Other current 116.98
liabilities 83.62 155.2 252.71 170.24 145.07 380.05
Annual Rs. Crore Provisions 0 0 0 0 0 126.09 0
Annual
Annual Rs. Crore Deferred tax liability 0 0 0 0 0 0 0
Annual
Annual Rs. Crore Total liabilities3994.64 4742.93 5994.8 8236.99 10524.05 11559 14781.53
Annual
Annual Rs. Crore Net Worth (net of reval & DRE)
114 164 244.6 709.48 824.1 941.4 1082.46
Annual Profits
Annual PBT 27.87 20.5 32.11 113.36 172.75 180.24 256
Annual Provision for direct tax
0 0 0 0 0 0 46
Annual Corporate tax 0 0 0 0 0 0 46
Annual Deferred tax 0 0 0 0 0 0 0
Annual Less: Deferred tax0 assets / credit
0 0 0 0 0 0
Annual Other direct taxes 0 0 0 0 0 0 0
Annual Fringe benefits tax0 0 0 0 0 0 0
Annual
Annual PAT 27.87 20.5 32.11 113.36 172.75 180.24 210
Annual
Annual Prior period and extra-ordinary income 0.05
1.2 0.11 0.13 0.08 0.04 0.12
Annual Prior period and extra-ordinary expenses 0
0 0 0 0.01 0 0.03
Annual Net prior period and extra-ordinary items
-1.2 -0.11 -0.05 -0.13 -0.07 -0.04 -0.09
Annual
Annual PBPDTA net of100.19
P&E 61.19 114.7 201.2 286.52 312.96 354.54
Annual PBPT net of P&E96.92 56.26 109.49 194.64 276.07 300.65 337.29
Annual PBT net of P&E 26.67 20.39 32.06 113.23 172.68 180.2 255.91
Annual PAT net of P&E 26.67 20.39 32.06 113.23 172.68 180.2 209.91
Annual
Annual Distribution of profits
Annual PBPDTA 100 100 100 100 100 100 100
Annual Provision 69.29 58.52 67.48 40.44 36.08 38.48 22.95
Annual Depreciation & 3.23
Amortisation
8.04 4.54 3.26 3.65 3.93 4.86
Annual Tax 0 0 0 0 0 0 12.97
Annual PAT 27.49 33.44 27.98 56.31 60.28 57.58 59.22
Annual
Annual Non--provisions for 0 0 0 0 0 0 0
Annual Diminution in investment
0 0 0 0 0 0 0
Annual Sundry debtors 0 0 0 0 0 0 0
Annual Loans and advances including 0
0 npas 0 0 0 0 0
Annual Loans and advances to group companies
0 0 0 0 0 0 0
Annual Interest expenses 0 0 0 0 0 0 0
Annual Power expenses 0 0 0 0 0 0 0
- 5. Annual Gratuity 0 0 0 0 0 0 0
Annual Others 0 0 0 0 0 0 0
Annual Shareholder's funds
Annual Networth 114 164 244.6 709.48 824.1 941.4 1082.46
Annual Authorised equity capital
0 0 0 1500 1500 1500 1500
Annual Issued equity capital0 0 0 192.54 192.54 192.54 192.54
Annual Subscribed equity capital
0 0 0 192.54 192.54 0 0
Annual Paid-up equity capital
48 0 0 192.54 192.54 192.54 192.54
Annual Forfeited equity capital
0 0 0 0 0 0 0
Annual Paid-up preference 0 capital 0 0 0 0 0 0
Annual Capital contibution, 0
suspense 78 application money 0
and 128 0 0 0
Annual Bonus share capital0 0 0 0 0 0 0
Annual
Annual Number of shares in Lakh
Annual Authorised equity shares
0 0 0 15000 15000 15000 15000
Annual Issued equity shares0 0 0 1925.4 1925.4 1925.4 1925.4
Annual Subscribed equity shares (net) 0
0 0 1925.4 1925.4 0 0
Annual Equity shares alloted without payment being received in cash 0
0 0 0 0 0 0
Annual
Annual Call in arrears amount
0 0 0 0 0 0 0
Annual From directors 0 0 0 0 0 0 0
Annual From others 0 0 0 0 0 0 0
Annual Reduction in equity0capital -- 0 0 0 0 0 0
Annual Reduction in equity0capital -- lakh shares
0 0 0 0 0 0
Annual
Annual Free reserves 0 0 0 365.94 401.42 463.72 540.78
Annual Security premium reserves (net of deductions) 322.7
0 0 0 322.7 322.7 322.7
Annual Other reserves 0 0 0 0 0 0 0
Annual General reserves 0 0 0 43.2 78.65 141 213.45
Annual Balance as per profit & loss account
0 0 0 0.04 0.07 0.02 4.63
Annual
Annual Specific reserves 66 86 116.6 151 230.14 285.14 349.14
Annual Capital, debt, investment & other reserves
66 86 116.6 151 230.14 285.14 349.14
Annual Debenture/bond redemption reserves
0 0 0 0 0 0 0
Annual Foreign project reserves
0 0 0 0 0 0 0
Annual Investment fluctuation reserve
0 0 0 0 0 0 0
Annual Employee stock option reserve0
0 0 0 0 0 0
Annual
Annual Revaluation reserves0 0 0 0 0 0 0
Annual
Annual Accumulated losses 0 0 0 0 0 0 0
Annual Revenue expenses directly charged to reserves
0 0 0 0 0 0 0
Annual Sources & Uses of funds
Annual Sources of funds
Annual Internal sources
NA 24.6 35.64 83.84 124.38 128.88 157.49
Annual Retained profits
NA 20 30.6 77.64 114.62 117.3 141.06
Annual Depreciation
NA 4.6 5.04 6.2 9.76 11.58 16.43
Annual
Annual External sources
NA 50.67 258.93 730.15 135.01 -425.52 77.51
Annual Fresh capital
NA 30 50 387.24 0 0 0
Annual Share premium reserves
NA 0 0 322.7 0 0 0
Annual Borrowings A
N 21.79 101.42 198.65 153.71 -468.2 -7.85
Annual Bank/Fin. Inst. borrowings 5.33
NA 9.79 -25.14 7.54 6.6 -23.87
- 6. Annual Debentures and bonds
NA 0 0 0 0 0 0
Annual Borrowings from corporate bodies
NA 0 0 0 0 0 0
Annual Borrowings from group/associated cos 0
NA 0 0 0 0 0
Annual Foreign borrowings
NA 16.46 -8.37 14.79 16.18 -35.81 16.02
Annual Loan from promoters/directors
NA 0 0 0 0 0 0
Annual Other borrowings
NA 121.66 101.43 198.65 153.71 -575.45 0
Annual Current liabilities and provisions
NA -1.12 107.51 144.26 -18.7 42.68 85.36
Annual Sundry creditors
NA -3.24 31.81 39.25 48.46 -49.82 -15.85
Annual Deferred tax liability
NA 0 0 0 0 0 0
Annual
Annual Uses of funds
Annual Gross fixedNAassets 12.82 11.87 19.43 25.33 24.41 60.89
Annual Capital work-in-progress
NA 0 4.39 2.67 4.29 -0.44 -4.23
Annual Investments A
N 244.25 961.72 394.51 667.12 804.46 1569.03
Annual Investment in group companies
NA 0 0 0 0 0 0
Annual Current assets
NA -168.38 -64.5 872.6 461.46 454.31 336.68
Annual Inventories A
N -0.69 -0.03 -0.02 0.1 0.04 -0.07
Annual Total receivables
NA -185.96 16.9 29.43 54.31 530.21 185.86
Annual Sundry debtors
NA 0 0 0 0 0 0
Annual Loans and advances
NA 0 0 0 0 0 0
Annual Loans and advances to group and associated cos 0
NA 0 0 0 0 0
Annual Expenses NA in advance18.56
paid 44.24 -7.73 19.84 71.69 -15.71
Annual Cash and NA balance -0.29
bank -125.61 850.92 387.21 -147.63 166.6
Annual Deferred tax assets
NA 0 0 0 0 0 0
Annual
Annual Total sources/uses
NA 75.27 294.57 813.99 259.39 -296.64 235
Annual Appropriation of profits
Annual Profit/loss after tax
27.87 20.5 32.11 113.36 172.75 180.24 210
Annual Dividends 3.37 0 1 26.48 48.13 52.94 63.54
Annual Equity dividends.37
3 0 1 26.48 48.13 48.13 57.76
Annual Preference dividends 0 0 0 0 0 0 0
Annual Dividend tax 0 0 0 0 0 4.81 5.78
Annual Retained profits 24.5 20.5 31.11 86.88 124.62 127.3 146.46
Annual
Annual Transfer from reserves
0 0 0 0 0 0 0
Annual Balance brought forward
0 0 0 0 0.04 0.07 0.02
Annual Transfer to reserves
24.5 20.5 31.11 86.84 124.59 127.35 141.85
Annual
Annual Profit ratios (times)
Annual Equity dividend / 0.12
PAT 0 0.03 0.23 0.28 0.27 0.28
Annual Pref. dividend / PAT0 0 0 0 0 0 0
Annual Dividend tax / PAT 0 0 0 0 0 0.03 0.03
Annual Retained profits / 0.88
PAT 1 0.97 0.77 0.72 0.71 0.7
Annual Assets
Annual Gross fixed assets 40.34 53.16 65.03 84.46 109.79 134.2 195.09
Annual Land & building 8.6 13.4 14.92 17.89 21.52 26.52 66.3
Annual Plant & machinery 0 0 0 0 0 0 0
Annual Transport & comm. 0 equipment/infrastructure
0 0 0 0 0 0
Annual Furniture,amenities & other fixed assets
31.74 39.76 45.72 59.51 76.92 96.77 122.11
Annual Capital work-in-progress
0 0 4.39 7.06 11.35 10.91 6.68
Annual Intangible assets 0 0 0 0 0 0 0
Annual
Annual Net pre-operative expenses pending allocation
0 0 0 0 0 0 0
- 7. Annual Net lease reserve adjustment 0
0 0 0 0 0 0
Annual Less: Cumulative depreciation
20.76 25.36 30.4 36.6 46.36 57.94 74.37
Annual Less: Arrears of depreciation 0
0 0 0 0 0 0
Annual
Annual Net fixed assets 19.58 27.8 34.63 47.86 63.43 76.26 120.72
Annual
Annual Investments 1316.16 1560.41 2522.13 2916.64 3583.76 4388.22 5957.25
Annual Equity shares 0.24 0.28 0.26 19.09 18.08 21.2 126.67
Annual Preference shares 0 0 0 0 0 0 0
Annual Mutual funds 0 0 0 0 0 0 0
Annual Debt instruments
998.09 1158.11 2034.72 2387.47 3071.98 3884.44 5288.12
Annual Approved securites (slr/statutory req.)
314.35 391.62 427.55 444.82 446.4 439.25 444.36
Annual Assisted companies 0 0 0 0 0 0 0
Annual Others 3.48 10.4 59.6 65.26 47.3 43.33 98.1
Annual Less: Provision for dimunition in value of investments 0
0 0 0 0 0 0
Annual
Annual Group companies 0 0 0 0 0 0 0
Annual Non-group companies
11.65 12.35 166.11 528.02 699.57 1124.16 2323.02
Annual
Annual Market value of quoted investments
0 0 0 0 0 0 0
Annual
Annual Deferred tax assets 0 0 0 0 0 0 0
Annual
Annual Current assets
1103.89 935.51 871.01 1743.61 2205.07 2659.38 2996.06
Annual Cash & bank balance
771.46 771.17 645.56 1496.48 1883.69 1736.06 1902.66
Annual Inventories 0.94 0.25 0.22 0.2 0.3 0.34 0.27
Annual Receivables 315.34 129.38 146.28 175.71 230.02 760.23 946.09
Annual Expenses paid 16.15
in advance34.71 78.95 71.22 91.06 162.75 147.04
Annual
Annual Loans & advances 0 0 0 0 0 0 0
Annual Deferred revenue expenditure 0
0 0 0 0 0 0
Annual
Annual Total assets 3994.64 4742.93 5994.8 8236.99 10524.05 11559 14781.53
Annual Asset utilisation ratios
Annual Total income / Avg. total assets
NA 0.12 0.12 0.12 0.12 0.12 0.12
Annual Total income / Compensation7.63
7.4 to employees
8.04 8.03 7.94 8.78 8.63
Annual
Annual Sales / Avg. GFA (excl. reval. & 0
NA WIP) 0 0 0 0 0
Annual Sales /Avg.NA fixed assets
net 0 0 0 0 0 0
Annual Cash flow
Annual Net cash flow from operating activities (indirect method)
0 0 0 484.29 439.57 -74.46 285.99
Annual Net profit before tax0& extra ordinary income
0 0 180.61 204.85 246.28 255.99
Annual Adjustments for depreciation 0
0 0 6.56 10.45 12.31 17.25
Annual Adjustments for interest payable
0 0 0 0 0 0 0
Annual Adjustments for provn. for contingencies 0
0 0 0 0 0 0
Annual Adjustments for foreign exchange (gain)/loss
0 0 0 0 0 0 0
Annual Adjustments for add back of amortisations & others written off 0
0 0 0 0 0 0
Annual Adjustments for add back of other provisional adjustments 71.22
0 0 0 15.35 54.37 81.3
Annual Adjustments for (profit)/loss on sale of investments 0
0 0 0 0 0 0
Annual Adjustments for (profit)/loss on sale of assets
0 0 0 0 0 0 0
Annual Adjustments for interest income
0 0 0 0 0 0 0
Annual Adjustments for dividend income
0 0 0 0 0 0 0
Annual Adjustments for other expenses / income0
0 0 0 0 0 0
- 8. Annual Adjustments for provision / liabilities written back
0 0 0 0 0 0 0
Annual
Annual Operating cash flow0before working capital changes
0 0 202.52 286.52 312.96 354.54
Annual Cash inflow/(outflow) due to decrease/(increase) in trade & other receivables -1535.43
0 0 0 -1004.78 -1223.83 -345.27
Annual Cash inflow/(outflow) due to decrease/(increase) in inventories
0 0 0 -397.53 -711.79 -807.12 -1573.13
Annual Cash inflow/(outflow) due to increase/(decrease) in trade2140.68 payables
0 0 0 1742.41 & other 907.55 3076.15
Annual Cash inflow/(outflow) due to deposits (banks/FIs) 0
0 0 0 0 0 0
Annual Cash inflow/(outflow) due to advances (banks/FIs) 0
0 0 0 0 0 0
Annual Cash inflow/(outflow) due to others
0 0 0 0 0 0 0
Annual
Annual Cash flow generated from operations
0 0 0 542.62 491.58 68.12 322.13
Annual Cash (outflow) due to direct taxes paid 0
0 0 -58.33 -79.15 -142.58 -36.14
Annual Cash (outflow) due to dividend tax paid 0
0 0 0 0 0 0
Annual
Annual Cash flow before extraordinary 0
0 items 0 484.29 412.43 -74.46 285.99
Annual Cash inflow/(outflow) from extraordinary items
0 0 0 0 27.14 0 0
Annual Cash (outflow) due to miscellaneous expenditure 0
0 0 0 0 0 0
Annual
Annual Net cash inflow/(outflow) from investment activities
0 0 0 -19.61 -25.87 -25.05 -61.62
Annual Cash (outflow) due 0 purchase of fixed assets -20.14
to 0 0 -26.35 -25.41 -62.23
Annual Cash inflow due to sale of fixed0assets
0 0 0.47 0.42 0.3 0.61
Annual Cash inflow/(outflow) due to decrease / (increase) in capital wip 0
0 0 0 0 0 0
Annual Cash inflow /(outflow) due to acquisition/ merger/ hiving off of cos./ units
0 0 0 0 0 0 0
Annual Cash (outflow) due 0 purchase of investments
to 0 0 0 0 0 0
Annual Cash inflow due to sale of investments
0 0 0 0.06 0.06 0.06 0
Annual Cash inflow due to profit on redemption of 0
0 0 shares 0 0 0 0
Annual Cash inflow/(outflow) due to loans to subs./group cos.0
0 0 0 0 0 0
Annual Cash inflow/(outflow) due to loans to other0
0 0 cos. 0 0 0 0
Annual Cash inflow due to interest received
0 0 0 0 0 0 0
Annual Cash inflow due to dividend received
0 0 0 0 0 0 0
Annual Cash inflow/ (outflow) due to other income0
0 0 0 0 0 0
Annual Cash inflow /(outflow) due to disbursements
0 0 0 0 0 0 0
Annual
Annual Net cash inflow/ (outflow) from financing activities386.24
0 0 0 -26.48 -48.14 -57.76
Annual Cash inflow due to proceeds from share issues 387.24
0 0 0 0 0 0
Annual Cash (outflow) due 0 redemption/buyback0of capital 0
to 0 0 0 0
Annual Cash inflow due to cash subsidy
0 0 0 0 0 0 0
Annual Cash inflow due to proceeds from total borrowings 0
0 0 0 0 0 0
Annual Cash inflow due to0proceeds from long term borrowings
0 0 0 0 0 0
Annual Cash inflow due to0proceeds from short term borrowings
0 0 0 0 0 0
Annual Cash (outflow) due 0 repayment of total borrowings 0
to 0 0 0 0 0
Annual Cash (outflow) due to repayment of long term liabilities
0 0 0 0 0 0 0
Annual Cash (outflow) due to repayment of short0
0 0 term liabilities
0 0 0 0
Annual Cash (outflow) due 0 issue expenses
to 0 0 0 0 0 0
Annual Cash (outflow) due 0 interest paid
to 0 0 0 0 0 0
Annual Cash (outflow) due 0 dividend 0
to paid 0 -1 -26.48 -48.14 -57.76
Annual Cash inflow/(outflow) due to other cash receipts/payables from financing activities
0 0 0 0 0 0 0
Annual
Annual Net cash inflow/(outflow) due to 0 increase/(decrease) in cash & cash-147.65
0 net 0 850.92 387.22 equivalents166.61
Annual Cash flow -- opening 0balance 0 0 645.56 1496.48 1883.7 1736.05
Annual Cash flow -- closing balance
0 0 0 1496.48 1883.7 1736.05 1902.66
Annual Compensation to employees
Annual Compensation to employees
60.65 70.43 80.62 108.79 141.85 154.31 184.97
- 9. Annual Salaries & wages 0 70.43 80.62 108.79 141.85 0 0
Annual Bonus & ex gratia 0 0 0 0 0 0 0
Annual Provident fund contribution
0 0 0 0 0 0 0
Annual Gratuities paid 0 0 0 0 0 0 0
Annual Staff welfare 0 0 0 0 0 0 0
Annual Staff training 0 0 0 0 0 0 0
Annual ESOPs 0 0 0 0 0 0 0
Annual Voluntary retirement scheme (VRS) (amortised)
0 0 0 0 0 0 0
Annual Payment under VRS (one time 0
0 charge) 0 0 0 0 0
Annual Arrears paid during 0 year 0
the 0 0 0 0 0
Annual Payments / reimbursement of expenses 0
0 0 0 0 0 0
Annual Other expenses on 0 employees 0 0 0 0 0 0
Annual Directors' remuneration
0 0 0 0 0 0 0
Annual
Annual Directors' salary 0 0 0 0 0 0 0
Annual Sitting fees 0 0 0 0 0 0 0
Annual Bonus/Commission0 0 0 0 0 0 0
Annual Perquisites 0 0 0 0 0 0 0
Annual Retirement benefits0 0 0 0 0 0 0
Annual Contribution to PF 0 0 0 0 0 0 0
Annual
Annual No. of employees ('000 nos)
10 11 11 12 13 13 14
Annual
Annual Per employee indicators in Lakh
Annual Compensation per employee
0.56 0.62 0.68 0.88 1.08 1.14 1.3
Annual Income per employee
4.13 4.73 5.45 7.06 8.58 9.98 11.21
Annual PBDITA per employee
2.59 3.41 3.64 4.79 6.16 7.32 8.65
Annual PBT per employee
0.26 0.18 0.27 0.92 1.32 1.33 1.8
Annual PAT per employee 0 0 0 0 0 0 0.32
Annual
Annual ESOP expenses
Annual Shares outstanding 0 the fiscal end) - Lakh shares
(at 0 0 1925.4 1925.4 1925.4 1925.4
Annual ESOP expenses / Total employee cost
0 0 0 0 0 0 0
Annual Staff welfare & Training / Compensation to0employees
0 0 0 0 0 0
Annual Directors' remuneration / Compensation to0employees
0 0 0 0 0 0
Annual VRS / Compensation to employees
0 0 0 0 0 0 0
Annual Contingent liabilities
Annual Contingent liabilities
941.76 922.66 1619.7 1915.42 2245.01 1418.99 2784.86
Annual Bills/cheques 265.45
discounted 0 0 0 0 0 0
Annual Letter of credit 0 0 0 0 0 0 0
Annual Disputed taxes 0 18.06 32.93 72.15 116.39 0 99.89
Annual Income tax 0 10.91 26.16 64.09 108.55 0 82.76
Annual Excise 0 0 0 0 0 0 0
Annual Custom duties 0 0 0 0 0 0 0
Annual Sales tax 0 0 0 0 0 0 0
Annual Others incl. octroi & local taxes
0 7.15 6.77 8.06 7.84 0 17.13
Annual
Annual Disputed claims/others
4.99 0 0 0 0 71.55 0
Annual Licence fees (telecom, etc.) 0
0 0 0 0 0 0
Annual Lease rentals 0 0 0 0 0 0 0
Annual Other claims / others
0 0 0 0 0 0 0
Annual Total guarantees
350.97 415.34 522.69 568.72 736.44 781.82 1066.01
Annual Guarantees by company for others 522.69
0 415.34 568.72 736.44 0 0
- 10. Annual Guarantees by company for 0
0 group companies
0 0 0 0 0
Annual Counter guarantees by company
0 0 0 0 0 0 0
Annual Counter guarantees for group companies
0 0 0 0 0 0 0
Annual
Annual Bonds issued in favour of govt.0
0 authorities, etc.
0 0 0 0 0
Annual For disputed taxes0 0 0 0 0 0 0
Annual Income tax 0 0 0 0 0 0 0
Annual Excise 0 0 0 0 0 0 0
Annual Custom duties 0 0 0 0 0 0 0
Annual Sales tax 0 0 0 0 0 0 0
Annual Bonds issued by directors/promoters in their personal capacity 0
0 0 0 0 0 0
Annual Bonds issued for other purposes
0 0 0 0 0 0 0
Annual Liabilities on account of non fulfilment of export obligation
0 0 0 0 0 0 0
Annual Liabilities on account of forward foreign exchange contract 353.05
0 91.81 439.12 414.11 0 562.48
Annual Contracts remaining to be executed on capital account
0 0 0 0 0 0 0
Annual Claims against the company not acknowledged as debt
0 0 0 0 0 0 0
Annual Other contingent liabilities 19.55
141.6 30.11 36.62 23.79 274 17.97
Annual
Annual Contingent liabilities / Net worth
8.26 5.63 6.62 2.7 2.72 1.51 2.57
Annual Costs compared to sales
Annual Raw materials, stores & spares Err
Err Err Err Err Err Err
Annual Raw material expenses
Err Err Err Err Err Err Err
Annual Stores, spares, tools consumed Err
Err Err Err Err Err Err
Annual Packaging expenses Err
Err Err Err Err Err Err
Annual Purchase of finished goods
Err Err Err Err Err Err Err
Annual Power, fuelErrwater charges
& Err Err Err Err Err Err
Annual Compensation to employees
Err Err Err Err Err Err Err
Annual Salaries, wages, bonus, ex gratia pf & gratuties paid Err
Err Err Err Err Err Err
Annual Staff welfare & training expenses
Err Err Err Err Err Err Err
Annual
Annual Indirect taxes
Err Err Err Err Err Err Err
Annual Excise duty
Err Err Err Err Err Err Err
Annual Royalties, technical know-how fees, etc.
Err Err Err Err Err Err Err
Annual Rent & lease rent
Err Err Err Err Err Err Err
Annual Repairs & maintenance
Err Err Err Err Err Err Err
Annual Insurance premium paid
Err Err Err Err Err Err Err
Annual
Annual OutsourcedErrmanufacturing jobs
Err Err Err Err Err Err
Annual OutsourcedErrprofessional jobs
Err Err Err Err Err Err
Annual Directors' fees
Err Err Err Err Err Err Err
Annual Advertising Err
expenses Err Err Err Err Err Err
Annual Marketing expenses Err
Err Err Err Err Err Err
Annual DistributionErr
expenses Err Err Err Err Err Err
Annual Travel expenses
Err Err Err Err Err Err Err
Annual Communication expenses
Err Err Err Err Err Err Err
Annual Printing & stationery expenses
Err Err Err Err Err Err Err
Annual Miscellaneous expenditure
Err Err Err Err Err Err Err
Annual
Annual Other operational expenses of indl. enterprises
Err Err Err Err Err Err Err
Annual OperationalErr
expenses Errnon-financial services enterprises
of Err Err Err Err Err
Annual Current liabilities
Annual Current liabilities & provisions
181.66 180.54 288.05 432.31 413.61 456.29 541.65
Annual Sundry creditors 0 0 0 0 0 120.95 0
- 11. Annual Sundry creditors for goods & 0
0 services 0 0 0 120.95 0
Annual Sundry creditors for capital works
0 0 0 0 0 0 0
Annual Of which: sundry creditors from group / subsidiary cos.
0 0 0 0 0 0 0
Annual
Annual Acceptances 54.49 51.25 83.06 122.31 170.77 0 105.1
Annual Deposits & advances from customers & employees 0
0 0 0 0 0 0
Annual Security deposits 0
/trade deposits /dealer0
0 deposits 0 0 0 0
Annual Advances from customers on0capital account
0 0 0 0 0 0
Annual Advances from customers on0revenue account
0 0 0 0 0 0
Annual Deposits from employees
0 0 0 0 0 0 0
Annual
Annual Interest accrued 0.19
1 45.67 49.79 57.29 72.6 64.18 56.5
Annual Interest accrued & due
10.19 0 0 0 0 0 0
Annual Interest accrued but not due
0 45.67 49.79 57.29 72.6 64.18 56.5
Annual
Annual Share application money/advances - oversubscribed /refundable 0
0 0 0 0 amount 0 0
Annual Other current 116.98
liabilities 83.62 155.2 252.71 170.24 145.07 380.05
Annual
Annual Provisions 0 0 0 0 0 126.09 0
Annual Corporate tax provision
0 0 0 0 0 0 0
Annual Other direct & indirect tax provisions
0 0 0 0 0 0 0
Annual Provision for bad/doubtful advances & debts
0 0 0 0 0 0 0
Annual Total dividend provisions
0 0 0 0 0 0 0
Annual Dividend tax provision
0 0 0 0 0 0 0
Annual Provision for employees
0 0 0 0 0 0 0
Annual Other provisions 0 0 0 0 0 126.09 0
Annual Contribution to exchequer
Annual Total taxes 0 0 0 0 0 4.81 51.78
Annual
Annual Indirect taxes 0 0 0 0 0 0 0
Annual Excise duty 0 0 0 0 0 0 0
Annual Sales tax 0 0 0 0 0 0 0
Annual Value added tax (VAT) 0 0 0 0 0 0 0
Annual Rates & taxes (including octroi)0
0 0 0 0 0 0
Annual Turnover tax 0 0 0 0 0 0 0
Annual Registration fees / stamp duties
0 0 0 0 0 0 0
Annual Contribution to oil pool account0
0 0 0 0 0 0
Annual Contribution to joint 0
plant committee
0 0 0 0 0 0
Annual Interest tax 0 0 0 0 0 0 0
Annual Service tax 0 0 0 0 0 0 0
Annual Mining cess 0 0 0 0 0 0 0
Annual Miscellaneous indirect taxes 0
0 0 0 0 0 0
Annual
Annual Direct taxes 0 0 0 0 0 4.81 51.78
Annual Corporate tax 0 0 0 0 0 0 46
Annual Deferred tax 0 0 0 0 0 0 0
Annual Less: Deferred tax assets / credit
0 0 0 0 0 0 0
Annual Wealth tax 0 0 0 0 0 0 0
Annual Agricultural income 0
tax 0 0 0 0 0 0
Annual Fringe benefits tax 0 0 0 0 0 0 0
Annual Dividend tax 0 0 0 0 0 4.81 5.78
Annual Other miscellaneous taxes
0 0 0 0 0 0 0
Annual
- 12. Annual Prior period taxes 0 0 0 0 0 0 0
Annual Licence fees (telecom, etc.)
0 0 0 0 0 0 0
Annual
Annual Tax incidence (%)
Annual Total taxes / Total income
0 0 0 0 0 0.36 3.24
Annual Total indirect taxes 0Total income
/ 0 0 0 0 0 0
Annual Excise / Industrial sales
Err Err Err Err Err Err Err
Annual Total direct taxes / Total income
0 0 0 0 0 0.36 3.24
Annual Corporate tax / PBT 0 0 0 0 0 0 17.97
Annual FBT / (Compensation to employees & travel expenses)
0 0 0 0 0 0 0
Annual
Annual Disputed taxes 0 18.06 32.93 72.15 116.39 0 99.89
Annual Income tax 0 10.91 26.16 64.09 108.55 0 82.76
Annual Excise 0 0 0 0 0 0 0
Annual Custom duties 0 0 0 0 0 0 0
Annual Sales tax 0 0 0 0 0 0 0
Annual Others incl. octroi &0local taxes
7.15 6.77 8.06 7.84 0 17.13
Annual
Annual Bonds issued in favour of govt. authorities, etc.
0 0 0 0 0 0 0
Annual For disputed taxes 0 0 0 0 0 0 0
Annual Income tax 0 0 0 0 0 0 0
Annual Excise 0 0 0 0 0 0 0
Annual Custom duties 0 0 0 0 0 0 0
Annual Sales tax 0 0 0 0 0 0 0
Annual Executive Summary
Annual Total income 448.84 537.25 647.8 873.37 1126.77 1354.92 1596.73
Annual Sales 0 0 0 0 0 0 0
Annual Income from financial services
447.12 536.38 646.78 868.9 1121.73 1348.42 1582.61
Annual
Annual Total expenses420.97 516.75 615.69 760.01 954.02 1174.68 1386.73
Annual Raw material expenses0 0 0 0 0 0 0
Annual Power, fuel & water charges 0
0 0 0 0 0 0
Annual Compensation60.65to employees
70.43 80.62 108.79 141.85 154.31 184.97
Annual Indirect taxes 0 0 0 0 0 0 0
Annual Selling & distribution expenses
0.1 0.18 0.14 0.54 0.7 0.49 1.48
Annual Other operational exp. of indl. 0
0 enterprises0 0 0 0 0
Annual Other oper. exp. of 0non-fin. service enterprises
0 0 0 0 0 0
Annual
Annual PBDITA 280.82 387.01 432.71 591.87 808.94 993.42 1231.8
Annual PBDTA 31.14 25.43 37.32 119.92 183.2 192.55 273.25
Annual PBT 27.87 20.5 32.11 113.36 172.75 180.24 256
Annual PAT 27.87 20.5 32.11 113.36 172.75 180.24 210
Annual
Annual Net worth 114 164 244.6 709.48 824.1 941.4 1082.46
Annual Paid up equity capital (net of forfeited capital) 192.54
48 0 0 192.54 192.54 192.54
Annual Reserves & surplus
66 86 116.6 516.94 631.56 748.86 889.92
Annual
Annual Total borrowings99.88 121.67 223.09 421.74 575.45 107.25 99.4
Annual Current liabilities & provisions
181.66 180.54 288.05 432.31 413.61 456.29 541.65
Annual
Annual Total assets 3994.64 4742.93 5994.8 8236.99 10524.05 11559 14781.53
Annual Gross fixed assets
40.34 53.16 65.03 84.46 109.79 134.2 195.09
Annual Net fixed assets
19.58 27.8 34.63 47.86 63.43 76.26 120.72
- 13. Annual Investments1316.16 1560.41 2522.13 2916.64 3583.76 4388.22 5957.25
Annual Current assets
1103.89 935.51 871.01 1743.61 2205.07 2659.38 2996.06
Annual Loans & advances 0 0 0 0 0 0 0
Annual
Annual Growth (%)
Annual Total income
NA 19.7 20.58 34.82 29.01 20.25 17.85
Annual Total expenses
NA 22.75 19.15 23.44 25.53 23.13 18.05
Annual PBDITA NA 37.81 11.81 36.78 36.68 22.81 24
Annual PAT NA -26.44 56.63 253.04 52.39 4.34 16.51
Annual Net worthNA 43.86 49.15 190.06 16.16 14.23 14.98
Annual Total assets
NA 18.73 26.39 37.4 27.77 9.83 27.88
Annual Expenses details
Annual Total expenses420.97 516.75 615.69 760.01 954.02 1174.68 1386.73
Annual Raw materials, stores & spares0
0 0 0 0 0 0
Annual Raw material expenses
0 0 0 0 0 0 0
Annual Stores, spares, tools consumed
0 0 0 0 0 0 0
Annual Packaging expenses 0 0 0 0 0 0 0
Annual Purchase of finished goods
0 0 0 0 0 0 0
Annual Power, fuel & water0 charges 0 0 0 0 0 0
Annual Compensation 60.65
to employees70.43 80.62 108.79 141.85 154.31 184.97
Annual Indirect taxes 0 0 0 0 0 0 0
Annual Excise duty 0 0 0 0 0 0 0
Annual Royalties, technical 0
know-how 0 fees, etc. 0 0 0 0 0
Annual Rent & lease rent12.5 15.26 18.86 24.48 25.42 31.47 36.08
Annual Repairs & maintenance
0.45 2.04 2.5 3.2 3.02 3.23 3.29
Annual Insurance premium1.85 1.81 9.51 17.98 3.6 6.72 5.59
Annual Outsourced manufacturing jobs
0 0 0 0 0 0 0
Annual Outsourced professional jobs
1.7 1.52 2 3.18 3.46 2.74 3.34
Annual Directors' fees 0 0.06 0.06 0.08 0.11 0 0
Annual
Annual Advertising expenses0 0.18 0.14 0.54 0.7 0 0
Annual Marketing expenses 0 0 0 0 0 0 0
Annual Distribution expenses
0 0 0 0 0 0 0
Annual Travel expenses 0 0 0 0 0 0 0
Annual Communication expenses 2.73
0 3 3.54 4.65 0 0
Annual Printing & stationery expenses
0 3.76 3.08 3.76 5.22 0 0
Annual Miscellaneous expenses 16.58
20.49 17.89 33.23 26.4 42.09 48.57
Annual Other operational exp. of indl. enterprises 0
0 0 0 0 0 0
Annual Other operational exp. of non-fin. services 0
0 0 enterprises0 0 0 0
Annual
Annual Fund based financial services expenses
249.68 361.58 395.39 471.95 625.74 800.87 958.55
Annual Interest expenses
249.68 361.58 395.39 471.95 625.74 800.87 958.55
Annual Financial charges on instruments
0 0 0 0 0 0 0
Annual Other fund based financial services expenses
0 0 0 0 0 0 0
Annual Fee based financial0 services expenses 0
0 0 0 0 0
Annual Bill discounting charges
0 0 0 0 0 0 0
Annual Bank charges, guarantee fees, etc.
0 0 0 0 0 0 0
Annual Treasury operations expenses 0
0.03 0 1.31 0 0 0.2
Annual Loss on sale of0.03
investments 0 0 0 0 0 0.2
Annual Loss on sale of long term investments 0
0 0 0 0 0 0
Annual Loss on sale of current investments
0 0 0 0 0 0 0
Annual Loss relating to forex transactions
0 0 0 0 0 0 0
Annual Loss on revaluation of investments
0 0 0 1.31 0 0 0
- 14. Annual Total provisions
70.25 35.87 77.43 81.41 103.39 120.45 81.38
Annual Provisions for bad/0doubtful advances, debts
0 0 0 0 0 75.53
Annual Depreciation (net of transfer4.93 reval.5.21
3.27 from reserves) 6.56 10.45 12.31 17.25
Annual Amortisation 0 0 0 0 0 0 0
Annual Write-offs 0 0 0 0 0 0 0
Annual Less: Expenses capitalised
0 0 0 0 0 0 0
Annual Less: DRE & expenses charged to others 0
0 0 0 0 0 0
Annual
Annual Prior period & extra-ordinary expenses
0 0 0 0 0.01 0 0.03
Annual Prior period expenses
0 0 0 0 0 0 0
Annual Cash prior period0expenses 0 0 0 0 0 0
Annual Prior period taxes
0 0 0 0 0 0 0
Annual Residual and combined cash prior period expenses
0 0 0 0 0 0 0
Annual Non cash prior period expenses
0 0 0 0 0 0 0
Annual Prior period depreciation 0
0 0 0 0 0 0
Annual Residual and combined non cash prior0period expenses
0 0 0 0 0 0
Annual Extra-ordinary expenses
0 0 0 0 0.01 0 0.03
Annual Loss on impairment of assets
0 0 0 0 0 0 0
Annual Loss on sale of assets
0 0 0 0 0.01 0 0.03
Annual Loss on change in0 accounting0policies 0 0 0 0 0
Annual Provision for direct tax
0 0 0 0 0 0 46
Annual Corporate tax 0 0 0 0 0 0 46
Annual Deferred tax 0 0 0 0 0 0 0
Annual Less: Deferred tax0 assets / credit
0 0 0 0 0 0
Annual Other direct taxes 0 0 0 0 0 0 0
Annual Fringe benefits tax
0 0 0 0 0 0 0
Annual
Annual Research & development expenses
0 0 0 0 0 0 0
Annual Research & development expenses: Capital account 0
0 0 0 0 0 0
Annual Research & development expenses: Current account 0
0 0 0 0 0 0
Annual Fixed assets
Annual Gross fixed assets
40.34 53.16 65.03 84.46 109.79 134.2 195.09
Annual Intangible assets 0 0 0 0 0 0 0
Annual Goodwill 0 0 0 0 0 0 0
Annual Software 0 0 0 0 0 0 0
Annual Other intangible assets
0 0 0 0 0 0 0
Annual Land & building 8.6 13.4 14.92 17.89 21.52 26.52 66.3
Annual Land 0 0 0 0 0 0 0
Annual Building 8.6 13.4 14.92 17.89 21.52 26.52 66.3
Annual Additions during the year 4.8
3.34 1.52 2.97 3.62 5 39.78
Annual Less: Cumulative depreciation
1.99 2.56 3.17 3.93 5.66 7.08 10.43
Annual
Annual Plant & machinery /0 computers 0 electrical 0
/ installations
0 0 0 0
Annual Plant & machinery0 0 0 0 0 0 0
Annual Additions during the year 0
0 0 0 0 0 0
Annual Less: Cumulative0depreciation 0 0 0 0 0 0
Annual Computers/IT systems 0 0 0 0 0 0 0
Annual Additions during the year 0
0 0 0 0 0 0
Annual Less: Cumulative0depreciation 0 0 0 0 0 0
Annual Electrical installations & fittings
0 0 0 0 0 0 0
Annual
Annual Transport infrastructure
0 0 0 0 0 0 0
Annual Transport equipment / vehicles0
0 0 0 0 0 0
- 15. Annual Communication equipment
0 0 0 0 0 0 0
Annual Furniture & fixtures 0 0 0 0 0 0 0
Annual Social amenities 0 0 0 0 0 0 0
Annual Other fixed assets
31.74 39.76 45.72 59.51 76.92 96.77 122.11
Annual
Annual Total additions during the year
10.3 13.28 7.7 17.47 22.06 25.85 66.46
Annual Net lease reserve adjustment 0
0 0 0 0 0 0
Annual Less: Arrears of depreciation (cumulative) 0
0 0 0 0 0 0
Annual Less: Total cumulative depreciation
20.76 25.36 30.4 36.6 46.36 57.94 74.37
Annual
Annual Net fixed assets 19.58 27.8 34.63 47.86 63.43 76.26 120.72
Annual Net pre-operative expenses pending allocation
0 0 0 0 0 0 0
Annual Capital work-in-progress
0 0 4.39 7.06 11.35 10.91 6.68
Annual Assets held for sale0 transfer 0
/ 0 0 0 0 0
Annual Less: Provisions / provision for 0
0 impairment0 0 0 0 0
Annual Forex transactions
Annual Total forex earnings 0 0 0 0 0 0 0
Annual Export of goods(fob)0 0 0 0 0 0 0
Annual Export of services 0 0 0 0 0 0 0
Annual Forex earning -- dividends
0 0 0 0 0 0 0
Annual Forex earning -- interest
0 0 0 0 0 0 0
Annual Others 0 0 0 0 0 0 0
Annual
Annual Total forex spending 0 0 0 0 0 0 0
Annual Import of raw materials (cif)
0 0 0 0 0 0 0
Annual Import of stores & spares (cif) 0
0 0 0 0 0 0
Annual Import of finished goods (cif) 0
0 0 0 0 0 0
Annual Import of capital goods (cif)
0 0 0 0 0 0 0
Annual Forex spending -- interest
0 0 0 0 0 0 0
Annual Forex spending -- dividends 0
0 0 0 0 0 0
Annual Forex spending -- travelling
0 0 0 0 0 0 0
Annual Forex spending royalty/ technical knowhow
0 0 0 0 0 0 0
Annual Forex spending others(incl. payment for services)
0 0 0 0 0 0 0
Annual
Annual Export / Sales (%)
Err Err Err Err Err Err Err
Annual Total forex earnings /0Total income (%)
0 0 0 0 0 0
Annual Raw material imports / Err material purchases (%)
Err Raw Err Err Err Err Err
Annual
Annual Raw materials consumed
0 0 0 0 0 0 0
Annual Indigenous 0 0 0 0 0 0 0
Annual Imported 0 0 0 0 0 0 0
Annual Stores & spares(components) consumed 0
0 0 0 0 0 0
Annual Indigenous 0 0 0 0 0 0 0
Annual Imported 0 0 0 0 0 0 0
Annual Others consumed 0 0 0 0 0 0 0
Annual Indigenous 0 0 0 0 0 0 0
Annual Imported 0 0 0 0 0 0 0
Annual Growth in Assets & Liabilities
Annual Gross fixedNA
assets 31.78 22.33 29.88 29.99 22.23 45.37
Annual Less: Cumulative depreciation
NA 22.16 19.87 20.39 26.67 24.98 28.36
Annual Net fixed assets
NA 41.98 24.57 38.2 32.53 20.23 58.3
Annual
Annual Investments A
N 18.56 61.63 15.64 22.87 22.45 35.76
- 16. Annual Market value of quoted investments
NA Err Err Err Err Err Err
Annual Deferred tax assets Err
NA Err Err Err Err Err
Annual Current assets
NA -15.25 -6.89 100.18 26.47 20.6 12.66
Annual Loans & advances
NA Err Err Err Err Err Err
Annual Deferred revenue expenditure
NA Err Err Err Err Err Err
Annual
Annual Total assets A
N 18.73 26.39 37.4 27.77 9.83 27.88
Annual
Annual Net Worth NA 43.86 49.15 190.06 16.16 14.23 14.98
Annual Authorised capital Err
NA Err Err 0 0 0
Annual Issued equity capital Err
NA Err Err 0 0 0
Annual Paid up equity capital (net of forfeited capital)
NA Err Err Err 0 0 0
Annual Forfeited NA
equity capital
Err Err Err Err Err Err
Annual Paid up preference capital (net of forfeited capital)
NA Err Err Err Err Err Err
Annual Capital contibution, suspense and application money Err
NA Err 64.1 Err Err Err
Annual ReservesNAsurplus
& 30.3 35.58 343.34 22.17 18.57 18.84
Annual
Annual Total borrowings
NA 21.82 83.36 89.04 36.45 -81.36 -7.32
Annual Secured borrowings Err
NA Err Err Err Err -28.06
Annual Unsecured borrowings 542.4
NA 1.17 -8.41 21.04 -83.74 72.19
Annual
Annual Current liabilities & provisions
NA -0.62 59.55 50.08 -4.33 10.32 18.71
Annual Sundry creditors
NA Err Err Err Err Err Err
Annual Interest accrued
NA 348.18 9.02 15.06 26.72 -11.6 -11.97
Annual Share application money
NA Err Err Err Err Err Err
Annual Other current liabilities -28.52
NA 85.6 62.83 -32.63 -14.79 161.98
Annual Provisions A
N Err Err Err Err Err Err
Annual
Annual Total liabilities
NA 18.73 26.39 37.4 27.77 9.83 27.88
Annual
Annual Contingent NA
liabilities -2.03 75.55 18.26 17.21 -36.79 96.26
Annual
Annual Growth in Income & Expenditure
Annual Total income
NA 19.7 20.58 34.82 29.01 20.25 17.85
Annual Sales NA Err Err Err Err Err Err
Annual Industrial sales
NA Err Err Err Err Err Err
Annual Income NA non-financial services
from Err Err Err Err Err Err
Annual Income from financial services
NA 19.96 20.58 34.34 29.1 20.21 17.37
Annual InterestNA 67.88 19.54 32.62 30.53 -26.22 4.3
Annual Dividends
NA Err Err Err 62.5 190026.92 36.3
Annual Treasury operations
NA 50.1 14.23 114.67 -16.01 2.16 53.87
Annual Other income
NA 46.15 27.63 347.42 14.29 30.24 116.72
Annual Prior period income & extraordinary income
NA -90.83 -54.55 160 -38.46 -50 200
Annual Change in stock
NA Err Err Err Err Err Err
Annual
Annual Total expenses
NA 22.75 19.15 23.44 25.53 23.13 18.05
Annual Raw materials expenses
NA Err Err Err Err Err Err
Annual Packaging expensesErr
NA Err Err Err Err Err
Annual PurchaseNA finished Err
of goods Err Err Err Err Err
Annual Power, fuel & water charges
NA Err Err Err Err Err Err
Annual Compensation to employees
NA 16.13 14.47 34.94 30.39 8.78 19.87
Annual Indirect taxes
NA Err Err Err Err Err Err
Annual Royalties, technical know-how fees, etc. Err
NA Err Err Err Err Err