VIP Independent Call Girls in Mira Bhayandar 🌹 9920725232 ( Call Me ) Mumbai ...
Saral Gyan - 15% @ 90 Days - Nov 2017
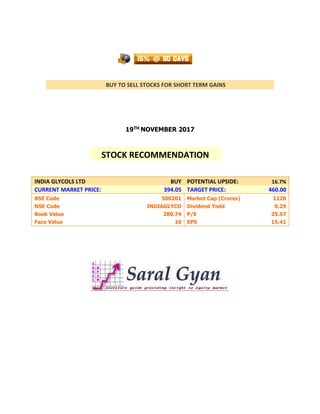
1. BUY TO SELL STOCKS FOR SHORT TERM GAINS
19TH NOVEMBER 2017
INDIA GLYCOLS LTD BUY POTENTIAL UPSIDE: 16.7%
CURRENT MARKET PRICE: 394.05 TARGET PRICE: 460.00
BSE Code 500201 Market Cap (Crores) 1220
NSE Code INDIAGLYCO Dividend Yield 0.25
Book Value 280.74 P/E 25.57
Face Value 10 EPS 15.41
STOCK RECOMMENDATION
2. 15% @ 90 DAYS – NOVEMBER 2017
- 2 - SARAL GYAN CAPITAL SERVICES
Comparative Chart (Last 1 Year)
Returns: India Glycols & Nifty:
Nifty: 29.7% India Glycols: 227.4%
Stock Resistance and Support:
1st Resistance – 430 1st Support – 355
2nd Resistance – 450 2nd Support – 330
3. 15% @ 90 DAYS – NOVEMBER 2017
- 3 - SARAL GYAN CAPITAL SERVICES
Financials at a Glance:
Quarterly Results of India Glycols Ltd (Rs. In Crores)
Particulars Sep 2017 Jun 2017 Mar 2017 Dec 2016
Audited / UnAudited UnAudited UnAudited UnAudited UnAudited
Net Sales 888.3 688.6 610.9 529.7
Other Operating Income -- -- -- 6.58
Total Income From Operations 888.3 688.6 610.9 536.2
Consumption of Raw Materials 450.6 296.6 305.2 316
Purchase of Traded Goods 160.8 166.2 37.8 39.84
Increase/Decrease in Stocks 18.47 7.21 30.73 -34.38
Power & Fuel 83.89 70.74 81.11 68.37
Employees Cost 24.65 22.64 23.07 22.91
Depreciation 17.11 17.2 26.57 13.87
R & D Expenses -- -- -- --
Provisions And Contingencies -- -- -- --
Other Expenses 79.12 71.33 65.64 59.42
Other Income 0.42 6.62 3.19 1.22
P/L Before Int., Excpt. Items & Tax 54.08 43.22 43.94 51.48
Interest 31.86 30.69 28.67 29.41
P/L Before Excpt. Items & Tax 22.22 12.53 15.27 22.07
Exceptional Items -- -- -- -9.72
P/L Before Tax 22.22 12.53 15.27 12.35
Tax 7.53 4.27 -0.58 3.43
P/L After Tax 14.69 8.26 15.85 8.92
Prior Year Adjustments -- -- -- --
Net Profit/(Loss) 14.69 8.26 15.85 8.92
Equity Share Capital 30.96 30.96 30.96 30.96
EPS 4.74 2.67 5.12 2.88
No Of Shares with Public 1,20,54,675 1,20,54,675 1,20,54,675 1,20,54,675
Public Share Holding (%) 38.93 38.93 38.93 38.93