1. Chapter – 1
1.0 Introduction:
The Company was incorporated on 6 June 1973 as a Private co. limited by shares registered under the
Companies act. Subsequently the co converted to Public co. limited by shares vide extra Ordinary
General Meeting held on 21 June 2005 and is listed both in Dhaka and Chittagong Stock Exchanges of
Bangladesh.
1.1 Origin of The Study:
This report has been prepared as a part of the internship program which is an integral part of the BBA
program under the Dept. of Accounting & Information Systems in the Faculty of Business Studies,
University of Dhaka. The organization attachment was started on 2nd March, 2008 and ended on 1st
June, 2008. This report on “Financial Statements Analysis of Berger Paints Bangladesh ltd.” was assigned
by academic supervisor Md. Al-Amin, Assistant Professor of Dept of Accounting & Information Systems,
Faculty of Business Studies, University of Dhaka.
1.2 Purpose of The Study:
The purpose of the study is to make an analysis of Financial Statements of Berger Paints in terms of the
Paints Industry. This study attempted to understand the financial conditions of Berger paints on
different segments such as liquidity, profitability & solvency. The purpose is also to make
recommendations for improving the financial stability and soundness of different services provided to
the shareholders of BPBL. It is also the purpose of the researcher to help the management by providing
an idea to take appropriate decisions about the quality of the investing & financing in future.
1.3 Scope of the study
The scope of this study was strictly confined to the annual report & personal contact with the
employees of Berger Paints Bangladesh ltd. To collect the information I worked in the finance section &
cost & budget section of BPBL. All other data related to the financial analysis was collected from web
sites of BPBL & other related co.
1.4 Methodology of the study:
2. For smooth and accurate study everyone have to follow some rules & regulation. The study impute were
collected from two sources:
Primary sources
Practical desk work
Face to face conversation with the officer
Direct observations
Face to face conversation with the client
Secondary sources
Annual report of BPBL
Files & Folders
Daily diary (containing my activities of practical orientation in BPBL) maintained by me,
Various publications on BPBL,
Website
1.5 RESEARCH OBJECTIVES
1.5.1 Broad objective:
To assess and find out the financial conditions of the firm to analysis how much the co. is capable of
doing business properly in future.
1.5.2 Specific objective:
Whether the customers are loyal to buy Berger Color Bank product?
Whether Color Bank can build the relationship with the target customer and the dealer through their
products?
Whether Color Bank can build the relationship with the target customer and the specifies through their
products.
3. Whether Color Bank can build the relationship with the target customer and the painters through their
products?
Find out the source of information.
Find out the customer satisfaction level in consideration to the product quality.
Find out the customer satisfaction level in consideration to the service of Berger Color Bank.
Whether Berger can create awareness in the consumer mind?
1.6 Contact methods:
To collect data for the report I use two types of contact method. I use personal or face to face contact
method.
1.7 Limitations of the study:
There were some restrictions to have access to the information confidential by concern authority.
Time and cost constraints also other limitations regarding this analysis.
Having lack of experience of the researcher.
Analysis was based mainly on financial statements.
Chapter-2
2 BACKGROUND OF THE COMPANY
2.1.1 Berger Paints Bangladesh Ltd: An Overview
Berger, the market leader in the Bangladesh paints market, is one of the oldest names in the
global paint industry. The company is operating in the paint industry for almost two centuries. It
has its origin in the year of 1760 and from then on the company is operating with strong
adherence to quality and social responsibility. Initially, Lewis Berger, a German national,
founded dye & pigment making business in England. Lewis Berger & Sons Limited grew rapidly
with a strong reputation for innovation and entrepreneurship culminating in perfecting the
process of making Prussian blue, a deep blue dye, a color widely used for many European
armies' uniform. Production of dyes & pigments evolved into production of paints & coatings,
which till today, remains the core business of Berger.
Berger grew rapidly by establishing branches all over the world and through merging with other
leading paint & coating companies. Today,
Berger is one of the leading companies in the global paint industry
Berger offers all kinds of painting solutions in decorative, industrial or marine segment for
both decorative and protective purpose.
4. Berger Paints started its sailing into the sea of Bangladesh from pre-liberation era, to be precise
in 1950. The main business flourished in the post liberation phase. In Bangladesh the major
milestones of Berger Paints are given below:
1950 – Started operation in Bangladesh by importing Paint from Berger UK
1970 - Establishment of Chittagong Factory
1980 – Named as Berger Paints (BD) Ltd. from Jenson & Nicholson (J&N)
1991 – BMRE in Chittagong Factory
1995 – Establishment of Double Tight Can Manufacturing Plant
1999 – Establishment of Most Modern Sate-of-the-Art Paint Production Plant in Dhaka
2002 - Construction of own building for the Corporate Office in Dhaka
2004 – Establishment of Powder Coating Plant
2.1.2 Berger Paints Bangladesh Ltd: At a Glance
Own Corporate Office located in Dhaka
Two Factories at Dhaka and Chittagong
Seven strategically located Sales Offices throughout the whole country. The locations of the
Sales Offices are shown in a map attached in the annexure
A wide distribution channel reaches the whole country with a network of almost 1000 dealers
Vision and Mission of the company
The vision and mission of Berger Paints Bangladesh Ltd. (BPBL) is very transparent and
tangible. Berger emphasize highly on the ethical commitment to produce benchmark quality
product. The vision and mission statement of the company is:
Vision
“We shall remain as the benchmark in the Paint industry by:
Being an innovative and technology driven Company consistently delivering world-class
products ensuring best consumer satisfaction through continuous value added services provided
by highly professional and committed team.”
Mission
“We shall increase our turnover by 100% in the next five years.
We shall remain socially committed ethical Company.”
2.1.3 Area of Operation
Berger Paints operates in three broad segments of the paint industry.
Decorative Paint
The objective is to beautify the surfaces with protection from corrosion and erosion
This business category mainly targets household segment
Products are being offered to the consumers through a dealer network
Products fulfill the aesthetic value of the consumer
Major revenue earning business area of BPBL
Industrial
5. Tailor made products to cater to the specific needs of customers
Products give protection to the surfaces in extreme situations like severe
Hazardous environment, high temperature, movement of heavy materials and machinery etc.
Direct marketing approach is being used to promote the Industrial Coatings
Main customer groups: Garments Factories, Chemical Plants, Fertilizer Manufacturing Plants,
Consumer Durable Manufacturing Plants etc.
Marine
Products are being offered mainly through Direct marketing approach.
Dock Yards, Bangladesh Navy, Passenger Ships are the main user groups.
Market is mostly concentrated in Dhaka and Chittagong.
2.1.4 Manpower Structure
It is consisted of more than 300 employees of whom about 160 are general workers and the rest
are White Collar employees. These employees are working in different factories and depots of
the company.
2.1.5 The company profile
1. Origin : United Kingdom
2. Registered Office : 43/3, Chatteswari Road
Chittagong – 4000, Bangladesh.
Email: bergerbd@spnetctg.com
Web: http//www.bergerbd.com
3. Corporate Headquarter : Berger House
Plot – 8, Road No.-2
Uttara Sector –3, Uttara Model Town
Email: info@bergerbd.com
Web: http//www.bergerbd.com
4. Factory : Dhaka Factory - Nabinagar,
Chittagong Factory – 27 D, FIDC Road
Kalurghat, Chittagong
5. Plant : Powder coating plant – Nabinagar, Savar
: Emulsion plant - Nabinagar, Savar,
6. Home décor : Bonani, Dhaka
: E–mail: décor@bergerbd.com
7. Sales office : Dhaka – 3/3-D Bijoynagar Kakrail
Chittagong - 43/3, Chatteswari road
Sylhet– H # 32, Block – A, Shahjalal Upashahar
Khulna – 2 KDA Approach Road, Sonadanga.
Bogra – 31, Piari Sanker, Katnar Para
Comilla – 576, Laksham road
Rajshahi - 1458, Ramchandrapur Ghoramara,
Boalia
6. 8. Subsidiary Company : Jenson & Nicholson (Bangladesh) Limited
: 70, East Nasirabad I/A
: Baizid Bostami Road.
9. Date of Incorporation : 6th
July, 1973
10. Commercial Production : 1973
11. Business Line :
Manufacturing and Marketing of High Quality
Paints
12. Nature of Business Activities :
The principal activities of the company
throughout the year continued to be
manufacturing and marketing of liquid and
non-liquid paints & varnishes and coating.
13. Status : Public Limited Company
(Enlisted in both Dhaka and Chittagong Stock
Exchange)
14. Position in the Industry : 1st
15. Percentage of Market Share : 51%
16. Special Achievement : ISO 9001: 2000
2.1.6 Focus of BPBL
Berger Paints Bangladesh Limited focuses on the following things:
Commitment to achieve total customer satisfaction.
Commitment to project the company as an ethical and socially responsible one.
Commitment to continue as the market leader through consistent sales growth, increasing
productivity and developing new products befitting customer needs.
Ensuring continuous improvement in operations through utilization of highly professionals
and dedicated team, proper process management and participation of the stakeholders.
Setting measurable targets at appropriate stages and continuously monitoring them.
2.1.7 Market Share Analysis
At present Bangladesh paints industry has 6 companies who have significant market share.
Berger Paints Bangladesh Ltd. is operating as the market leader and enjoying almost 45% of
national paint market share. The nearest competitor is Sagar Chemical and Paint Industry Ltd.
who resides far below the market leader in aspect of market share.
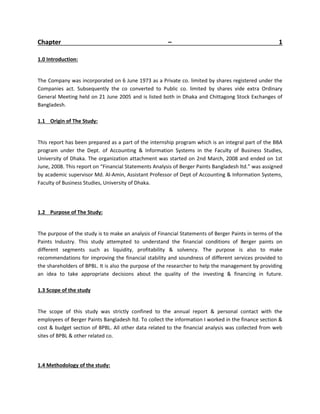
The following Table shows the present market share of different companies in paint industry of
Bangladesh:
Companies Market Share
BPBL 44.7%
Sagar Chemical and Paint Ind. Ltd. 13.6%
Elite 6.8%
Asian 4.2%
Pailac 5.9%
Roxy 4.8%
7. Moon Star Paint Chemical Ind.
3.7%
Others 16.3%
Total 100%
Figure 3: Market share of different companies
The Table shows that Sagar Chemical and Paint Industry Ltd, who are mostly known a Romana
Paints manufacturer, enjoying a market share of 13.6% and Elite Paint’s market share is 6.8%. A
very mentionable point about the national market share of different companies is, recently the
market share of the local companies are declining whereas the market share of Berger Paints
Bangladesh Ltd. is increasing. Added here, very recently
giant India based multinational paint company ‘ Asian Paints’ has entered into this market under
joint venture investment with Confidence cement Inc Ltd. Another local company ‘Aqua’ has
launched recently. Asian Paints’ market share in 2004 is 4.2%. Though the share is not very high
but being new entrant their growth is significant. The market shares of the major paint category
are given below:
2.1.7.1 Gloss Coatings Market share
Gloss coating category paints are solvent based paints. This is the major segment of the total
paint industry. It contributes almost 42% of the total decorative paint. Here also the major player
is the market leader of the paint industry Berger Paints Bangladesh Ltd.
The market scenario of the gloss coatings is:
2.1.8 Distribution Coverage Analysis – Major Companies
The distribution reach of the company is set basically on the three broad categories: Urban, Semi
Urban and Rural. The distribution reach is determined without considering. In all the three
categories Berger the market leader still is maintaining more than 50% distribution coverage.
The standing of the major companies on the basis of the distribution reach is given below:
Company
Distribution Reach %
Urban Semi
Urban
Rural National
Berger Paints Bangladesh
Limited
65.9 62.4 54.9 63.2
Sagar Chemical & Paint
Industries Ltd
56.3 61.8 56.0 57.2
Roxy Paints Limited 39.6 40.0 32.1 38.3
Pailac Paint & Chemical Company
(PVT) Ltd.
33.2 35.2 37.0 34.2
Elite Paint & Chemical Industries
Limited
37.4 28.5 15.2 31.6
8. 2.2.1 Preparing Marketing Mix
Market Segmentation
For segmenting total paint market, Berger uses more than one basis. Initially, total business of
the Co. is segmented on the basis of customer types. Berger segments total market as Decorative,
Industrial & Marine. Then, Decorative group is further segmented on the basis of surface types-
wooden, metal & concrete. Again, sub-class of the total paint market is sliced on the basis of
Internal & External surface category. At the last step, price segmentation is used to create a
number of small niches– Premium, Regular & Economy- in the market.
Product
Berger is committed to offer quality products that satisfy consumers’ ultimate desires from paints
with the help of state-of–art technology. Berger always believes in one step ahead in offering
new product to create more value for customers’ money. Berger outsmarts other competitors of
the market through its one step ahead policy and innovative market offers. Berger is trying to fill
up all holes of the market through offering a wide range of products to meet the needs (Premium
to Economy Paints) of different types of users and to solve the different types of functional
requirements (Industrial, Decorative & Marine). Berger Bangladesh offers approximately 600
SKU including variations within basic product groups. Due to shift in market growth trends
Berger is trying to establish itself in the economy segment of the paint market.
Price
Generally Berger follows cost based pricing method. After calculation of the total manufacturing
cost (Direct & Indirect RM cost, Direct & Indirect Labor cost and Manufacturing overhead cost)
and adds 20% GP to get the price point of the product. But this is not the rule of thumb in pricing
the Berger products. Competitor based pricing policy is also followed as well because of the
increased competition in the paint market.
Place/Distribution
Berger follows the direct distribution policy to make the paints available in the market. Berger
distributes paints through its own sales force. Distribution activities of Berger in all over
Bangladesh are covered by 7 (Seven) strategic depots. *One level, mainly, and*two level-
channel, to some cases, are used by the Berger Paints for Decorative products. Zero level
channels, personal selling, are also used for grasping the project offers.
In one level channel, Berger’s sales force delivers paints to the dealers from where ultimate users
purchase paints. In the two-level channel, some major dealers dominate the paint market in the
region where they are located. Small dealers collect paints from the large-scale dealers. Ultimate
users buy paints from these small dealers.
9. 2.2.2 Promotion/Communication Mix
Electronic media: Paints of Berger are promoted in the market through electronic media mainly
in BTV and Cable Channels. Through these ads not only the overall Berger products are offered
but also the individual brands are promoted. Through radio Berger is trying to reach those
potential targets that are not easily reachable by the BTV or Satellite.
Print Media: During daytime mostly in the office market potentials have little opportunity to go
through the electronic media. Rather, they are used to go through the newspapers, magazines and
other periodical publications. So Berger has taken the initiatives to attract people’s attention
through print media to some extent. Moreover, brochures, shade cards and other paint related
information in printed form are delivered to the dealers, potential customers, painters and other
targeted potentials to make them interested /more interested toward Berger products.
Billboard: Berger efforts also move to grasp the potentials’ attention and to increase the
frequency of exposure toward Berger products while they are on the way to their destinations.
Sales Promotion
Berger offers different types of incentives for consumers and traders of the paint market. Trade
promotion occurs more frequently than consumer promotion. Because, success in this market
highly depend on the traders involved channeling the paints from producers to consumers.
Traders are highly influential in the market because of long purchase cycle time (app. 3 years) of
paints, technical aspects of the paints & etc. Shop boys are also included within the discursion of
traders. Moreover, painters, end user of paint, play important roles in purchase decision of the
paint. So, Berger offers incentive to create a favorable attitude towards the paints of Berger.
2.2.3 COLOR BANK AT A GLANCE
Berger Color Bank introduces the global way to paint with an unlimited choice of shades to
match customers’ taste-instantly. Color Bank is a new venture of Berger Paints started by Mr. R.
R. Khan, Décor manager of Berger Paints Home Décor, in 1997. The basic concept behind
launching Color Bank was to reduce SKU’s and provide a variety of shades. Berger Color Bank
can provide any shade, from a dark color to light colors in just 5 minutes.
Berger Color Bank uses superior imported colorants and the world renowned tinting technology
of Italtinto, Italy. Berger Color Bank has unique Tintovision software which allows customers to
see infinite color combinations on the screen of the computer. Products of Color Bank includes:
Robbialac Plastic Emulsion Classic
Robbialac SPD Super
Weather Coat Smooth Classic
10. Robbialac Synthetic Enamel Gold
Luxury Silk Splendor
Robbialac Easy Clean
Robbialac Pearl Lustre Finish
Woodkeeper Finesse
Chapter -3
3.1 SWOT Analysis
A scan of the internal and external environment is an important part of the strategic planning
process. Environmental factors internal to the firm usually can be classified as strengths (S) or
weaknesses (W), and those external to the firm can be classified as opportunities (O) or threats
(T). Such an analysis of the strategic environment is referred to as a SWOT analysis.
The SWOT analysis provides information that is helpful in matching the firm's resources and
capabilities to the competitive environment in which it operates. As such, it is instrumental in
strategy formulation and selection.
Strengths
BPBL’s strengths are its resources and capabilities that can be used as a basis for developing a
competitive advantage. Examples of such strengths include:
Strong brand names
Good reputation among customers
Cost advantages from proprietary know-how
Exclusive access to high grade natural resources
Favorable access to distribution networks
Weaknesses
The absence of certain strengths may be viewed as a weakness. For example, each of the
following may be considered weaknesses:
High cost structure
Lack of access to the best natural resources
Lack of access to key distribution channels
High cost for importing raw materials
In some cases, a weakness may be the flip side of strength. Take the case in which a firm has a
large amount of manufacturing capacity. While this capacity may be considered a strength that
competitors do not share, it also may be a considered a weakness if the large investment in
manufacturing capacity prevents the firm from reacting quickly to changes in the strategic
environment.
Opportunities
The external environmental analysis may reveal certain new opportunities for profit and growth.
11. Some examples of such opportunities include:
An unfulfilled customer need in some cases
Arrival of new technologies
Loosening of regulations
Removal of international trade barriers
A developing market such as the Internet.
Mergers, joint ventures or strategic alliances.
Moving into new market segments that offer improved profits.
A new international market.
A market vacated by an ineffective competitor
Threats
Changes in the external environmental also may present threats to the firm. Some examples of
such threats include:
Shifts in consumer tastes away from the firm's products
Emergence of substitute products
New regulations
Increased trade barriers
A new competitor in your home market.
Price wars with competitors.
A competitor has a new, innovative product or service.
Competitors have superior access to channels of distribution.
Taxation is introduced on your product or service.
The SWOT Matrix
A firm should not necessarily pursue the more lucrative opportunities. Rather, it may have a
better chance at developing a competitive advantage by identifying a fit between the firm's
strengths and upcoming opportunities. In some cases, the firm can overcome a weakness in order
to prepare itself to pursue a compelling opportunity.
To develop strategies that take into account the SWOT profile, a matrix of these factors can be
constructed. The SWOT matrix (also known as a TOWS Matrix) is shown below:
Strengths Weaknesses
Opportunities S-O strategies W-O strategies
Threats S-T strategies W-T strategies
S-O strategies pursue opportunities that are a good fit to the company's strengths.
12. W-O strategies overcome weaknesses to pursue opportunities.
S-T strategies identify ways that the firm can use its strengths to reduce its vulnerability
to external threats.
W-T strategies establish a defensive plan to prevent the firm's weaknesses from making
it highly susceptible to external threats.
Chapter - 4
4.1 Company Analysis
4.1.1 Steps in Analyzing Financial Statement
Financial Statements analysis is oriented toward achieving specific objectives.
Step 1- The first step is to explicitly define the analysis objectives.
Step 2- The second step in analysis is to formulate specific questions and criteria consistent with
the analysis objectives.
Step 3- The third step an analysis is identifying the most effective and efficient tools of analysis.
Step4- The fourth step in analysis of Berger Paints Bangladesh Limited is interpreting the
evidence.
4.1.2 Building Blocks of Financial Statement Analysis
This analysis emphasizes six areas of inquiry with varying degrees of importance. They are
considered “Building Blocks” of financial statements.
A. Short-term Liquidity
1. Current ratio
2. Quick ratio
3. Inventory turnover ratio
4. Inventory to sales
5. Average collection period
B. Cash Flow and Forecasting
C. Capital Structure and Solvency
1. Debt ratio
2. Debt equity ratio
D.Return on Invested Capital
1. Retern on asset
2. Return on equity
3. Price Earning ratio
13. 4. Earngings per share
5. Dividend per share
6. Dividend payout ratio
7. Market to book value
E. Asset Turnover
1. Total asset turnover
F. Operating Performance and Profitability
1. Gross profit ratio
2. Net profit ratio
Comparative Financial Statements
Most depressing in BPBL is the decrease in net profit ratio over the last five years in 2002 the
rate was 18.62%, in 2003 17.53%, in 2004 12.46%, in 2005 11.77% and in 2006 10.93%.
Return on assets shows an increasing trend in the last five years consecutively 25.10% in 2002,
27.84% in 2003, 30.88 in 2004, 25.10% in 2005 and 34.21% in 2006.
Short-term Liquidity
Various measures for short-term liquidity are calculated for the most recent years. Current
liabilities show no trend over the five years while current assets increased in the last five years
except 2005. In 2006 current assets decreased 9.25% substantially and current liabilities
decreased 7.14% in 2004. As a result, except 2006 current ratio decreased from 2002 to 2005
like 1.85, 1.76, 1.60, 1.57, and 1.62 respectively.
BPBL’s quick ratio for the year 2005 and 2006 is below 1.00 that is 0.77 and 0.99 which does
not comprise with standard value. Also the ratio for the year 2002, 2003, 2004 shows a reducing
trend like 1.42, 1.31, and 1.09. Statement of Financial Ratios reveals that inventories comprise a
lower proportion of total assets 23% and total current assets 335. Also, inventory turnover for
BPBL is 4.48, 5.02, 5.95, 7.27 and 9.84 times respectively in the year 2002, 2003, 2004, 2005
and 2006.
Inventory turnover ratio:
The Inventory Turnover and Days' Inventory Ratios measure the firm's management of its
Inventory. In general, a higher Inventory Turnover Ratio is indicative of better performance
since this indicates that the firm's inventories are being sold more quickly.
Here BPBL last 5 years inventory turnover ratio increasing gradually but last 2 years turnover is
moderately fast growing which means BPBL collection of sales of inventory is moderately
close to 10-8 times per day.
Inventory
turnover ratio 15.92 11.49 8.61 7.07 6.38
Year 2006 2005 2004 2003 2002
This indicates that inventory is easily turning into sales year after year. This improvement in
14. inventory management is con-current with BPBL’s launching Just-in-Time inventory system.
Statement of financial ratios reports shows an escalating trend in raw materials inventory
turnover 3.66, 4.14, 5.20, 7.39 and 10.00 times , in WIP turnover 25.95, 28.77, 35.03, 46.71 and
64.72 times in the year 2002, 2003, 2004, 2005 and 2006.
BPBL’s debtors’ turnover has been decreasing over the past five years. But trade and other
receivables are growing faster than sales, so this is suggestive of a more aggressive credit policy.
Debtors to sales ratio for the year 2003, 2004, 2005 and 2006 is 12.22%, 11.54%, 9.81% and
8.40% The collection period for accounts receivable are going down but the conversion period
takes less time. Average collection period shows a declining trend 44.62, 42.11, 35.81 and 30.65
days in the year 2003, 2004, 2005 and 2006 implies positive in company’s viewpoint.
BPBL’s success in managing current liabilities varies. In 2006 current liabilities decreased but
the amount is lower than current assets. There is a huge gap and the ratio through out the year
does not match with benchmark.
Cash Flow Analysis and Forecasting
Cash Flow analysis of BPBL has two primary objectives.
Analyze the statement of cash flows to assess cash flows (solvency) and to identify cash flows
patterns.
Extend the analysis of static measures of short-term liquidity to include cash forecasting.
The analysis begins with cash flows from operations. BPBL reports cash flows using direct
method and we want to recast these to be more relevant inflow-outflow format. Results of these
recasting are varying and are growing source of cash with a substantial increase in 2006 than
2005 which is Tk. 363,100,000 and Tk. 58,178,000 respectively.
The cash downturn in the year 2005 is due to increase in cash paid to suppliers and employees,
so there was a decrease in cash generated from operations Tk. 197,901,000 in 2005 but Tk.
472,468,000 in 2006 and Tk. 424,296,000 in 2004. The increase in cash paid to suppliers and
employees for the cost of consumption of materials, materials purchase-cost and direct charges.
This is because the decrease in net income continued in 2004 because the downturn is from
restructuring and divesture charges having no immediate cash flows effects.
The analysis of operating cash flows reveals an increasing trend through 2003 and 2004.
Outflows decline mainly due to a decrease in cost of products sold. There is also evidence in
2006 of improvements in cash flows due to a increase in cash receipts from customers is Tk.
2,510,221,000. Still BPBL ha successfully translated growing sales and increasing larger
margins into steady growth in operating cash flows.
BPBL’s statement of cash flows for five years ending with 2006 reveals several patterns in the
15. company’s cash flows over these five years. Transitory fluctuations in cash such as, those due to
the high usage of cash for investing activities in 2006 Tk. 158,830,000, in 2005 Tk. 38,077,000,
in 2004 Tk. 88,713,000, in 2003 Tk. 39,938,000 are put in perspective by including aggregate
figures in total column.
Capital Structure and Solvency
BPBL’s capital structure and solvency reveals, for analytical purpose, deferred tax liabilities and
retirement benefit obligation are deferred liabilities. Liabilities to assets ratios are 38.80%,
46.20%, 43.31%, 42.10% and 39.80% in 2006, 2005, 2004, 2003 and 2002 respectively. For
BPBL, this ratio does not differ markedly from its unadjusted counterpart. These measures
suggest that BPBL is moving away from its historical conservative capital structure toward a
more aggressive one. This is corroborated by a lower level of fixed charge coverage ratios using
both earnings and operating cash flows. The company’s creditors enjoy sound asset protection
and superior earning power.
Debt ratio:
BPBL debt ratio gradually increasing from 2002-2004 but after 2004 it reduces 27% in 2005
&10% in 2006 that means BPBL use less amount of debt to finance its asset which was higher
in2002-2004.
Debt
ratio 5.88 6.48 8.89 5.95 4.96
year 2006 2005 2004 2003 2002
Debt-equity ratio for BPBL for the year 2002, 2003, 2004, 2005 and 2006 is 3.55%, 4.19%,
6.21%, 4.43% and 4.24% shows that Berger Paints is trying to lessen its dependability on debt
abruptly. Moreover, capital to net worth is relatively stable over five years 0.72, 0.70, 0.70, 0.68
and 0.72.
Return on Invested Capital
The returns on invested capital retios for BPBL reveal several insights. The return on assets
(ROA) is increasing except 2005 like 25.10%, 27.84%, 30.88%, 25.10% and 34.21% in the year
2002, 2003, 2004, 2005 and 2006 respectively. BPBL’s management hopes these improvements
for the year is reflective of its major restructurings. Because of these restructuring programs and
cost cutting efforts, profit margins are higher. Those things are now divested and BPBL has
streamlines and modernized its manufacturing.
BPBL’s return on equity is 221.01%, 233.17%, 98.25%, 107.665 and 135.34% in the year 2002,
2003, 2004, 2005 and 2006. The source of improvement is due to a solid net income margin and
leverage ratio. Like the profit component in ROA, the improved net income margin is likely
benefits from write-offs. Disaggregating BPBL’s ROE shows changes in net income margin are
primarily responsible for fluctuations in ROE in 2004.
Price Earning ratio:
The P/E Ratio indicates how much investors are willing to pay per dollar of current earnings. As
such, high P/E Ratios are associated with growth stocks.
16. BPBL last years P/E ratio is very much high than previous year that means after listing co its
investors are willing to pay high price because of increasing demand & satisfactory co.
performance.
P/E ratio 11.76 1.11
year 2006 2005
Earnings per share (EPS) for the five years are consecutively Tk. 4.79. Tk. 233.17, Tk. 196.51,
Tk. 113.33 and Tk. 13.53 for the year 2002, 2003, 2004, 2005 and 2006.
Dividend per share (DPS) for the five years are consecutively Tk. 4.79., Tk. 155.00, Tk. 220.00
and Tk. 160.12 and Tk. 10.00 for the year 2002, 2003, 2004, 2005 and 2006.
Dividend Payout ratio for BPBL was quite impressive throughout the last five years. As in the
year 2004 BPBL came in the stock market, so the last to years was very important to the
shareholders. Dividend per share (DPS) for the five years are consecutively 70.13%, 94.35%,
162.97%, 132.36% and 73.89% for the year 2002, 2003, 2004, 2005 and 2006.
Market to book value ratio:
The Market-to-Book Ratio relates the firm's market value per share to its book value per share.
Since a firm's book value reflects historical cost accounting, this ratio indicates management's
success in creating value for its stockholders. This ratio is used by "value-based investors" to
help to identify undervalued stocks.
BPBL last two years market to book value per share decreasing .52% but this is very slow rate of
decreasing, although its market value per share is very high than its book value which is almost
285181.71%
Market to book value
283697.09% 285181.71%
year 2006 2005
Analysis of Asset Utilization
BPBL’s asset utilization measures are relatively stable for the past five years. Yet this stability in
asset turnover makes significant changes in turnover for individual asset components. Variability
in cash and cash equivalents evidence the most in both the sales to working capital turnover.
The continuous improvement is held by decrease in receivables. Regarding inventory turnover,
BPBL’s expressed desire to decrease inventories at every stage of its manufacturing process
reveals itself through improved finished goods inventory turnover.
In each of the five years current assets are being used more effectively and efficiently. Current
asset turnover shows an upward trend like 1.53, 1.63, 2.13, 2.20 and 3.51 times from 2002 to
17. 2006. Total asset turnover also shows a continuation of that trend like 1.13, 1.21, 1.47, 1.59 and
2.20 times in those five years.
Net current asset turnover, fixed asset turnover and net assets turnover for the year shows an
increasing trend too.
Ratios 2006 2005 2004 2003 2002
Net Current Assets Turnover 7.38 4.86 4.25 3.18 2.91
Fixed Assets Turnover 5.94 5.83 4.77 4.71 4.29
Net Assets Turnover 3.61 2.97 2.60 2.09 1.88
Analysis of Operating Performance and Profitability
We can see that BPBL’s gross profit margin for the year 2002, 2003, 2004, 20052 and 2006 is
40.87%, 41.49%, 39.22%, 34.37% and 32.85% implies an downward trend because though the
gross profit increased over the five year period but growth rate was relatively slow than sales.
However, net profit margin is slightly below every year than the previous year like 18.62%,
17.53%, 12.46%, 11.77% and 10.93 in the year 2002 to 2006. But operating expenses shows a
decrease in the year 2006 and 2005.Continued cost control should allow BPBL to further
improve profitability and exceed desired level.
Comparison to not same line of business:
BPBL has a moderate level of current ratio in comparison with other companies which are
actually not in the same line of business but import raw materials from abroad.
BPBL’s quick ratio is slightly below than Square Pharma and Beximco Pharma but ha sufficient
quick assets to meet up quick liabilities.
BPBL’s debtors’ turnover is pretty much higher than most of the comparing companies except
Square Pharma.
Historically BPBL has a low dependency on debt. Here in the graph, we can notice that Berger’s
debt with respect to capital is relatively low.
Berger’s total asset turnover is the highest than other companies that means that BPBL is using
its total asset most efficiently.
Berger’s gross margin ratio is also satisfactory because BPBL ha succeeded in the last few years
to manage the materials cost effectively.
18. Here it can be said that Berger has a large administrative and selling cost, so though it has a high
gross profit margin, it has a lower profitability with respect to net profit margin ratio.
Berger’s return on investment (ROI) is the highest among the six companies, it has secured
24.98% and the nearest company’s rate is 13.08%.
Like ROI, Berger has the highest Return on Equity (ROE) which is 135.34% that means BPBL is
utilizing the funds provided by the shareholders properly.
In the case of Return on Assets (ROA), BPBL continues to be the fore-runner among six
companies. It has the highest ROA 34.21% which gives an indication of efficient use of assets
and earn handsome on assets.
Berger has high Earnings per Share (EPS) and it is also a comprehensive indicator of a form’s
performance in the perspective of shareholders.
Berger’s Price Earnings Ratio is roughly the same like ACI, Square Pharma and Beximco
Pharma.
Compare to other paint industries:
When we compare BPBL’s current ratio with Five other giant paint companies around the world,
we can see that Berger has a satisfactory level of short-term assets to repay the current liabilities.
As Berger has a tight management of operating working capital, its quick ratio is below 1.00.
Moreover BPBL has to keep a large volume of inventories. So quick ratio is low.
BPBL’s debt equity shows that it is primarily relying on non-interest bearing liabilities such as
accounts payable and accrued expenses to finance the operations.
Berger assets better asset utilization ratios relative to other five paint companies. BPBL has an
addition of Property, plant and equipment in the year 2006.
In some case, we see that the price premium of BPBL’S products can command is influenced by
the degree of competition and the extent to ehich its products are unique.
Since Berger has a large selling, general, and adminatrative (SG&A) expenses, its net profit is
low. But other paint companies have the profit margin which is near the BPBl’s value. Moreover,
Berger attempts to preserve its brand imafe and distribute its products through full service
19. retailers and provide Home-Decor service.
Berger’s Return on Investment (ROI) implies that the company is able to generate sufficient
profit for each dollar which is the highest among six comapnies.
Berger is second highest Return on capital generator which provides an indication of employing
the funds invested by the firms shareholders.
Return on Assets (ROA) measures BPBl is able to deploy its assets to generate profits. Berger
has the highest return on assets in comparision with Asian Paints, Kansai Paints, Orica Limited,
AB Wilh Baker Company and Sherwin-Williams company.
Dividend payout ratio is a measure of its dividend policy. By paying a high dividend Berger
proves that it has a high amount of dividend ni excess of its operating and investment needs.
Findings & Recommendations
Liquidity:
The cash flow analysis reveals that BPBL has been enjoying good cash flow position. Its operating cash
flow stood as tk.363.1 million, tk.58.17 million, tk.309.55 million, tk.268.97 million & tk.315.523 million
in the year 2006 to 2002 respectively. The cash downturn in the year 2005 is due to increase in cash paid
to suppliers & employees.
The liquidity position of BPBL is acceptable. Its current ratio stood as 1.62 times, 1.57 tines, 1.6 times,
1.76 times & 1.85 times in the 2006 to 2002 year respectively. In 2006 current asset decreased 9.25% &
current liabilities decreased 7.14%. As a result except 2006 current ratio decreased from year 2006 to
2002.The quick ratio stood at 77.17%, 99.57%, 109.485%, 131.49% & 142.91% in the year 2006 to 2002
respectively. So BPBL quick ratio for the year 2006 & 2005 is bellow 1 that does not comprise standard
value. .Also the ratio for the year 2004, 2003, 2002 shows reducing trend like 1.42, 1.31, and 1.09.
The required time to sales inventories in the last year is around 23 days which was 57 days in the year
2002. Its efficiency in the collection periods of receivables is increasing in 2006 due to well channel of
distributions. BPBL average collection period is 30.65 days, 35.81 days, 42.11 days, 44.62 days & 43.19
days in the year 2006 to 2002.
Financial Solvency & Flexibility:
The solvency dimension of BPBL is strong. The company has no long term debt Its interest coverage ratio
stood at 40.66 times, 19.24 times, 102.04 times, 93.96 times & 142.04 times in the year 2006 to 2002.
The operational cash flow stood at tk.363.1 million, tk.58.17 million, tk.309.55 million, tk.268.97 million
& tk.315.523 million in the year 2006 to 2002 respectively. Its operating cash flow stood at 21%, 14.785,
33.88%, 21.33% & 12.57% of total debt during the same period.
20. BPBL total debt to equity ratio stood at 4.24, 4.43, 6.21, 4.19 & 3.55 times in the year 2006 to 20025. In
the year 2003 its debt to equity ratio was higher than others but in the recent year it is satisfactory level.
The market value per share of tk10 is almost tk.350 in the recent year.
Performance:
The operating performance of BPBL is good although its profitability parameters are in decreasing trend.
Its sales revenue stood at tk.2872.4 million, tk.2221.12 million, tk.1737.63 million, tk.1465.26 million &
tk.1307.67 million in the year 2006 to 2002 respectively on an accepting limit.
The gross profit margin of BPBL is around 32.85% in 2006 which is lower than previous four years but it
is acceptable due to increase of raw materials price & giving higher discount. BPBL total asset turnover
stood at 2.20 times, 1.59 times, 1.47 times, 1.21 times & 1.13 times in the year 2006 to 2002 shows an
increasing trend of turnover.
Not same line of business:
Compare to other industries not same line of business, BPBL current ratio and net profit margin is
moderate but its debtors turnover and total asset turnover is well than others. BPBL quick ratio is not
satisfactory than others which is lower than 1. In the case of Return on Assets (ROA), BPBL continues to
be the fore-runner among six companies. It has the highest ROA 34.21% which gives an indication of
efficient use of assets and earn handsome on assets. Berger’s Price Earnings Ratio is roughly the same
like ACI, Square Pharma and Beximco Pharma.
Same line of business:
Compare to same line of business, BPBL current ratio is moderate but quick ratio is low. BPBL debt
equity shows primarily relying on non-interest bearing liabilities such as accounts payable & accrued
interest to finance the operations. Its gross profit margin is moderate level like 30% but its net profit is
low. Although other paint industries have the profit margin near BPBL. So, Berger attempts to preserve
its brand imafe and distribute its products through full service retailers and provide Home-Decor service.
Berger is second highest Return on capital generator which provides an indication of employing the
funds invested by the firms shareholders. Also Berger has the highest return on assets in comparision
with Asian Paints, Kansai Paints, Orica Limited, AB Wilh Baker Company and Sherwin-Williams company.
Conclusion
Berger Paints Bangladesh Limited claims that they control 65% of local paint market because with its
strong distribution network, Berger ha reached almost every corner of Bangladesh. The nationwide
dealer network, supported by seven sales depots strategically located at Dhaka, Chittagong, Khulna,
Bogra, Rajshahi, Comilla and Sylet has enabled them to strategically cater to all parts of the country.
Berger also provides customer support connecting customers to technology through specialized Home
Decor service giving free technical advice on surface preparation, color consultancy, special color
schemes etc. To bolster customer satisfaction, Berger launched Illusion-the first designer paint solution.
21. By analyzing it can be said with certainty that if Berger can maintain the quality of paints and coatings, it
will be able to preserve the position of marker leader. The near competitor of Berger is far away from it.
Berger is showing an upward trend in every aspect of financial statements. Moreover, Berger has a little
amount of bank borrowing which gives its investors the great dependability upon the company.
Berger’s profit after tax has a clear indication of its financial viability. Berger is also contributing a lot in
the national economy by paying a huge value added tax (VAT). Berger Paints Bangladesh Limited won
the ICAB national Award as best published Accounts and reports in the manufacturing category in the
year 2005 and 2006. With the support of the country’s eminent artists and the enthusiastic participation
of young neophytes, Berger gives Berger Young Painters’ Competition Award.
Bibliography
Annual Report of AB Wilh Baker(2006)
Annual Report of Advanced Chemical Industries (2005,2006)
Annual Report of Asian Paints (2006)
Annual Report of Berger Paints Bangladesh Limited (2002,2003,2004,2005,2006)
Annual Report of Beximco Pharmaceuticals Bangladesh Limited(2005,2006)
Annual Report of GlaxoSmithkline Bangladesh Limited(2005,2006)
Annual Report of Kansai Paints(2006)
Annual Report of Orica Limited(2006)
Annual Report of Square Pharmaceutical Bangladesh Limited(2005,2006)
Annual Report of Singer Bangladesh Limited(2005,2006)
Annual Report of Sherwin-Williams(2006)
Business Analysis and Valuation, 2nd Edition, by Krishna G. Palepu, Paul M. Healy and Victor L.
Bernard
Financial Reporting, Financial Statement Analysis, and Valuation: A Strategic Perspective by Clyde P.
Stickney, Paul Brown , James M. Wahlen
Financial Statement Analysis: A Practitioner's Guide by Martin Fridson, Fernando Alvarez, Martin S.
Fridson
The Interpretation of Financial Statements (Hardcover), by Benjamin Graham, Spencer B. Meredith.
www.aci-bd.com
www.asianpaints.com
www.becker-acroma.com
www.beximco-pharma.com
http://www.bergerbd.com
www.gsk.com/worldwide/bd
www.kansai.co.jp
www.orica.com
www.sherwin-williams.co
www.singerbd.com