SlideShare une entreprise Scribd logo
1  sur  2
Télécharger pour lire hors ligne
Englewood Area Board of Realtors®
Multiple Listing One Month Sales and Inventory Report - November 1 to November 30, 2016
Price Range Sold Units Market Share
Average List
Price
Average Sale
Price % List to Sell Avg DOM
Inventory on
Market
Months
Supply
$1 - 49,999 0 0.00% 0 0 0.00% 1
$50,000 - 59,999 2 1.21% 71,950 51,000 71.00% 152 0 0.0
$60,000 - 69,999 2 1.21% 66,950 64,750 97.00% 45 4 2.0
$70,000 - 79,999 1 0.61% 79,900 76,500 96.00% 39 3 3.0
$80,000 - 89,999 2 1.21% 91,900 86,000 94.00% 7 8 4.0
$90,000 - 99,999 7 4.24% 96,800 93,057 96.00% 103 6 0.9
$100,000 - 119,999 5 3.03% 104,560 103,600 99.00% 70 10 2.0
$120,000 - 139,999 22 13.33% 132,359 127,632 96.00% 48 33 1.5
$140,000 - 159,999 13 7.88% 157,900 150,623 95.00% 81 36 2.8
$160,000 - 179,999 18 10.91% 169,932 167,586 99.00% 73 56 3.1
$180,000 - 199,999 15 9.09% 194,933 188,327 97.00% 61 40 2.7
$200,000 - 249,999 22 13.33% 238,259 226,177 95.00% 137 124 5.6
$250,000 - 299,999 16 9.70% 284,644 277,575 98.00% 82 126 7.9
$300,000 - 349,999 12 7.27% 328,829 319,900 97.00% 97 84 7.0
$350,000 - 399,999 8 4.85% 384,961 369,561 96.00% 56 56 7.0
$400,000 - 499,999 13 7.88% 453,775 434,383 96.00% 129 90 6.9
$500,000 - 599,999 1 0.61% 545,000 510,000 94.00% 89 43 43.0
$600,000 - 699,999 0 0.00% 0 0 0.00% 31
$700,000 - 799,999 1 0.61% 814,900 785,000 96.00% 526 20 20.0
$800,000 - 899,999 1 0.61% 900,000 872,300 97.00% 0 17 17.0
$900,000 - 999,999 2 1.21% 1,069,000 902,500 84.00% 121 18 9.0
$1,000,000 - and over 2 1.21% 1,700,000 1,612,500 95.00% 111 91 45.5
Totals 165 100.00% 261,866 250,385 96.00% 88 897 5.4
This data represents all residential sales. Reported sales are dependent upon timeliness of sales and totality of information Reported by participants.
The data reflects only The sales published through My Florida Regional MLS and does not include all sales in The Reported areas.
Neither The Association/Board nor The MFRMLS is in any way responsible for its accuracy.
Source: My Florida Regional MLS 12/8/2016
Englewood Area Board of Realtors®
Multiple Listing YTD Sales and Inventory Report - January 1 to November 30, 2016
Price Range Sold Units Market Share
Average List
Price
Average Sale
Price % List to Sell Avg DOM
Inventory on
Market
Months
Supply
$1 - 49,999 16 0.75% 41,122 36,328 88.00% 57 1 0.7
$50,000 - 59,999 16 0.75% 62,944 55,011 87.00% 137 0 0.0
$60,000 - 69,999 29 1.36% 69,914 64,881 93.00% 54 4 1.5
$70,000 - 79,999 38 1.78% 79,845 74,663 94.00% 55 3 0.9
$80,000 - 89,999 49 2.29% 86,996 83,962 97.00% 42 8 1.8
$90,000 - 99,999 39 1.82% 98,661 93,246 95.00% 85 6 1.7
$100,000 - 119,999 98 4.59% 114,720 109,415 95.00% 61 10 1.1
$120,000 - 139,999 202 9.45% 134,533 129,668 96.00% 55 33 1.8
$140,000 - 159,999 166 7.77% 155,535 149,922 96.00% 58 36 2.4
$160,000 - 179,999 211 9.87% 173,895 168,517 97.00% 68 56 2.9
$180,000 - 199,999 132 6.18% 195,187 188,103 96.00% 80 40 3.3
$200,000 - 249,999 350 16.38% 234,206 224,815 96.00% 85 124 3.9
$250,000 - 299,999 252 11.79% 282,987 272,875 96.00% 101 126 5.5
$300,000 - 349,999 159 7.44% 335,364 322,252 96.00% 133 84 5.8
$350,000 - 399,999 99 4.63% 386,996 370,668 96.00% 118 56 6.2
$400,000 - 499,999 129 6.04% 458,367 438,622 96.00% 110 90 7.7
$500,000 - 599,999 24 1.12% 566,483 544,286 96.00% 68 43 19.7
$600,000 - 699,999 16 0.75% 668,404 645,560 97.00% 189 31 21.3
$700,000 - 799,999 19 0.89% 771,079 739,158 96.00% 137 20 11.6
$800,000 - 899,999 15 0.70% 888,193 855,853 96.00% 273 17 12.5
$900,000 - 999,999 21 0.98% 1,012,000 943,976 93.00% 152 18 9.4
$1,000,000 - and over 57 2.67% 2,292,789 2,184,423 95.00% 137 91 17.6
Totals 2,137 100.00% 304,064 291,388 96.00% 88 897 4.6
This data represents all residential sales. Reported sales are dependent upon timeliness of sales and totality of information Reported by participants.
The data reflects only The sales published through My Florida Regional MLS and does not include all sales in The Reported areas.
Neither The Association/Board nor The MFRMLS is in any way responsible for its accuracy.
Source: My Florida Regional MLS 12/8/2016

Contenu connexe

Tendances

TREB January 2017 Market Watch
TREB January 2017 Market WatchTREB January 2017 Market Watch
TREB January 2017 Market WatchMichelle Makos
 
Market watch jan 2019 frank yu oakville
Market watch jan 2019 frank yu oakvilleMarket watch jan 2019 frank yu oakville
Market watch jan 2019 frank yu oakvilleFrank Yu
 
Market Watch - September 2019
Market Watch - September 2019Market Watch - September 2019
Market Watch - September 2019Michelle Makos
 
Si t libenter shares
Si t libenter sharesSi t libenter shares
Si t libenter sharesTena Čačić
 
Webster Texas Homes Market Report - 1st Quarter 2013
Webster Texas Homes Market Report - 1st Quarter 2013Webster Texas Homes Market Report - 1st Quarter 2013
Webster Texas Homes Market Report - 1st Quarter 2013Jeff Bulman
 
League City Homes Market Report - 1st Quarter 2013
League City Homes Market Report - 1st Quarter 2013League City Homes Market Report - 1st Quarter 2013
League City Homes Market Report - 1st Quarter 2013Jeff Bulman
 
March 2016 Real Estate Market Figures
March 2016 Real Estate Market FiguresMarch 2016 Real Estate Market Figures
March 2016 Real Estate Market FiguresMichelle Makos
 

Tendances (9)

TREB January 2017 Market Watch
TREB January 2017 Market WatchTREB January 2017 Market Watch
TREB January 2017 Market Watch
 
Market watch jan 2019 frank yu oakville
Market watch jan 2019 frank yu oakvilleMarket watch jan 2019 frank yu oakville
Market watch jan 2019 frank yu oakville
 
Market Watch - September 2019
Market Watch - September 2019Market Watch - September 2019
Market Watch - September 2019
 
Si t libenter shares
Si t libenter sharesSi t libenter shares
Si t libenter shares
 
Mls stats nov 2011
Mls stats nov 2011Mls stats nov 2011
Mls stats nov 2011
 
Webster Texas Homes Market Report - 1st Quarter 2013
Webster Texas Homes Market Report - 1st Quarter 2013Webster Texas Homes Market Report - 1st Quarter 2013
Webster Texas Homes Market Report - 1st Quarter 2013
 
League City Homes Market Report - 1st Quarter 2013
League City Homes Market Report - 1st Quarter 2013League City Homes Market Report - 1st Quarter 2013
League City Homes Market Report - 1st Quarter 2013
 
April Stats
April StatsApril Stats
April Stats
 
March 2016 Real Estate Market Figures
March 2016 Real Estate Market FiguresMarch 2016 Real Estate Market Figures
March 2016 Real Estate Market Figures
 

En vedette

En vedette (15)

colegio tecnico sudamericano
colegio tecnico sudamericanocolegio tecnico sudamericano
colegio tecnico sudamericano
 
Scan
ScanScan
Scan
 
Flats in ahmedabad
Flats in ahmedabadFlats in ahmedabad
Flats in ahmedabad
 
Paisajes maravillosos del valle del cauca
Paisajes maravillosos del valle del caucaPaisajes maravillosos del valle del cauca
Paisajes maravillosos del valle del cauca
 
laux
lauxlaux
laux
 
HOLA ARTESANIAS
HOLA ARTESANIASHOLA ARTESANIAS
HOLA ARTESANIAS
 
What Were Their Faults
What Were Their FaultsWhat Were Their Faults
What Were Their Faults
 
Wedding Cake Staircase Red Oak
Wedding Cake Staircase Red OakWedding Cake Staircase Red Oak
Wedding Cake Staircase Red Oak
 
Big pose
Big pose  Big pose
Big pose
 
Math Assistance Center 2004
Math Assistance Center 2004Math Assistance Center 2004
Math Assistance Center 2004
 
fresh dr resume
fresh dr resumefresh dr resume
fresh dr resume
 
Los animales y su clasificación
Los animales y su clasificaciónLos animales y su clasificación
Los animales y su clasificación
 
Mediateka
MediatekaMediateka
Mediateka
 
Role of copper in our body
Role of copper in our bodyRole of copper in our body
Role of copper in our body
 
Folate
FolateFolate
Folate
 

Similaire à Englewood

Toronto Market Watch AUGUST 2016
Toronto Market Watch AUGUST 2016Toronto Market Watch AUGUST 2016
Toronto Market Watch AUGUST 2016Chaba Tamasi
 
TREB Market Watch - August 2016
TREB Market Watch - August 2016TREB Market Watch - August 2016
TREB Market Watch - August 2016Michelle Makos
 
TREB Market Watch for May 2016
TREB Market Watch for May 2016TREB Market Watch for May 2016
TREB Market Watch for May 2016Michelle Makos
 
Market Watch May 2016
Market Watch May 2016Market Watch May 2016
Market Watch May 2016Chaba Tamasi
 
Treb Market Watch - January 2016
Treb Market Watch - January 2016Treb Market Watch - January 2016
Treb Market Watch - January 2016Michelle Makos
 
Toronto Real Estate Board's MARKET WATCH - JANUARY 2017
Toronto Real Estate Board's MARKET WATCH - JANUARY 2017Toronto Real Estate Board's MARKET WATCH - JANUARY 2017
Toronto Real Estate Board's MARKET WATCH - JANUARY 2017Shawn Venasse
 
Toronto Real Estate Board's MARKET WATCH - JANUARY 2017
Toronto Real Estate Board's MARKET WATCH - JANUARY 2017Toronto Real Estate Board's MARKET WATCH - JANUARY 2017
Toronto Real Estate Board's MARKET WATCH - JANUARY 2017Shawn Venasse
 
Austin real estate inventory 7:1:2013
Austin real estate inventory 7:1:2013Austin real estate inventory 7:1:2013
Austin real estate inventory 7:1:2013austinhometeam
 
October Market Watch is Here !
October Market Watch is Here !October Market Watch is Here !
October Market Watch is Here !Michelle Makos
 
April 2016 Home Sales in Toronto and GTA
April 2016 Home Sales in Toronto and GTAApril 2016 Home Sales in Toronto and GTA
April 2016 Home Sales in Toronto and GTAMichelle Makos
 
TREB MARKET WATCH 2017
TREB MARKET WATCH 2017TREB MARKET WATCH 2017
TREB MARKET WATCH 2017Michelle Makos
 
March 2017 market watch
March 2017 market watchMarch 2017 market watch
March 2017 market watchMarc Fowles
 
March 2017 - TREB Market
March 2017 - TREB MarketMarch 2017 - TREB Market
March 2017 - TREB MarketMichelle Makos
 
Market Watch TORONTO 2015 SEPTEMBER
Market Watch TORONTO 2015 SEPTEMBERMarket Watch TORONTO 2015 SEPTEMBER
Market Watch TORONTO 2015 SEPTEMBERChaba Tamasi
 
Market Watch TORONTO 2015 OCTOBER
Market Watch TORONTO 2015 OCTOBERMarket Watch TORONTO 2015 OCTOBER
Market Watch TORONTO 2015 OCTOBERChaba Tamasi
 
January 2023 Okanagan Statistics with charts and graphs
January 2023 Okanagan Statistics with charts and graphsJanuary 2023 Okanagan Statistics with charts and graphs
January 2023 Okanagan Statistics with charts and graphsVickyAulakh1
 
Market Report for August 2017 - Residential Resale
Market Report for August 2017 - Residential ResaleMarket Report for August 2017 - Residential Resale
Market Report for August 2017 - Residential ResaleMichelle Makos
 
Central Okangan Monthly Statistics - February 2023.pdf
Central Okangan Monthly Statistics - February 2023.pdfCentral Okangan Monthly Statistics - February 2023.pdf
Central Okangan Monthly Statistics - February 2023.pdfVickyAulakh1
 
February 2017 Market Watch - JUST RELEASED
February 2017 Market Watch - JUST RELEASEDFebruary 2017 Market Watch - JUST RELEASED
February 2017 Market Watch - JUST RELEASEDMichelle Makos
 
The Okanagan Statistics Package January 2022
The Okanagan Statistics Package January 2022The Okanagan Statistics Package January 2022
The Okanagan Statistics Package January 2022VickyAulakh1
 

Similaire à Englewood (20)

Toronto Market Watch AUGUST 2016
Toronto Market Watch AUGUST 2016Toronto Market Watch AUGUST 2016
Toronto Market Watch AUGUST 2016
 
TREB Market Watch - August 2016
TREB Market Watch - August 2016TREB Market Watch - August 2016
TREB Market Watch - August 2016
 
TREB Market Watch for May 2016
TREB Market Watch for May 2016TREB Market Watch for May 2016
TREB Market Watch for May 2016
 
Market Watch May 2016
Market Watch May 2016Market Watch May 2016
Market Watch May 2016
 
Treb Market Watch - January 2016
Treb Market Watch - January 2016Treb Market Watch - January 2016
Treb Market Watch - January 2016
 
Toronto Real Estate Board's MARKET WATCH - JANUARY 2017
Toronto Real Estate Board's MARKET WATCH - JANUARY 2017Toronto Real Estate Board's MARKET WATCH - JANUARY 2017
Toronto Real Estate Board's MARKET WATCH - JANUARY 2017
 
Toronto Real Estate Board's MARKET WATCH - JANUARY 2017
Toronto Real Estate Board's MARKET WATCH - JANUARY 2017Toronto Real Estate Board's MARKET WATCH - JANUARY 2017
Toronto Real Estate Board's MARKET WATCH - JANUARY 2017
 
Austin real estate inventory 7:1:2013
Austin real estate inventory 7:1:2013Austin real estate inventory 7:1:2013
Austin real estate inventory 7:1:2013
 
October Market Watch is Here !
October Market Watch is Here !October Market Watch is Here !
October Market Watch is Here !
 
April 2016 Home Sales in Toronto and GTA
April 2016 Home Sales in Toronto and GTAApril 2016 Home Sales in Toronto and GTA
April 2016 Home Sales in Toronto and GTA
 
TREB MARKET WATCH 2017
TREB MARKET WATCH 2017TREB MARKET WATCH 2017
TREB MARKET WATCH 2017
 
March 2017 market watch
March 2017 market watchMarch 2017 market watch
March 2017 market watch
 
March 2017 - TREB Market
March 2017 - TREB MarketMarch 2017 - TREB Market
March 2017 - TREB Market
 
Market Watch TORONTO 2015 SEPTEMBER
Market Watch TORONTO 2015 SEPTEMBERMarket Watch TORONTO 2015 SEPTEMBER
Market Watch TORONTO 2015 SEPTEMBER
 
Market Watch TORONTO 2015 OCTOBER
Market Watch TORONTO 2015 OCTOBERMarket Watch TORONTO 2015 OCTOBER
Market Watch TORONTO 2015 OCTOBER
 
January 2023 Okanagan Statistics with charts and graphs
January 2023 Okanagan Statistics with charts and graphsJanuary 2023 Okanagan Statistics with charts and graphs
January 2023 Okanagan Statistics with charts and graphs
 
Market Report for August 2017 - Residential Resale
Market Report for August 2017 - Residential ResaleMarket Report for August 2017 - Residential Resale
Market Report for August 2017 - Residential Resale
 
Central Okangan Monthly Statistics - February 2023.pdf
Central Okangan Monthly Statistics - February 2023.pdfCentral Okangan Monthly Statistics - February 2023.pdf
Central Okangan Monthly Statistics - February 2023.pdf
 
February 2017 Market Watch - JUST RELEASED
February 2017 Market Watch - JUST RELEASEDFebruary 2017 Market Watch - JUST RELEASED
February 2017 Market Watch - JUST RELEASED
 
The Okanagan Statistics Package January 2022
The Okanagan Statistics Package January 2022The Okanagan Statistics Package January 2022
The Okanagan Statistics Package January 2022
 

Plus de Sascha Bortt

Tricky Staircase Pattern Fluted Newel Post & Fluted Balusters
Tricky Staircase Pattern Fluted Newel Post & Fluted BalustersTricky Staircase Pattern Fluted Newel Post & Fluted Balusters
Tricky Staircase Pattern Fluted Newel Post & Fluted BalustersSascha Bortt
 
Curved Staircase in Red Oak
Curved Staircase in Red OakCurved Staircase in Red Oak
Curved Staircase in Red OakSascha Bortt
 
Re-Model White Oak Staircase
Re-Model White Oak StaircaseRe-Model White Oak Staircase
Re-Model White Oak StaircaseSascha Bortt
 
1031 Tax Free Strategies
1031 Tax Free Strategies1031 Tax Free Strategies
1031 Tax Free StrategiesSascha Bortt
 
Math Assistance Center Mentor 2006
Math Assistance Center Mentor 2006Math Assistance Center Mentor 2006
Math Assistance Center Mentor 2006Sascha Bortt
 
Math Assistance Center Mentor 2005
Math Assistance Center Mentor 2005Math Assistance Center Mentor 2005
Math Assistance Center Mentor 2005Sascha Bortt
 
Letter from Senator Jack Latvala
Letter from Senator Jack LatvalaLetter from Senator Jack Latvala
Letter from Senator Jack LatvalaSascha Bortt
 

Plus de Sascha Bortt (13)

Tricky Staircase Pattern Fluted Newel Post & Fluted Balusters
Tricky Staircase Pattern Fluted Newel Post & Fluted BalustersTricky Staircase Pattern Fluted Newel Post & Fluted Balusters
Tricky Staircase Pattern Fluted Newel Post & Fluted Balusters
 
Curved Staircase in Red Oak
Curved Staircase in Red OakCurved Staircase in Red Oak
Curved Staircase in Red Oak
 
Re-Model White Oak Staircase
Re-Model White Oak StaircaseRe-Model White Oak Staircase
Re-Model White Oak Staircase
 
Model Staircase
Model StaircaseModel Staircase
Model Staircase
 
Piano Stair 2
Piano Stair 2Piano Stair 2
Piano Stair 2
 
Piano Staircase
Piano StaircasePiano Staircase
Piano Staircase
 
Rick Scott
Rick ScottRick Scott
Rick Scott
 
1031 Tax Free Strategies
1031 Tax Free Strategies1031 Tax Free Strategies
1031 Tax Free Strategies
 
Math Assistance Center Mentor 2006
Math Assistance Center Mentor 2006Math Assistance Center Mentor 2006
Math Assistance Center Mentor 2006
 
Math Assistance Center Mentor 2005
Math Assistance Center Mentor 2005Math Assistance Center Mentor 2005
Math Assistance Center Mentor 2005
 
Rotaract
RotaractRotaract
Rotaract
 
Purdue Degree
Purdue DegreePurdue Degree
Purdue Degree
 
Letter from Senator Jack Latvala
Letter from Senator Jack LatvalaLetter from Senator Jack Latvala
Letter from Senator Jack Latvala
 

Englewood

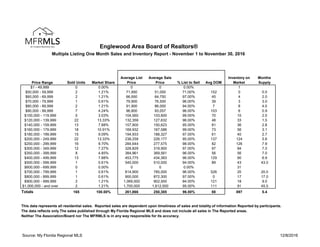
  • 1. Englewood Area Board of Realtors® Multiple Listing One Month Sales and Inventory Report - November 1 to November 30, 2016 Price Range Sold Units Market Share Average List Price Average Sale Price % List to Sell Avg DOM Inventory on Market Months Supply $1 - 49,999 0 0.00% 0 0 0.00% 1 $50,000 - 59,999 2 1.21% 71,950 51,000 71.00% 152 0 0.0 $60,000 - 69,999 2 1.21% 66,950 64,750 97.00% 45 4 2.0 $70,000 - 79,999 1 0.61% 79,900 76,500 96.00% 39 3 3.0 $80,000 - 89,999 2 1.21% 91,900 86,000 94.00% 7 8 4.0 $90,000 - 99,999 7 4.24% 96,800 93,057 96.00% 103 6 0.9 $100,000 - 119,999 5 3.03% 104,560 103,600 99.00% 70 10 2.0 $120,000 - 139,999 22 13.33% 132,359 127,632 96.00% 48 33 1.5 $140,000 - 159,999 13 7.88% 157,900 150,623 95.00% 81 36 2.8 $160,000 - 179,999 18 10.91% 169,932 167,586 99.00% 73 56 3.1 $180,000 - 199,999 15 9.09% 194,933 188,327 97.00% 61 40 2.7 $200,000 - 249,999 22 13.33% 238,259 226,177 95.00% 137 124 5.6 $250,000 - 299,999 16 9.70% 284,644 277,575 98.00% 82 126 7.9 $300,000 - 349,999 12 7.27% 328,829 319,900 97.00% 97 84 7.0 $350,000 - 399,999 8 4.85% 384,961 369,561 96.00% 56 56 7.0 $400,000 - 499,999 13 7.88% 453,775 434,383 96.00% 129 90 6.9 $500,000 - 599,999 1 0.61% 545,000 510,000 94.00% 89 43 43.0 $600,000 - 699,999 0 0.00% 0 0 0.00% 31 $700,000 - 799,999 1 0.61% 814,900 785,000 96.00% 526 20 20.0 $800,000 - 899,999 1 0.61% 900,000 872,300 97.00% 0 17 17.0 $900,000 - 999,999 2 1.21% 1,069,000 902,500 84.00% 121 18 9.0 $1,000,000 - and over 2 1.21% 1,700,000 1,612,500 95.00% 111 91 45.5 Totals 165 100.00% 261,866 250,385 96.00% 88 897 5.4 This data represents all residential sales. Reported sales are dependent upon timeliness of sales and totality of information Reported by participants. The data reflects only The sales published through My Florida Regional MLS and does not include all sales in The Reported areas. Neither The Association/Board nor The MFRMLS is in any way responsible for its accuracy. Source: My Florida Regional MLS 12/8/2016
  • 2. Englewood Area Board of Realtors® Multiple Listing YTD Sales and Inventory Report - January 1 to November 30, 2016 Price Range Sold Units Market Share Average List Price Average Sale Price % List to Sell Avg DOM Inventory on Market Months Supply $1 - 49,999 16 0.75% 41,122 36,328 88.00% 57 1 0.7 $50,000 - 59,999 16 0.75% 62,944 55,011 87.00% 137 0 0.0 $60,000 - 69,999 29 1.36% 69,914 64,881 93.00% 54 4 1.5 $70,000 - 79,999 38 1.78% 79,845 74,663 94.00% 55 3 0.9 $80,000 - 89,999 49 2.29% 86,996 83,962 97.00% 42 8 1.8 $90,000 - 99,999 39 1.82% 98,661 93,246 95.00% 85 6 1.7 $100,000 - 119,999 98 4.59% 114,720 109,415 95.00% 61 10 1.1 $120,000 - 139,999 202 9.45% 134,533 129,668 96.00% 55 33 1.8 $140,000 - 159,999 166 7.77% 155,535 149,922 96.00% 58 36 2.4 $160,000 - 179,999 211 9.87% 173,895 168,517 97.00% 68 56 2.9 $180,000 - 199,999 132 6.18% 195,187 188,103 96.00% 80 40 3.3 $200,000 - 249,999 350 16.38% 234,206 224,815 96.00% 85 124 3.9 $250,000 - 299,999 252 11.79% 282,987 272,875 96.00% 101 126 5.5 $300,000 - 349,999 159 7.44% 335,364 322,252 96.00% 133 84 5.8 $350,000 - 399,999 99 4.63% 386,996 370,668 96.00% 118 56 6.2 $400,000 - 499,999 129 6.04% 458,367 438,622 96.00% 110 90 7.7 $500,000 - 599,999 24 1.12% 566,483 544,286 96.00% 68 43 19.7 $600,000 - 699,999 16 0.75% 668,404 645,560 97.00% 189 31 21.3 $700,000 - 799,999 19 0.89% 771,079 739,158 96.00% 137 20 11.6 $800,000 - 899,999 15 0.70% 888,193 855,853 96.00% 273 17 12.5 $900,000 - 999,999 21 0.98% 1,012,000 943,976 93.00% 152 18 9.4 $1,000,000 - and over 57 2.67% 2,292,789 2,184,423 95.00% 137 91 17.6 Totals 2,137 100.00% 304,064 291,388 96.00% 88 897 4.6 This data represents all residential sales. Reported sales are dependent upon timeliness of sales and totality of information Reported by participants. The data reflects only The sales published through My Florida Regional MLS and does not include all sales in The Reported areas. Neither The Association/Board nor The MFRMLS is in any way responsible for its accuracy. Source: My Florida Regional MLS 12/8/2016