OAS: INEQUALITY AND SOCIAL INCLUSION IN THE AMERICAS
Coglianese - Can Regulatory Capture Explain Economic Inequality in America
1. 1
Can Regulatory Capture Explain Economic Inequality in America?
Cary Coglianese*
Edward B. Shils Professor of Law
University of Pennsylvania Law School
Robert A. Kagan Lecture on Law and Regulation
Center for the Study of Law and Society
University of California, Berkeley
March 10, 2015
Economic inequality in America has expanded dramatically over the past four decades. It
has also landed high on the national policy agenda, with nearly 80 percent of Americans – a
majority of Democrats and Republicans – seeing the growing gap between the rich and the poor
as a “big problem” (Pew Research Center 2014).1
Political leaders of both parties echo the
public’s concerns. President Barack Obama has declared economic equality to be “the defining
challenge of our time” (Obama 2013). Republican Paul Ryan has issued a plan to address
inequality, lamenting the predicament that has many American families “falling further and
further behind” (Ryan 2014). Although bipartisan agreement breaks down on the causes of
economic inequality – and the best ways to reduce it – one common theme centers on how laws
and regulations have become biased in favor of the wealthy. Activists in both the Occupy Wall
Street and Tea Party movements have decried, albeit in starkly different ways, how government
is rigged to work against the interests of ordinary Americans. Such views are widely shared, as
sixty percent of Americans, including a majority of Republicans, believe that the “system”
operates unfairly to support the wealthy and impede economic mobility (Pew Research Center
2014). “We call it democracy,” says economist Jeffrey Sachs, “but billions and billions of
dollars are spent by corporations and by rich people to run the government these days. And the
policies that are selected are not for the poor; they are for the rich” (Sachs 2015).
In this essay, I consider these claims. Does government regulation, and particularly the
regulatory system’s capture by affluent interests, explain the distinctive gap between the rich and
poor that has grown steadily over the last forty years in the United States? Regulatory capture –
*
I am grateful for research assistance provided by Kaiya Arroyo, Tim von Dulm, and, most especially, Shane
Murphy; constructive exchanges with Chris Carrigan, John Coglianese, Adam Finkel, Jill Fisch, Michael Knoll,
Reed Shuldiner, and Dan Walters; and incisive suggestions and reactions from other colleagues, including Mitch
Berman, Gerald Faulhaber, Jonah Gelbach, Stephen Morse, Ted Ruger, Amy Wax, and Tobias Wolff, who
commented helpfully on an early presentation of some of these ideas I delivered at the University of Pennsylvania
Law School. Of course, I bear all the usual responsibility for errors and omissions. Address correspondence to
cary_coglianese@law.upenn.edu.
1
It was not always so. Vogel (1987) noted that “the distribution of income and wealth ... has not been the subject of
much public discussion in the United States.” See generally Reich (2007:165); Jacobs and Skocpol (2005).
2. 2
also referred to as rent-seeking – has long concerned both policymakers and scholars of law and
regulation. Capture arises when concentrated interests exert influence over regulatory
institutions to achieve policy outcomes that favor those interests, returning “rents” or outcomes
that benefit the influential interests but are at odds with the overall good of society.2
Scholarly
and public attention to capture probably last reached its zenith in the 1960s and early 1970s, but
it has re-emerged recently in the wake of the financial crisis and other disasters that have shaken
public confidence in the U.S. regulatory system (Coglianese 2012; Carpenter & Moss 2014).
Singling out rent-seeking as a major factor driving economic inequality, Nobel prize-winning
economist Joseph Stiglitz (2013) argues that “laws and regulations, and how they are
implemented and enforced, reflect the interests of the top layer of society more than those of the
people in the middle and at the bottom.” He is joined by a varied collection of other academic
commentators who postulate that U.S. inequality stems, to no small degree, from regulatory
policies and practices that have advanced the interests of the privileged in society to the
detriment of everyone else (e.g., Baker 2015; Krugman 2014; Teles 2014; Reich 2013).
Political scientists and others who study the regulatory process have yet to entertain these
claims systematically. It seems more than time to do so. Expanding inequality appears prima
facie to be a troubling trend for society. If biased or captured regulatory processes in fact
contribute significantly to class divisions, this will be important to know and could suggest new
ways of reversing current trends. In this pursuit, regulation scholars have distinctive
contributions to offer. Claims about capture can be easy to assert, but hard to substantiate –
which only makes it more important to analyze fully and carefully the available evidence on both
inequality and regulatory politics. Starting such an analysis is my motivation here: to consider
whether what we know about regulatory politics can explain the observed patterns in economic
inequality in America.
I begin by reviewing these patterns and developing more fully the claims that regulatory
rent-seeking has privileged the rich over the poor. I suggest, initially, that a fair amount of
evidence makes a plausible case that capture explains American inequality. Yet, upon further
inquiry, I proceed to show that the chief patterns of inequality in America are not supported by
what we know about regulation and regulatory politics. When we focus more closely on two
characteristic features of American inequality – namely, its rising trend beginning in the 1970s
and its relatively extreme nature compared with other developed economies – the case for
capture as a cause of widening inequality disappears. This is not to deny that rent-seeking
behavior exists, nor to suggest that regulation – or its absence – never has regressive effects. Nor
is it to suggest that other kinds of changes to public policy (say, tax and transfer programs) could
not make meaningful reductions in the gulf between rich and poor. Rather, the claim is that a
systematic relationship between bias in the regulatory system and inequality does not appear to
exist – or at least, such a relationship is not at all consistent with what we know about regulatory
policymaking historically and comparatively. Inequality, it appears, cannot be corrected simply
by adopting general reforms to the regulatory process to correct for capture.
2
I agree with Carpenter and Moss (2014:11-12) that capture can be either “strong” or “weak.” Even these terms,
though, reinforce the notion of capture as something categorical, namely that government either is or is not captured,
strongly or weakly. Yet capture is more helpfully thought of as a matter of degree (Carpenter and Moss 2014:9).
That is why I use terms like “rent-seeking” and “bias” interchangeably with “capture.”
3. 3
For regulatory scholars, an exploration of the relationship between capture and inequality
provides an opportunity to bring our specialized knowledge of political pressure and
governmental process to bear on one of the most vital public and scholarly debates of our time.
It also reveals, along the way, how much we can still learn about regulatory bias, business
behavior, and distributional consequences, as well as what might be realistic to expect from the
possibility of using regulatory reform as a strategy to address growing inequality in society.
Widening Economic Inequality in America
Economic inequality can be measured by income or wealth, at the individual or
household level, and with different data sources. But by almost any measure, the trend has been
toward ever-widening inequality since the 1970s, with the United States exhibiting greater
inequality than other advanced economies. Although data on income inequality are most
frequently reported, disparities in wealth are usually even more pronounced than those in
income, at least in part because of wealth’s cumulative nature. In 2013, the top 5% wealthiest
households held 63 percent of all the wealth in America (Yellen 2014). Although the US has not
always been the most extreme country in terms of wealth inequality, today it is clearly one of the
most, if not by some measures the most, unequal societies when compared to wealth distributions
in other advanced economies (Piketty 2014; Cowell 2011).
But let us, like most others, focus on income inequality. Over the course of the last
century, the distribution of income has exhibited a U-shaped pattern, with rising levels of
inequality in the early 1900s followed by greater equality in the post-war period of the last
century as the middle-class expanded in the 1950s and 1960s. Then, “after 1973 the trend
toward income equalization reversed” (Jacobs and Skocpol 2005). The gap between the highest-
income earners and those in the middle- and lower-classes started to widen, with an “explosion
of wage inequality in the United States ... after 1970” (Piketty 2014:330).3
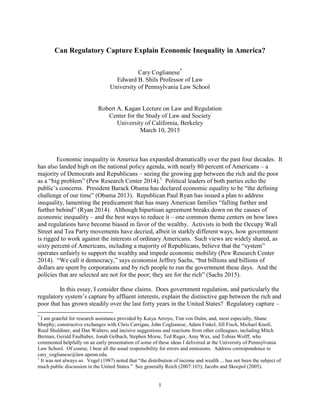
Economic inequality is often measured in terms of a Gini coefficient, a score which
ranges from zero to one. A Gini coefficient of zero represents perfect equality, where every
point along the continuum of income levels equals the proportion of total income. In a state of
perfect income equality, then, the bottom 20 percent (or quintile) of individuals in terms of
income would receive 20 percent of the total income in the economy, the next 20 percent would
receive another 20 percent of the total income, and so forth. A Gini coefficient of one represents
the opposite situation, extreme inequality, a situation where a single person or household
possessed all the income in society. In 1967, the United States had a Gini coefficient of 0.397,
based on U.S. Census data of household income. By 2013, that coefficient had increased to
3
Different ways of analyzing inequality offer somewhat different starting points for the uptick in inequality. When
focusing on the share of income held by the top decile, Piketty (2014:294) notes that “[i]nequality reached its lowest
ebb between 1950 and 1980.”
4. 4
0.476, or an increase in inequality of about 20 percent. Figure 1 tracks the change in the Gini
coefficient for family incomes over the last seventy years.4
Bearing in mind that inequality refers to the gap between rich and poor, inequality can
increase when the poor get poorer, the rich get richer, or both. In the United States, most of the
increase in inequality has arisen from the growth in the incomes of those at very top of the
economic ladder, with little growth occurring for those at the lower rungs. According to the
latest report from the Congressional Budget Office, the lowest 20 percent of income-earners
(who on average make about $25,000 per year) received only about 5 percent of the total pre-tax
income in 2011, whereas the highest 20 percent (who make an average of $246,000 per year)
received more than 50 percent of all the income (CBO 2014). Piketty (2014:297) reports that
“from 1977 to 2007, we find that the richest 10 percent appropriated three-quarters of the
growth.” For the richest 1 percent, their portion of national income, excluding capital gains,
increased “from 7.7 percent in 1973 to 17.4 percent in 2010” (Mankiw 2013; see also Piketty &
Saez 2003, Piketty 2014). The share of income received by the ultra-rich, the top 0.01 percent
with annual incomes of more than about$6 million, “rose from 0.5 percent in 1973 to 3.3 percent
in 2010” – nearly a 700 percent increase (Mankiw 2013).5
Figure 1: Gini Coefficient for Family Income
Source: U.S. Bureau of Census; Federal Reserve Bank of St. Louis
4
Gini coefficients for family incomes are generally lower than for household income, but more longitudinal data are
available on family incomes. Household income data include individuals living alone, while family income data
only include households with two or more related individuals.
5
A relatively small part of the increase in income comes from capital gains. The “substantial” portion comes from
labor income, which exhibits similar longitudinal and comparative patterns as overall income (Jones and Kim 2014).
0.34
0.36
0.38
0.4
0.42
0.44
0.46
1947 1957 1967 1977 1987 1997 2007
GiniCoefficient
Year
5. 5
Figure 2: Top Decile’s Share of Income: US and Europe
Source: Piketty (2014); http://piketty.pse.ens.fr/en/capital21c2
This general pattern of widening inequality, and increasing gains by those at the very top
of the economic ladder, has appeared in many other countries around the world. But the United
States is still an outlier. Jacobs and Skocpol (2005:5) note that “from the mid-1970s on, the
United States rapidly diverged from both Britain and France and became far more unequal.”
Even if one takes into account differences in tax and transfer programs, “the U.S. has one of the
most unequal income distributions in the developed world” (Desilver 2013). Indeed, “when
compared to the narrower set of the richest nations, the distribution in the U.S. is the most
unequal” (Morelli, Smeeding, and Thompson 2014). Much of this divergence stems, again, from
differences in gains among those at the top of the income distribution. Figure 2 shows how the
proportion of income held by the richest 10 percent changed over time in the United States
compared with the same economic cohort in Europe.
Admittedly, it might be asked whether European nations, or any other developed
economies elsewhere in the world, constitute the correct benchmark for morally permissible
levels of inequality in a society. Some scholars or decision makers might well wonder whether
expanding inequality is worth worrying about at all. Perhaps what matters is equality in terms of
25%
30%
35%
40%
45%
50%
1900 1910 1920 1930 1940 1950 1960 1970 1980 1990 2000 2010
Shareoftotalincome
Year
US
Europe
6. 6
economic opportunity or mobility, rather than in terms of outcomes.6
Of course, the U.S. may
not fare well on these alternative measures either (e.g., Chetty et al. 2014). Still, many people
are gravely concerned about unequal outcomes in the United States – either in their own right or
for what they say about equality of opportunity and mobility. Some people are no doubt
concerned about widening inequality of outcomes for purely egalitarian reasons (e.g., Rawls
1971). Others are concerned about the potential implications of highly-skewed economic
conditions for a well-functioning democracy (e.g., Stiglitz 2013; Bartels 2008; Jacobs and
Skocpol 2005). Others are concerned about the possibility that a huge gulf in income might
hinder overall economic growth and efficiency (e.g., Cingano 2014). Still others are
undoubtedly concerned about expanding inequality for a combination of these reasons. No
matter the rationale, if inequality is a major problem in society, finding out what is causing it is
obviously an essential step in the direction of identifying effective solutions.
Is Regulatory Rent-Seeking the Cause?
Economists and other social scientists have devoted much effort to finding the cause of
the distinctively widening pattern of inequality in America. Among the candidates have been
technological innovation, globalization, patterns of immigration, and differences in tax rates.
Piketty (2014:571) has recently argued that inequality fundamentally derives from the economic
“fact” that capital has delivered a rate of return higher than the rate of overall economic growth.
But might the governmental process, and, more specifically, biases in it, also explain
patterns of inequality? Regulatory rent-seeking has emerged in recent years as a possible
additional cause. In the political sphere, accusations of a “rigged” regulatory system now appear
with some frequency, and increasingly they seem to be linked to inequality. For example,
Democratic Senator Sheldon Whitehouse has lamented “the massive transfer of wealth that is
possible from successful agency capture” (Whitehouse 2010), stating that the “rules of the
economic game in this country are increasingly being rigged to provide unfair advantage to the
wealthy and well-connected and to take unfair advantage of regular folks and families”
(Whitehouse 2011). Republicans have also started to express similar concerns, although they
think that some of the system’s regulatory burdens actually help the rich at the expense of the
poor or the middle-class. Representative Ryan, for example, complains that “[m]any federal
regulations – especially energy regulations – place a disproportionately large burden on low-
income households” (Ryan 2014). A recent Republican Senate staff report claims that a left-
wing “Billionaire’s Club” has won many policy “successes through the ‘capture’ of key
employees at EPA” who make decisions that “are often at the expense of farmers, miners,
roughnecks, small businesses, and families” (U.S. Senate 2014).
But it has not only been Washington insiders who have drawn the connection between
regulatory capture and inequality. Economists and other social scientists have as well. For
example, economist Dean Baker (2015) claims that “many of the rules have been written in ways
that work to the advantage of the rich and powerful,” resulting in a legal system “rigged to work
6
In a recent opinion piece in U.S. News & World Report, business consultant Alejandro Crawford (2014) asserts that
“onerous regulations ... inhibit small business and favor incumbents,” resulting in unequal economic opportunity in
society.
7. 7
against the vast majority of the population.” Paul Krugman (2014) lauds fellow economist
Thomas Piketty for his work analyzing American inequality in terms of basic economic
variables, but says that Piketty’s “failure to include deregulation is a significant disappointment.”
Political scientist Nathan Kelly (2008) hypothesizes that “regulatory policies have important
economic implications that could influence inequality.” Political scientist Martin Gilens
(2012:48) includes “financial deregulation” in a list of policies that “serve to exacerbate
economic inequalities,” while political scientist Steve Teles (2014) decries an “explosion of
regulation ... that has the effect of redistributing, sometimes dramatically, upward.” Political
scientists Jacob Hacker and Paul Pierson (2010) develop an extensive account of how a biased
“government has rewritten the rules of the market in ways that favor those at the top.”
How has such an allegedly regressive regulatory system arisen? Stiglitz (2013) argues
that “[m]uch of the inequality in our economy has been the result of rent-seeking.” He posits
that a key factor contributing to regressive regulatory policy has been rent-seeking behavior by
business interests:
So why has America chosen these inequality-enhancing policies? .... Some drew
the wrong lesson from the collapse of the Soviet system. The pendulum swung
from much too much government there to much too little here. Corporate interests
argued for getting rid of regulations, even when those regulations had done so
much to protect and improve our environment, our safety, our health and the
economy itself. .... We must end the rent-seeking society we have gravitated
toward, in which the wealthy obtain profits by manipulating the system.....
Widening and deepening inequality is not driven by immutable economic laws,
but by laws we have written ourselves (Stiglitz 2014).7
Inequality and policy influence, it is asserted, have become a self-perpetuating spiral, as
influence begets wealth, and wealth begets influence. This pattern, notes former U.S. Labor
Secretary Robert Reich (2013: 113), explains why “the game is rigged”:
As income concentrates at the top, the wealthy also gain disproportionate political
power to entrench their wealth through public policies that favor them – policies
that reduce their taxes, cut regulations that impose on their profits, enhance
government subsidies to them and their enterprises, and reward them with
monopolies (Reich 2013:149).
In a documentary film based on Reich’s book, Aftershock, and a popular undergraduate course he
teaches on wealth and poverty, the filmmaker inserts a graphic showing examples of laws and
regulations (e.g., “food safety protection”) immediately preceding a discussion of “Why
Inequality has been Widening.” In the voiceover that accompanies the regulatory graphic, Reich
states:
7
Stiglitz (2013: 40-41) has acknowledged that “not all the inequality in our society is a result of rent-seeking, or of
government’s tiling the rules of the game to favor those at the top,” but he still argues that government’s failure to
tame the free market “play[s] a key role in explaining inequality in America” (2013: 216).
8. 8
The real question is: Who do the rules benefit? And who do they hurt? And the
last thirty years, as the structure of the economy began to shift, many of the rules
governing our market began to shift as well (Reich 2013).
In trying to explain why inequality persists, many observers have emphasized how
resource advantages equate to political advantages. Political scientists Adam Bonica, Nolan
McCarty, and Howard Rosenthal (2013:105) argue that “the rich have been able to use their
resources to influence electoral, legislative, and regulatory processes through campaign
contributions, lobbying, and revolving door employment of politicians and bureaucrats.” In a
similar vein, economist Luigi Zingales (2012) says that the U.S. “system is rigged,” with the
rules of business competition increasingly taking the form of “crony capitalism.” Jeffrey Sachs
(2015) posits that “money really has captured governments all over the world and led to a real
exacerbation of inequality in recent years.”
Of course, if it were not for voices like these, perhaps bias in regulatory policy might
seem an unusual candidate for explaining inequality. After all, other public policies, especially
tax and transfer programs, have more obvious and immediately plausible redistributive
implications (e.g., Avi-Yonah 2014). Even education and health care policies would seem to
have more to do with economic mobility and equality than regulation of business. Of course,
those who lay blame on regulatory rent-seeking do not deny the important role that other types of
public policy may play in explaining inequality, or at least could play in redressing it. Yet
business regulation still increasingly finds itself implicated in both popular and scholarly
diagnoses of inequality in America.
The turn toward regulation may stem from several possible considerations. First, the
financial crisis of 2007-2008 and the slow pace of employment growth following the Great
Recession seem to have made regulatory policy a common target of derision in all ideological
quarters. The Left generally argues that insufficient regulatory oversight of the financial sector
led to the financial crisis in the first place, while the Right blames excessive “job-killing”
regulations for impeding economic recovery following the crisis (Coglianese 2012, Coglianese,
Finkel and Carrigan 2013). Either way, regulatory policy has become viewed as the source of
many great economic woes that have fallen particularly hard on middle- and lower-class
Americans. The financial crisis appears to have made financial regulation in particular an easy
target, and capture of the regulatory process is often the alleged root cause (Carpenter and Moss
(2014: 2).
Second, inequality has become a key political issue du jour. As such, politicians and
even academic commentators may intentionally or unintentionally dress up their substantive
views about regulatory policy in the language of inequality. Suggesting this is not to trivialize
concern about economic inequality as merely a passing fad; on the contrary, serious scholars and
civic leaders have been concerned about expanding inequality for decades. Nor is it to cast
aspersions on anyone’s true motivations. Nevertheless, when polls confirm that most Americans
are dissatisfied with wealth disparities, and when a seven-hundred page tome on inequality
written by a French economist rises to the top of the New York Times’ bestseller list (Piketty
2014), it is clear that inequality has ascended high on the public agenda in America. At least
9. 9
some cloaking of policy predispositions in the fabric of inequality might be expected on the part
of at least some commentators.
Finally, as inequality grows increasingly stark, it makes good, substantive sense for
anyone concerned in good faith about inequality to look hard for all possible contributing factors
– and for all possible cures. If regulatory capture truly explains America’s pattern of inequality,
it may be easier to fix than if inequality stems from other sources, such as immutable market
forces that affect the accumulative trajectory of capital-based wealth (Piketty 2014). As Stiglitz
(2013:xv) observes, “while we may be able to do only a little to change the direction of market
forces, we can circumscribe rent-seeking.” Fixing capture may also be easier, or at least more
politically viable, than raising taxes, especially in an era of Republican control of both houses of
Congress. Stiglitz (2010) notes that “[r]egulations may be an important instrument for achieving
distributive objectives, especially when governments face tight budgetary constraints (or other
administrative constraints).”
Fixing capture might also prove better for substantive reasons, not just tactical ones. If
the regulatory system is indeed “rigged” and causing ever-widening inequality, then making
changes in administrative law, regulatory procedure, or other policy processes to counteract the
system’s biases would directly address the root cause of the underlying inequality. It would also
prove more attractive by avoiding tradeoffs created by other means of combatting inequality.
Despite the fact that “regulating” via progressive income taxes can directly redistribute resources
(Piketty 2014: 469), the well-accepted equity-efficiency tradeoff means that redistributive
taxation could decrease overall resources in the economy (Okun 1975; Mankiw 2013; Gruber
2013). In other words, as taxes and transfers make the slices of the pie more equal, they may
also make the overall size of the pie smaller. If there were a way to make the slices more equal
without reducing the pie’s overall size – say, by reducing rent-seeking – such an alternative
would obviously be worth considering.
To date, neither the voices of political scientists who specialize in the study regulation
nor those of administrative law scholars who focus on procedural tools thought to combat
capture in the regulatory process have entered the conversation in any meaningful way.8
Yet
regulatory scholars would seem to have much to contribute in determining whether what we
know about regulation and the regulatory process fits with what has occurred with inequality
over the last several decades. As I will suggest next, evidence does exist to take seriously the
possibility that regulatory rent-seeking helps explain economic inequality in America.
8
Although attention from empirically-oriented scholars of regulation as well as administrative law scholars is
clearly lacking, a few theoretically and historically-minded legal scholars have recently commented on the
connection (Grewal 2014; Moyn 2014). Of course, there is also an earlier prescriptive debate in law and economics
on the role that redistributive goals should play in the design and establishment of legal rules (e.g., Hylland and
Zeckhauser 1979; Shavell 1981; Kaplow and Shavell 1994; Sanchirico 2000; Kaplow and Shavell 2000; Adler
2012).
10. 10
Regulatory Bias as a Plausible Explanation
Government provides numerous theoretical opportunities for rent extraction: subsidies,
favorable tax exemptions, government contracts, and various forms of legal or regulatory
treatment. The focus here, of course, is on the last of these: namely, gaining advantage through
laws or regulations and their enforcement. Since the expanding inequality in America stems
primarily from greater growth in income by those already at the very top of the distribution, the
principal focus should presumably also be on potential biases that help the economically
advantaged to secure further advantages to the detriment of broader social welfare or the public
interest. In studies of regulatory politics, businesses serve as the usual proxy for the
economically advantaged, but it bears noting that in theory rent-seeking could be pursued by
nearly anyone in society, whether rich or not. Whenever rents accrue distinctively and
systematically to one group in society, to the expense of the public interest, the condition known
as regulatory capture holds (e.g., Carpenter and Moss 2014).
The case for regulatory capture, or systematic bias, as a source of inequality is most
commonly grounded on examples of policy actions that appear to work to the advantage of
businesses. These examples fall into two categories: corrosive and anticompetitive (Carpenter
and Moss 2014). Corrosive capture or rent-seeking occurs when some groups in society – such
as big firms in a regulated sector – successfully exert influence on legislators or regulators to
weaken laws or otherwise tailor rules to minimize costs to themselves but with a loss of value to
society overall. Many examples of allegedly corrosive actions can be found. Stiglitz (2013)
offers a variety of examples in his account of inequality in America:
Insufficient environmental protection “[b]ecause the oil and coal companies use their
money to influence environmental regulation” and gain “private rewards (which are often
huge)” (124)
Electricity deregulation advocated by Enron gave it opportunities in the 1990s to
“manipulate the California electricity market to make millions and millions for itself, a
transfer of money from ordinary citizens of that state to Ken Lay, its CEO, and the others
who ran the company.” (222).
Federal rules that limit the liability of nuclear power plants and offshore oil drilling sites
from harms caused by accidents (236)
Legislation adopted in 2005 to make certain bankruptcy rules more “creditor-friendly”
(244)
The dismantling in 1999 of the Glass-Steagall Act’s separation of commercial and
investment banking (113)
Beyond corrosion, a second way to use regulation to secure rents is to use rules to restrain
competition, thereby artificially raising the prices consumers pay for goods and services to the
advantage of the businesses that provide those goods and services (Stigler 1971). Such
anticompetitive rents can occur when government regulation grants some monopoly power to
specific economic actors, such as via drug approvals, patent protection, or occupational
licensing. One recent example, spotlighted by a recent case decided by the U.S. Supreme Court,
involves a North Carolina dental licensing board’s mandate that only dentists shall be allowed to
perform teeth whitening services in the state. Six of the eight members of the North Carolina
11. 11
board are dentists – who were elected to the board by dentists – and the claim was that they used
law to block out less expensive teeth whitening services, all to consumers’ detriment (Mincer
2014; Salam 2015). Another popular, recent example consists of taxicab regulations that in some
cities act as a barrier to completion by sharing economy firms like Uber (Porter 2015; Teles
2014). Even when a direct monopoly power is not granted, if rules impose heavier burdens on
some firms but not others, they may impede competition in ways that advantage certain
incumbent firms but disadvantage consumers. When regulations create such disparate impacts
on firms, they serve as barriers to entry, keeping new entrants from competing on a level playing
field (Stigler 1971).
Sometimes the policy actions cited as evidence of capture are in fact instances of inaction
– with the claim being that businesses and other advantaged interests influence decision makers
to keep them from adopting rules that would be costly to those interests but would otherwise be
socially desirable. Hacker and Pierson (2010) call this phenomenon “policy drift.” In making
his case for the role of rent-seeking in inequality, Stiglitz (2013) cites several examples of such
capture through inaction:
The failure to enact rules in the 1990s to require recipients of federal television licenses
to provide free advertising because station owners “vehemently and successfully opposed
the reform” (170)
State proposals to restrain predatory lending in the early 2000s that were blocked by
banks that “used all their political muscle” (240)
The paucity of regulatory enforcement cases involving securities and foreclosure fraud
following the 2008 financial crisis (249, 257)
In all of these examples of inaction as well as action, regulatory policy allegedly works to
the detriment of the public interest but to the private advantage of some select group – from big
banks to local television stations, from major manufacturing firms to dentists. These so-called
special interest groups influence the process to their advantage in a variety of ways, such as by
financing politicians’ campaigns, influencing who heads regulatory agencies, lobbying decision
makers, threatening to file lawsuits, and providing regulators with information countering their
regulatory proposals. Examples of such rent-seeking behavior seem to abound. The New York
Times recently reported, for instance, that energy company lawyers wrote letters for state
officials to use to try to put pressure on the U.S. Environmental Protection Agency to relax
certain air pollution rules (Lipton 2014). Secret recordings of internal conversations involving
examiners at the New York Fed, followed by a 2014 investigative report by the news
organization ProPublica, led to allegations of a Wall Street regulator that developed a soft culture
of oversight through the course of repeated interactions with banks (Bernstein 2014).
Admittedly, individual examples, even numerous ones, do not necessarily indicate the
kind of systematic pattern of privilege indicative of regulatory capture or consistent with
systematic patterns of inequality in the United States. After all, any policy will have winners and
losers (Lasswell 1936), so the fact that policies sometimes advantage businesses or advantaged
individuals does not mean that the system overall exhibits a bias. Gilens (2012) provides what
may be the broadest test yet of a systematic bias in the U.S. policy process. He collected data on
about 1,900 public opinion survey questions from 1981-2002 asking whether respondents
12. 12
supported specific policy proposals. He then combed through historical materials to find out if
that proposal had in fact been adopted within four years of the survey, his measure of “policy
responsiveness.” Based on income levels he imputed to survey respondents, he found that those
at the top 10% of the income scale tended to see a somewhat greater portion of their preferred
policies adopted than did respondents at lower income levels. He found still more striking
differences when he separately analyzed responsiveness to policies on which the top 10% tended
to differ in their policy views with averages greater than 5% apart. In those instances where low-
income respondents disagreed with high-income respondents (about two-thirds of the time), and
the middle-income respondents disagreed with the high-income respondents (about half the
time), policy outcomes largely aligned with those of the high-income respondents, not with those
at lower levels.
Gilens (2012) drew his sample of policies to consider from public opinion surveys, rather
than from actual policies debated or considered, and most of these policies were legislative in
nature. But the regulatory process itself has been considered a venue that is particularly prone to
bias toward business. Indeed, economists started to write about regulatory capture at around the
same time that income inequality started to expand (Stigler 1971; Krueger 1974; Posner 1974;
Peltzman 1976). We also know that business groups participate more extensively in the
rulemaking processes at executive branch agencies than do individual citizens or public interest
groups. For example, in a recent study of business participation in agency rulemaking, legal
scholars Wendy Wagner, Katherine Barnes, and Lisa Peters (2011) have succinctly summarized
much of the existing research:
Several different researchers found systematic biases in rules that favor regulated
parties occurring across several large agencies, including agencies like the EPA
that are generally viewed as resistant to traditional forms of agency capture.
Specifically, Professors Yackee and Yackee, Golden, Coglianese, and Cropper et
al. all conducted studies that assess the diversity of interest group representation
in environmental and public health rules and each found the public interest
groups absent from about half of the rules in their data set. In three of these four
studies, moreover, the analysts found public interests substantially outnumbered
by regulated parties for those rules when they did participate.
The findings from these various studies of federal rulemaking tend to mirror those from studies
of interest group politics more generally. For example, political scientists Kay Schlozman and
John Tierney (1986:1028-29) have estimated that business or trade associations make up about
two-thirds of the lobbying universe, a finding which led them to indicate that “the pressure
system is tilted heavily in favor of the well-off, especially business, at the expense of the
representation of broad public interests and the interests of those with few political resources.”
Scott Furlong and Neil Kerwin (2005:359) found an even greater “predominance of
organizations representing business interests” – around three-quarters – using a different
sampling strategy. Frank Baumgartner et al. (2009) found a similar proportion of active
corporations, trade groups, and professional groups in a different sample of lobbying groups,
with “citizen groups” making up only about 15 percent.
13. 13
We know less clearly whether the sheer lopsidedness of business participation in the
policy process leads to correspondingly lopsided policy outcomes. The widely-held assumption
is that it does, perhaps with some suggestive support from Gilens (2012). But Gilens (2012)
focused primarily on individual attitudes, actually finding that interest groups did not appear to
widen the disparities in policy responses to the preferences of the rich and the poor. Gilens and
Page (2014), however, have offered an analysis that combines public opinion data with data on
policy positions expressed by approximately 35 major interest groups. They model the passage
of policy measures based on the average preferences of those at the 50th
percentile in an income
distribution, those at the 90th
, and the positions of the major interest groups (using an index of
support across their sample of groups). The views of the median survey respondent do not seem
to matter in their full model, but those of the interest groups and the more affluent individuals do.
When they separate business groups from mass membership groups (e.g., the AARP, NRA) and
test individual groups’ positions separately, both types of groups seem to matter about the same.
However, when aggregating group positions using their index, business groups’ positions taken
together show a somewhat stronger correlation with policy outcomes than mass membership
groups because business groups are more numerous and their views more homogeneous.
Political scientist Marissa Golden (1998) sought to determine whether businesses might
reap a disproportionate on the regulatory process. Comparing the supporting documents for ten
regulations adopted by three federal agencies with all the written comments submitted on those
same rules, she “did not find undue business influence” (Golden 1998:262). She found that
comments were rarely associated with any significant changes to the rules, and that business
comments in particular were more often than note effectively muted because of conflicting
positions taken in the comments by different business. Political scientists Susan Yackee and
Jason Yackee (2006) have provided the largest, most systematic published test of business
influence in the context of federal agency rulemaking. 9
Examining nearly 1,700 comments filed
on about forty agency rulemakings, they found that nearly 85 percent of the comments filed by
business groups favored less regulatory stringency. Having coded each rule on a three-point
scale for whether it moved toward greater or lesser stringency after the close of the required
public comment period, Yackee and Yackee found that the greater the proportion of comments
submitted by business in a rulemaking, the greater the likelihood the final rule would be less
stringent. They concluded that “agencies appear to alter final rules to suit the expressed desires
of business commenters, but do not appear to alter rules to match the expressed preferences of
other kinds of interests” (Yackee and Yackee 2006:135).
In addition, a few studies have considered whether a causal connection might exist
between public policy – very broadly speaking – and income patterns.10
Political scientist Larry
Bartels (2008) analyzes the relationship between income inequality and party control of the
White House from 1947-2005, finding “marked partisan differences” in the direction of
inequality: growth under Republican administrations and moderation during Democratic ones.
9
Other unpublished research probing business influence include Binderkrantz, Christiansen, and Pedersen (2014)
and Kirilenko, Mankad, and Michailidis (2014).
10
Some research investigates the possibility of an association between levels of governmental corruption and
income inequality (e.g., Apergis, Dincer and Payne 2010), but the findings from this literature are far from
conclusive. If a causal connection exists, it might move in either direction.
14. 14
Kelly (2008) adds a measure of public policy to a similar analysis by factoring in a measure of
the ideological direction of enacted legislation. He constructs a three-point scale to code major
legislation passed each year by Congress from 1947-2000 based on whether “they were viewed
as expanding (liberal) or contracting (conservative) government at the time they were passed”
(Kelly 2008: 128). He finds that more “liberal” laws as well as a Democratic White House are
associated with a reduction in inequality as measured by the ratio of household income from the
top quintile divided by the household income from the bottom two quintiles (not a Gini
coefficient). He reports that “a one standard deviation increase in policy liberalism produces a
0.060 reduction in post-government inequality” (i.e., after removing the effects of transfer
programs), as well as a comparable association with party control of the White House (Kelly
2008:157). Interestingly, Kelly finds that Democratic administrations are associated with a
reduction in his measures of redistribution via transfer programs, but that the reduction in
inequality associated with these administrations comes from “market conditioning” programs,
such as tax credits, job training, and government spending on infrastructure and other projects.
Economists Thomas Philippon and Ariell Reshef (2012) analyze changes in wages in the
financial sector from 1909 to 2006, specifically investigating the role of financial deregulation.
They measure regulation by constructing an index of four deregulatory policies that began to
emerge starting roughly in the mid- to late-1970s: the lifting of state restrictions on interstate
banking; the removal of the Glass-Steagall Act’s separation of commercial and investment
banking; the lifting of limits on interest rates; and the ban on comingling banking with insurance.
They find that “deregulation is followed by increases in relative education, relative job
complexity, and relative wages” (Philippon and Reshef 2012: 1605). Wages highly correlate
with their deregulatory index, with the index explaining between 23 percent and 80 percent of
the variation in wages, depending on the model. Although Philippon and Reshef do not analyze
how deregulation affects inequality per se, to the extent that increased income in the financial
sector is driving growth in the top 1 percent, their results would suggest that deregulation in the
financial sector has contributed to income inequality. (They report that income in the finance
sector accounts for 15 to 25 percent of the post-1980 increase in wage inequality (Philippon and
Reshef 2012:1552)).
If certain regulatory changes correspond with changes in labor income in the financial
sector, might regulations in other sectors also systematically affect income – and thereby
contribute to inequality? I know of no such research that investigates the distributive effects of
other types of regulation, let alone any broad swath of regulatory policies of any kind.11
Indeed,
Robinson, Hammitt, Zeckhauser (2014) report that executive branch agencies themselves,
although obligated under presidential orders to report on the distributive impacts of their policies,
actually “provide little information on distribution, often simply noting that the regulation will
not adversely affect the health of children, minorities, and low-income groups.” Nevertheless, it
is possible to draw on a range of these agency regulatory impact analyses over time to conduct a
bounding exercise, which can reveal at least the potential for regulatory policy to have
significant impacts on overall patterns of inequality.
11
Research does exist on the effects of regulation on employment, particularly in the area of environmental
regulation, but results across several studies indicate at most only small aggregate effects (Coglianese, Finkel,
Carrigan 2013).
15. 15
The White House Office of Information and Regulatory Affairs (OIRA) has reported
aggregated estimates of annual benefits and costs from all major regulations adopted by
executive agencies across the federal government since 1987 to the latest data in 2012.12
Although these are only estimates of economic impacts, and we certainly do not know how the
estimated benefits and costs have affected households at different income levels, these data
suggest the potentially significant upper-bound effects that regulatory impacts could have on
inequality.13
In Figure 3, Panel 3a shows actual shares of income across each quintile, based on
Census data from 1987 to the present. If we were to assume that the impacts of all major
regulations since 1987 were completely regressive, Panel 3b shows what a hypothetical
adjustment of those estimated impacts would be if “corrected” progressively. In other words, the
construction of Panel 3b begins with an assumption that the present distribution of income in
Panel 3a reflects a fully “rigged” system in which all the estimated benefits of regulations accrue
as income to the top quintile, while all the estimated costs are borne in equal proportions by
Figure 3: Actual vs. Regulatory Adjusted Income Distribution
Source: Census; OMB.
12
OIRA’s estimates for the first decade are drawn from Hahn and Hird (1991).
13
The OIRA data are limited in a variety of ways: they are just estimates made before the regulations were issued,
not actual impacts determined after the fact; they only cover the most major rules; and they only include major rules
from executive branch agencies. This could mean, of course, that the full effects are even more pronounced than
what appear in Figure 3, if the assumptions underlying the Figure hold.
Panel 3a Panel 3b
0.00%
10.00%
20.00%
30.00%
40.00%
50.00%
60.00%
70.00%
80.00%
90.00%
100.00%
1987
1989
1991
1993
1995
1997
1999
2001
2003
2005
2007
2009
2011
US Income Share by Quintile
0.00%
10.00%
20.00%
30.00%
40.00%
50.00%
60.00%
70.00%
80.00%
90.00%
100.00%
1987
1989
1991
1993
1995
1997
1999
2001
2003
2005
2007
2009
2011
Simulated US Income Share by Quintile
16. 16
those in the bottom four quintiles and thereby reduce their income. Panel 3b shows what would
happen if this assumed total regressivity could be removed by subtracting the amount of the
benefits from the upper quintile income and moving them in equal proportions to the bottom four
quintiles, and then similarly shifting the costs from the bottom four quintiles to the upper
quintile. Although just a bounding exercise, the differences in Panel 3a and Panel 3b show the
potential for strikingly greater equality in the income distribution that might have been possible
under different assumptions about the distribution of regulatory impacts. Compared with the
actual Gini coefficient of 0.47 in 2012, the Gini coefficient for the hypothetically revised
economy can be estimated at 0.27, again under the extreme assumptions reflected in Panel 3b. If
these assumptions were to hold in reality, Figure 3 suggests that correcting the assumed bias in
regulatory outcomes would have not only generated an equalizing effect across quintiles, but that
it would have done much to reduce the direction toward expanding inequality, as the growth in
the upper quintile’s share of total income remains remarkably steady over time in Panel 3b. The
point of this exercise, of course, is not to demonstrate that regulatory policy does have any
particular across-the-board effect on inequality, but rather it is only to say that if biases in the
regulatory process do result in regressive outcomes in terms of income, the potential exists for
these to affect overall patterns of inequality, possibly in substantial ways.
Why Capture Really Can’t Explain Economic Inequality
Having a potential impact on inequality, then, is not the same as having an actual impact.
The data from OIRA’s reports are at best suggestive that a relationship could exist; nothing more
reliable can be drawn from them. The OIRA data, for one thing, represent estimates of economic
costs and economic benefits, in principle reflecting social value and opportunity costs, not what
gets reported as income to the IRS or Census Bureau. Although monetized, estimated benefits
do not necessarily translate into accrued income to anyone. They are just a monetized value of
anticipated benefits; a statistical life saved may be valued as a $7 million dollar benefit in a
federal agency’s regulatory impact analysis, but this does not mean than anyone would have filed
a tax return showing $7 million dollars more in income.14
Similarly, costs in impact analyses do
not always equate to pay cuts for executives or even reduced share prices. Federal automobile
safety regulations, for example, did increase the cost of building new cars, but auto
manufacturers also discovered that “safety sells,” with consumers willing to pay more for cars
with advanced safety technologies (White 1988).
Even assuming that estimated regulatory impacts did bear some relationship to the
Census and IRS income data reported by Piketty (2014) and others, the assumptions underlying
Panel 3b (Figure 3) are clearly radical ones. They imply that the benefits from air pollution
regulations, aviation safety regulations, and all the other major regulations adopted by the federal
government have been able to be cordoned off entirely from 80 percent of the population,
accruing only to the top 20 percent of income earners, and that the top 20 percent escaped paying
anything at all for any major federal regulation for the last quarter century. Such an assumption
14
Interestingly enough, the $7 million estimate of the value of the statistical life would probably have been
computed by wage income, using a risk-weighted wage differential across occupations. Thus, a connection does
exist between labor income and the monetized value of lives saved, but it is not one that makes its way in any clear
or direct fashion into the Census or tax data on income.
17. 17
is made more preposterous considering how many regulations protect public goods – that is, they
deliver benefits like clean air which by definition cannot be excluded from anyone. The costs
and benefits of major regulations, even if skewed, surely cannot be completely regressive.
The case for regulatory bias as a source of income inequality, though, does not flounder
simply because of the limitations of a concededly rough, bounding exercise. Rather, capture as
an explanation for inequality fails because what we know about regulatory politics simply does
not match the major patterns of inequality in the United States: namely, its derivation primarily
from the top 1%, its variation over time, and its distinctiveness when compared with other
countries. To suggest that capture fails to explain inequality is not to deny that regulatory bias
exists in the United States policy process. But recognizing bias is not to say that the system is
completely biased either. After all, business groups undeniably lose policy battles. Government
imposes extensive regulatory burdens that they oppose (e.g., Vogel 1987, Howard 2011).
Moreover, empirical research in domains like environmental regulation shows that despite their
dramatically skewed levels of participation “business interests do not exert an undue influence in
the rulemaking process” (Kamieniecki 2006).
The real issues are how large any policy bias might be, how that bias affects income
levels, and whether any variations in policy bias correspond to observed variations in income
levels. Finding regulatory biases in recent years does not preclude the possible existence of
similar regulatory biases throughout the entirety of the last century, nor does it preclude similar
biases in other countries. To sustain itself as persuasive explanation of inequality in the United
States, bias or capture needs temporally to track the widening gap in incomes that had begun in
the 1970s – after not having had such an effect in the 1950s or 1960s. Given how income
inequality in the U.S. compares with inequality elsewhere, we also should see evidence that
business interests exhibit greater influence over regulatory policy in the United States than in
other countries.
Stepping back, a case for capture as a cause of U.S. inequality hinges on three steps in a
explanatory chain: first, regulations need to deliver disproportionate value in terms of income to
select groups of individuals; second, those regulations and their value in terms of individual
income need to fit patterns of inequality, both longitudinally and cross-sectionally; and, finally,
regulations delivering disproportionate income value need to have originated mainly because or
have been influenced primarily by private interests, rather than being motivated by a public
objective. At each of these steps, the case for capture as an explanation for inequality is
exceedingly difficult to sustain. For some of these steps, supportive research is simply lacking, if
not impossible to obtain. For other steps, the weight of the evidence from highly-respected
research on regulatory policymaking runs directly and strikingly counter to what would be
expected if capture explained inequality in America.
Distribution of Regulatory Impact on Income
Researchers have long assumed that the first step in the explanatory chain is met,
although in fact we actually have little firm evidence of how regulations affect business value,
share prices, and ultimately individual income, especially across anything like a range of
regulations. In those instances where government estimates of regulatory costs have been
18. 18
studied after the fact and then compared with actual costs, they have not infrequently turned out
to be much lower than anticipated (Hammitt 2000; Harrington, Morgenstern and Nelson 1999;
Morgenstern and Landy 1997). The associated income effects that derive from regulatory
burdens, and their reduction, may similarly be misestimated – and are probably more likely to be,
since specific estimates are rarely attempted. Researchers tend at most to perform some hand-
waving about how business influence on the regulatory process presumably lowers costs, which
must obviously benefit the wealthy, but without making an effort to explain why or to estimate
by how much. Furthermore, how any business-influenced changes in regulation might translate
into increases in business profits and shareholder value – and then how these changes might
translate into the distribution of income to individuals – has not been systematically studied. No
doubt for an understandable reason: it is not an easy causal pathway to map, and many other
factors are surely at play.
Just as different regulations generate different aggregate levels of costs and benefits, they
also distribute these costs and benefits in different ways across the income spectrum. But these
distributional patterns remain to be identified (Robinson, Hammitt, and Zeckhauser 2014). The
best analyses of individual laws and regulations provide aggregate impact estimates, that is, of
overall costs and benefits from any given rule or of costs and benefits broken down by the type
or the industry or demographic subgroup affected. To know how much regulation factors into
the inequality picture, we need the distribution of impacts across income groups. Figure 4
illustrates what a distributional analysis of regulatory impacts could aim to generate: a portrait of
how the net benefits of regulation are distributed among individuals across the income
continuum. Some regulations could distribute impacts in highly unequal ways (Panel 4a), while
others in principle could affect every quintile the same (Panel 4b). For each regulation, a
“regulatory Gini” could be computed, allowing analysts and decision makers to compare
different regulations -- or regulatory options -- for their distributional properties. Only with this
kind of analysis could regulators ultimately start to aggregate impacts across the income
spectrum for a broad range of regulations. If many regulations with large net benefits tended to
look more like Panel 4a, this would support a conclusion that the rules in society were “rigged”
to advantage the rich. At present, those who claim the system is rigged now at least implicitly
assert that this is what the pattern looks like for most rules, or at least most high-impact rules. Of
course, what Figure 4 does not show is a possibility of outcomes that are “highly unequal” but in
a progressive direction. An example might be environmental regulations that improve conditions
most for – and thereby deliver more benefits to – residents of poorer neighborhoods who live
closest to highways or factories.
The net benefits of a regulation, as already noted, do not automatically equate to levels of
individual income, and yet income patterns are what commentators claim the regulatory rent-
seeking theory purports to explain. Converting non-market impacts, such as fatalities or
illnesses, into monetary terms generates controversy (e.g., Ackerman and Heinzerling 2005);
however, that controversy derives from monetizing these impacts, not determining how they
might affect individual incomes. We really do not know how most regulatory benefits,
monetized or otherwise, convert to annual income levels. That said, even if the net benefits of a
regulation had no direct effects on income, this does not mean that a pattern like that in Panel 4a
would not still be worrisome. Simply imagine a regulation that saved lives of those in the top
19. 19
Figure 4: Illustrative Distributional Patterns for Individual Regulations
income quintile but actually cost lives or otherwise impacted negatively those at the bottom
quintile, a risk-versus-risk tradeoff but with a highly skewed distribution of positive and negative
effects (Graham and Wiener 1997). This is really not at all imaginary. The well-known case
involving the U.S. Environmental Protection Agency’s setting of an air quality standard for
arsenic in the early 1980s fits the mold (Scott and Thompson 1988). The standard EPA
considered would have eliminated all known cancer risks from arsenic in the air in the Seattle
area, but it was expected to force the closure of the only remaining copper smelter in the United
States, the Asarco facility located in the working class town of Ruston, Washington, with the loss
of over 500 jobs. The benefits of cleaner air and reduced cancer risk would be shared with all
those in the vicinity, including the more well-to-do residents of nearby Vashon Island, while the
negative ramifications, including any mental or physical health effects from unemployment,
were confined to the less-well-off residents of Ruston.
The connection between regulation and income can be more than merely how regulatory
impacts are distributed across income groups. It could arise in other ways that only complicate
measurement. For example, irrespective of who enjoys more of the benefits of the cleaner air
delivered by an environmental regulation, such a regulation could have an indirect but
predictable effect on income. Research shows that cleaner air can lead to an increase in
children’s birth weights, and higher birth weights correlate with increased earnings for those
children when they become adults (Currie, Neidell, and Schmieder 2009; Black, Devereuz, and
Salvanes 2007). In the context of financial regulation, Philippon and Reshef (2012), as already
noted, find an association between deregulation and labor income. The regulatory variable they
use is a very crude composite index that basically tracks the enactment of just four financial
reforms; it is not a measure of those policies’ costs or benefits, let alone the costs and benefits of
all financial regulation. Yet strikingly, Philippon and Reshef do not theorize that incomes in the
finance sector increase because deregulation lowers costs to firms and thereby increases
managers’ income. Rather, they see deregulation as making the financial sector more
20. 20
competitive, resulting in greater innovation and complexity in financial products and
transactions. That complexity and competition increases the demand for highly skilled labor,
which in turn increases wages.15
Anyone seeking to understand a regulation’s impacts on
income needs to consider more than just the regulation’s estimated costs and benefits.
To be sure, sometimes estimating a regulation’s impact on incomes might be relatively
straightforward. Regulations can, at least occasionally, affect income levels directly. Income
taxes (if considered a form of “regulating” [Piketty 2014:469]), minimum wage laws, or
(proposed) legal limits on executive compensation are examples. But more typically, the income
effects of regulations are likely to be indirect, such as when air pollution laws affect birth
weights, which in turn affects adult wage earnings. Even for a rule that might touch closely to
income – namely one that compels greater disclosure of executive compensation (as some have
proposed) – the impact on incomes would be indirect, for any changes in income would only
arise if the enhanced disclosure led to behavioral change by boards of directors or perhaps
shareholders. At least in other contexts, the behavioral effects of information disclosure have
been found rather wanting (Ben-Shahar and Schneider 2014).
Depending on the particular regulation, indirect effects on incomes may be intended or
unintended, proximate or remote, attenuated or not. Each rule will surely be different, and
tracing out fully the effects of any regulation will be difficult if not impossible. Measuring all
the indirect effects of a regulation on income across the economy would require complex, hard-
to-validate general equilibrium modeling to capture all the potential ripple effects of a rule on
production costs, purchasing decisions, consumer demand, firm profits, employee compensation,
shareholder returns – and to do this for all the parts of the economy that are directly or indirectly
touched by the regulation. As Mannix (2013:196) observes in the context of tracing out the
effects of regulation on employment, “there are countless intervening elasticities that interact in
ways far too complex to model.” He continues that “[p]rices will rise or fall; firms may close or
open; workers may be laid off or be employed; land, capital, or patents may increase or decrease
in value as a result.” With such intractability, Mannix argues against trying to estimate
employment effects in regulatory impact analyses. Determining how a regulation enters into and
then affects a complex, dynamic economy to alter incomes and their distribution is not much
different. The analytical demands needed to assess claims about “job-killing” regulation may
have met their equal in the demands needed to evaluate claims about regulatory-induced income
inequality.16
15
They note that they “do not claim that all types of deregulation lead to higher wages. That can only be true for
changes that increase the demand for skills” (Philippon and Reshef 2012: 1589 n. 36). Indeed, they suggest that, of
the four financial regulatory policies they include in their index, the repeal of Glass-Steagall is doing most of the
explanatory work.
16
That said, by exploiting variation across jurisdictions, as well as relying on some unique datasets available on
certain regulatory-induced business costs, researchers have made progress in retrospectively studying the effects
certain kinds of regulation on employment, primarily with respect to environmental regulation and minimum wage
laws (Coglianese and Carrigan 2013; Morgenstern 2013). That line of research does offer some promising possible
avenues for the future study of regulation and income distribution writ large.
21. 21
Regulation and Regulatory Capture over Time
Although regulation’s effects on income can only be assumed, if regulation and
regulatory capture did explain inequality, we should expect to see changes in regulatory
phenomena corresponding with longitudinal patterns in income distribution. Yet notwithstanding
research linking high-level variables such as party control of the White House to measures of
inequality (Bartels 2008; Kelly 2008), we have virtually no evidence implicating regulatory rent-
seeking in this way.17
Quite the contrary, the accumulated work of regulatory scholars suggests
that regulation and regulatory capture moved in precisely the opposite direction of income
inequality in the mid-to-late 1970s, the crucial period when income inequality started to re-
emerge. Substantively, regulation in that period moved dramatically in a direction away from
whatever inequality either corrosive or anticompetitive capture would yield. In terms of politics
and process, U.S. regulatory policy if anything grew demonstrably less, not more, prone to
capture since the mid-1970s. And yet inequality still widened.
The examples most frequently cited in support of regulatory rent-seeking are of a rather
recent vintage. Stiglitz’s (2013) account, for example, comprises policies primarily adopted
since the 1960s: e.g., electricity deregulation in the 1990s; the repeal of Glass-Steagall in 1999;
business-friendly bankruptcy reform in 2005. But, as recounted earlier in this paper, the gap
between the rich and poor started widening decades earlier. To explain regulation’s contribution
to inequality, we need to know about regulation over a much longer time period. Did something
happen with regulation since the 1950s and 1960s that might have triggered and sustained
inequality starting in the 1970s?
Philippon and Reshef (2012) would seem to provide the best source of an answer because
they include a measure of financial deregulation that covers the extended time period of their
study, from 1909 to 2006. But much of their results, they report, are driven by what they term
the “Glass-Steagall effect” (1586). They “do not claim that all types of deregulation lead to
higher wages” (1589):
The GS [Glass-Steagall] dummy has particularly strong predictive power for relative
wages and for relative education. ... [T]hese results suggest that the Glass-Steagall Act is
the most important part of regulation. If this view is correct, the effects should be
concentrated on people working in a handful of affected institutions close to “Wall
Street”. [Our analysis] shows evidence in support of this view. (1586-87).
In particular, “[f]or top earners, the main effect of deregulation is probably the relaxing of the
Glass-Steagall Act” (1592).
17
Gilens (2012) also tests over time for general “policy responsiveness” to the views of the upper 10 percent, but his
principal data are from 1981 to 2002, leaving out the critical decade when income inequality began to rise. He does
report data on four years during the Johnson Administration, but finds low policy responsiveness across all income
groups during that earlier period.
22. 22
On top of the fact that Glass-Steagall reform did not occur until well after income
inequality started its dramatic widening, it is hard to see how Philippon and Reshef’s (2012)
study of financial deregulation could ever provide much support for regulation’s role in
explaining overall patterns of inequality. For one thing, the study’s measure of regulation – or
what the study’s authors call a “measure of financial deregulation” (1580) – is hardly a complete
measure even of financial regulation, let alone all regulation. It comprises an index based on
four regulatory policies, each of which moved in a deregulatory direction. Yet from 1909 to
2006 many other policies, both regulatory and deregulatory, changed in the financial sector. For
example, Philippon and Reshef’s study did not include new regulatory obligations imposed
following the savings and loan crisis in the late 1980s and early 1990s, nor the regulatory
burdens imposed on financial activity in the 2002 Sarbanes-Oxley Act that followed the Enron
and Worldcom scandals.
Furthermore, regulatory changes in the financial sector cannot really explain widening
inequality in America because of the simple fact that income in the financial sector makes up a
surprisingly small part of the income gains at the very top of the income strata, where most of the
widening has occurred. Notwithstanding all the attention paid to financial regulation since the
2007-2008 crisis, as well as the oft-made linkages between inequality and lax financial rules and
rule enforcement, “80 percent of the top income groups are not in finance, and the increase in the
proportion of high-earning Americans is explained primarily by the skyrocketing pay packages
of top managers of large firms in the nonfinancial as well as financial sectors” (Piketty 2014:
303).18
In addition, the most notable substantive changes to regulatory policies moved in a
direction opposite to what would be expected if capture were the cause of the takeoff in
inequality that followed the comparative distributional stasis of the 1950s and 1960s. To see
how this was so, recall the two types of capture: corrosive and anticompetitive. Carpenter and
Moss (2014:16) explain that “[c]orrosive capture occurs if organized firms render regulation less
robust than intended in legislation or than what the public interest would recommend.” For
example, when the environmental impacts of industrial activities are left unregulated, “the costs
show up as lower standards of living for ordinary Americans, the benefits as higher profits for
the oil and coal companies” (Stiglitz 2013: 124). The other kind of capture, anticompetitive,
means just what it says: reducing competition by “blocking entry into an industry” (Carpenter
and Moss 2014). Anticompetitive capture arises most clearly with monopolies created by
regulation, which enable the regulated firms to extract rents from consumers with presumably
clear implications for inequality.
If capture explains inequality, then when either kind of capture increases, inequality
should also increase. Correspondingly, when either kind of capture decreases, inequality should
decrease. And yet, the significant regulatory policy changes in the period proximate to the
widening of income inequality moved in a direction inconsistent with capture. Most of the major
18
Kaplan and Rauh (2009) have reported a smaller proportion, but their strategy limited their data to just the highest
five compensated individuals in publicly traded firms, and therefore they concede they only captured a small
minority of the overall top bracket.
23. 23
regulatory-induced monopolies, for example, were dismantled between 1975 and 1980 (Derthick
and Quirk 1985:5):
Trucking deregulation started to occur administratively in 1975, with legislation
passed in 1980 (Rothenberg 1994)
Airline deregulation took place in 1978 – both by administrative action and
legislation (Derthick and Quirk 1985)
Major strides toward railroad deregulation started with the Railroad Revitalization
and Regulatory Reform Act of 1976 and continued with the Staggers Rail Act of 1980
(Derthick and Quirk 1985: 14)
The Federal Communications Commission started loosening the market in
telecommunications services as early as 1968, with a steady stream of deregulatory
reforms culminating in a consent decree in January 1982
The Natural Gas Policy Act of 1978 started the phase-out of price controls in this
energy market
Overall, the 1970s ushered in a period of “increased competition among firms in previously
regulated sectors” (Vogel 1989: 299). Consumer prices in these regulated industries dropped
significantly (Reich 2007: 93-94). Rather than consolidating monopoly power through
regulation, the 1970s saw a dismantling of policies consistent with anticompetitive capture.
At the same time that the federal government dismantled anticompetitive rules, it adopted
a series of new laws combatting corrosive capture. Between 1969 and 1974, Congress passed a
series of major regulatory laws -- including the National Environmental Policy Act, the Clean
Air Act, the Occupational Safety and Health Act, the Consumer Product Safety Act, the Clean
Water Act, the Noise Pollution Control Act, the Equal Employment Opportunity Act, the
Employment Retirement Income Security Act -- to correct previously unregulated market
failures (Vogel 1983; see also Kagan 2007). Owing to these laws, “[f]or the first time in
American history, government regulators began routinely to shape and influence virtually every
important decision made by nearly every large firm” (Vogel 1983; see also Vogel 1987). Both in
terms of corrosion and anticompetitiveness, regulation looked markedly unlike what one would
expect from a captured policy process – and yet inequality still rose.19
The 1970s marked a clear shift in business-government relations compared with the
period preceding inequality’s liftoff. The relatively egalitarian 1950s and 1960s were hardly
devoid of capture. On the contrary, as the work of political scientists and historians like Samuel
Huntington, Marver Bernstein, Gabriel Kolko, and Theodore Lowi attested, business had
19
Although thoughtful commentators suggest that inequality can be explained by “policy drift” (Hacker and Pierson
2010), it is hard to envision a period more drift-free than the one proximate to inequality’s upward rise. Although
the Reagan administration came to power starting in 1981 with a mission of lessening regulatory burdens, the core
changes made to the legal infrastructure governing the market economy in the 1970s – less anticompetitive
regulation, more anti-corrosive laws than mid-century – remained intact. In other words, even though the Reagan
Administration proved relatively more friendly to business than the Carter Administration, the 1980s were still
markedly less favorable to business than the 1950s and 1960s, and yet those earlier decades were, in economic
terms, more egalitarian.
24. 24
established a track record of influencing policy for its own benefit well before the 1970s
(Huntington 1952; Bernstein 1955; Kolko 1963; Lowi 1969; see also Bauer, Pool, & Dexter
1963). In a speech in 1961, President Dwight Eisenhower famously warned of the dangers of a
“military-industrial complex.” It was 1971 when economist George Stigler published his classic
paper on capture, asserting that, “as a rule, regulation is acquired by the industry and is designed
and operated primarily for its benefit” (Stigler 1971:3; see also Carrigan and Coglianese 2015).
Political scientist David Vogel (1989) characterizes the more egalitarian mid-century as a
“period of business political resurgence” following the New Deal. Yet, as the Twentieth Century
moved into its final quarter, rather than maintaining cozy relationships, “overall industry-
government relations were more strained during most of the 1970s than at any time since the
Progressive Era” (Vogel 1983). Vogel (1987) observes that, “unlike in the past, when many
government regulations were initiated by various industries, ... regulations were adopted over the
strong opposition of most of the industries immediately affected by them.” Business did fare
better in relative terms once the 1970s were over, but it still never “regained the ‘privileged
position’ it held during those earlier decades” (Vogel 1987). And yet inequality marched
onward. Rather than capture moving in tandem with inequality, the two phenomena passed each
other in the night.
Also in the 1970s, lawyers and judges put in place a series of procedural changes to
make the regulatory process more resistant to capture. Governmental transparency widened and
deepened as government agencies were compelled to adhere to the requirements of the Freedom
of Information Act of 1966. Judicial oversight strengthened with the development of “hard
look” review in the 1971 case of Citizens to Preserve Overton Park v. Volpe. Legal standing
grew more generous through decisions in Sierra Club v. Morton in 1972 and U.S. v. SCRAP in
1973. As Merrill (1997:1043) explains:
The principal pathology emphasized during these years was “capture,” meaning
that agencies were regarded as being uniquely susceptible to domination by the
industry they were charged with regulating. Starting in the late 1960s, many
federal judges became convinced that agencies were prone to capture and related
defects and - more importantly - that they were in a position to do something
about it. In particular, these judges thought that by changing the procedural rules
that govern agency decisionmaking and by engaging in more aggressive review of
agency decisions they could force agencies to open their doors - and their minds -
to formerly unrepresented points of view, with the result that capture would be
eliminated or at least reduced.
And yet again, despite the creation of these new, anti-capture doctrines, inequality still rose.
The only trend that has moved in the same direction as inequality has been campaign
spending. Others make much of this parallel, and, on first impression, understandably so. After
all, the poor do not contribute to political campaigns. Most campaign contributions come from
those in the upper quarter of the income distribution (Verba, Schlozman, and Brady 1995). The
huge sums spent on political activities by uber-wealthy individuals like the Koch brothers are
now notorious. And the logic connecting campaign contributions to inequality seems
25. 25
straightforward: if politicians need more money to finance their campaigns, they face greater
incentives to win over their patrons by doling out policies that favor the wealthy. And yet,
despite many years’ worth of intense empirical research investigating a possible link between
campaign contributions and policy outcomes, nothing really solid has yet to be discovered. The
phenomenon is more complex than portrayed in sound bites about the power of moneyed
interests. Even following the Supreme Court’s decision in Citizens United v. FEC, one of the
leading specialists of the politics of inequality could correctly report that “[p]opular impressions
of a Congress for sale to the highest bidder, or an electoral system in which money is the singular
key to victory, are grossly oversimplified” (Gilens 2012). Even the uber-wealthy have no
guarantee of returns on their investments, as Sheldon Adelson can surely testify. In the 2012
election cycle, Adelson sunk $15 million into Newt Gingrich’s unsuccessful effort to win the
Republican nomination, $20 million in Mitt Romney's presidential campaign, and millions more
in unsuccessful congressional bids (Cline 2012). Of course, we cannot say that money makes no
difference whatsoever. But as a factor to explain policy outcomes that generate massive
inequality, campaign spending is not really more viable than traditional regulatory capture.
Interestingly, despite plenty of anecdotes of shockingly large campaign contributions, as a
percentage of GDP, overall levels of contributions really had not, at least as of a decade ago,
risen much at all over time (Ansolabehere, de Figueiredo, and Snyder 2003).
Trying to explain inequality on the basis of business influence fails to account for both
key variation and constancy over time. It certainly is true that those with greater resources enjoy
greater opportunities in the policy process. But that is nothing new. The political “chorus” sings
with an upper-class accent, as Schattschneider (1960) put it long before the rise in inequality.
That truism does not mean that business’s power will not fluctuate over time (Vogel 1989). Quite
the contrary, in the 1970s business lost much of its policy privilege – near the same time that
inequality started to increase. Looking at broad patterns over much of the last century, one could
perhaps not unreasonably speculate that regulatory capture might even be good for
egalitarianism.
Comparative Inequality and Regulatory Politics
Regulatory capture or rent-seeking faces the same problem when it comes to cross-
national variation. Research comparing the U.S. with other developed nations reveals an
American regulatory process that is less, not more, susceptible to rent-seeking -- precisely the
opposite of what one would expect if capture explained inequality. Indeed, regulatory processes
in various European countries have long been characterized as “corporatist” precisely due to the
close, even formally sanctioned, role business plays in making regulatory decisions. European
regulatory enforcement also tends to be characterized as more “cooperative,” in comparison to a
more “adversarial” American style (Bardach and Kagan 1982; Hawkins 1984; Coglianese and
Kagan 2007). As with the longitudinal trends, the crucial, and distinctive, variation in U.S.
inequality stands at odds with what emerges from a well-developed body of regulatory
scholarship.
Although comparative regulatory studies do not provide fine-grained, annual data such as
what might permit a differences-in-differences analysis, studies published from the early 1980s
to the 2000s do present a consistent portrait of the U.S. regulatory system as more formal,
26. 26
prescriptive, and conflictual than in other developed economies (Lundqvist 1980; Badaracco
1985; Brickman, Jasanoff, and Ilgen 1985; Vogel 1986; Rose-Ackerman 1995; Kagan 2001).
Political scientist Robert A. Kagan (2001:190) finds that “consultation between business
executive and regulatory officials is politically suspect” in the United States. Vogel (1987)
observes that “in no other capitalist democracy has the making and enforcement of government
regulation of corporate social conduct provoked as much contention between business and
government as in the United States.” These do not sound like properties of cozy business-
government relations consistent with an inference of greater capture in the United States. Even
if, as some have argued, Europe has begun more recently to exhibit similar conflictual properties
(Kelemen 2011), America reportedly remains “more deeply pervaded by legal conflict and by
political controversy about regulations, judicial decisions, legal processes, and institutions
(Kagan 2007:103).
Comparative assessments of business influence do not indicate that the U.S.’s
distinctively extreme inequality is accompanied by any distinctively extreme level of capture-
like behavior. Vogel (1996:319) reports that, “during the last three decades, business has
enjoyed the most influence in Japan followed by France, Germany, Great Britain, and the United
States, respectively.” As Piketty (2014:271-303) devotes an entire chapter to France and the
U.S., the latter having much greater inequality, it is instructive that Vogel (1996) finds business
influence greater in France than in the United States. Such relatively high business influence
appears to have been a rather constant fixture of the French political economy too. Vogel
(1996:309) reports that “French business was relatively unchallenged throughout the 1960s and
1970s.” With the 1981 election of a Socialist president, it appeared that business might face a
threat, and in fact the French government did nationalize about three dozen banks and about a
dozen major companies (Vogel 1996). But nationalization “was more symbolic than
substantive” (Vogel 1996:310). Apparently most of the nationalized banks and businesses were
already effectively bankrupt, so buying them out only helped the shareholders. Moreover, after
encountering some hard economic times, even the Socialist administration turned to a still more
moderate posture and “French policies during the remainder of the 1980s were highly supportive
of business” (Vogel 1996:310). If business influence drove inequality, one would expect France
to have greater inequality.
A collection of comparative case studies from the 1990s examined multinational
corporations’ interactions with different countries’ regulatory systems across a range of policy
areas (Kagan and Axelrad 2000). By holding the corporation constant while varying the
regulatory systems, researchers were able to draw more reliable inferences about different
regulatory systems’ styles. Despite some exceptions, the researchers discerned clear but
distinctive patterns of business-government interaction characterizing the U.S. regulatory regime.
In contrast to the European, Japanese, and Canadian systems included in the study, the U.S.
system was “more legally complex, more punitive, more unpredictable, and more costly to
comply with than their counterparts in other economically advanced democracies” (Kagan
2000a:23). The U.S. regulatory system fragmented policy authority more than did other
countries. In the U.S., “citizen and advocacy groups ... generally have more access to regulatory
processes and information and broader opportunities to make legal challenges to regulatory and
corporate decisions” (Kagan 2000a:23). These differences did not necessarily make the U.S.
system better. In many respects, the researchers found distinct disadvantages that seemed to
27. 27
derive from the U.S. system. Its adversarialism resulted in greater delays and costs of doing
business, without necessarily a lot of countervailing benefits. U.S. regulators did not seem to
yield any demonstrably greater substantive compliance or more socially responsible behavior on
the part of the corporations studied. Kagan (2000b) states that in some respects American
adversarial legalism was even counterproductive, as at times it engendered resistance and raised
animosities. And yet, despite adversarial legalism’s many identified flaws, the one potentially
distinctive virtue lay in its ability to resist the dangers of regulatory bias. Even “some
multinational corporations [the researchers] spoke with suggested that despite its additional costs
and inefficiencies, adversarial legalism helps ensure the integrity and evenhandedness of
American regulatory and legal processes” (Kagan 2000b: 405). Unlike with the “closed-door
corporatist decision making of many other nations, American adversarial legalism provides both
domestic and foreign companies greater assurance that they are competing on a level regulatory
playing field and that all business firms enjoy legal recourse against official arbitrariness or
favoritism” (Kagan 2000:405).
The implications for the capture theory of inequality seem rather clear. The U.S. process
is, if anything, more costly and burdensome for businesses, yet it generates, if anything, a greater
degree of protection against some of the ravages of rent-seeking. In at least one respect, Stiglitz
(2013:312,319) appears to agree, as he claims that the European Central Bank is captured by a
business mindset more significantly than even the U.S. Federal Reserve. And yet, if inequality
were substantially a function of capture, we should expect to see America exhibiting less, not
more, inequality than other developed economies.
It is possible, of course, that other differences between the United States and other
developed economies might explain America’s exceptional inequality. First, unions are
generally weaker in the United States than in other developed economies (e.g., Kagan 2007:104).
Hacker and Pierson (2010) give much emphasis to weak unions in their account of U.S.
inequality, but ultimately a weak labor movement hurts workers in the lower and even middle
class, rather than explains America’s extreme growth in the top 1 percent, which is what
accounts for most of the uptick in U.S. income inequality. It is hard to demonstrate how stronger
unions could do much to lower income greatly at the very upper extreme. Second, the U.S. has
demonstrably less generous redistributive tax and transfer policies than most other developed
countries: “U.S. social programs and tax policies reduce inequality less than do similar programs
and policies abroad, and they have done less to blunt the post-1970s increase in inequality”
(Hacker, Mettler, and Pinderhughes 2005:157). Unlike with unions, tax and transfer programs
can readily target the upper 1 percent. Indeed, to explain or moderate America’s extremely
divergent level of inequality, tax policy seems the more likely place to turn than to business
regulation generally or to the regulatory process.
Evidence of Rent
The final step of the explanatory chain – determining whether regulatory-induced income
disparities arose primarily from private interest pressures rather than a sincere pursuit of public
objectives – is not much easier to sustain than the other steps. It is seldom an easy task. But this
last step should not be overlooked because, as noted earlier, all policies will have disparate
impacts, winners as well as losers. Rents arise when private interests gain without a sufficient
28. 28
corresponding public interest gain -- and at a loss to others. Capture does not arise when a
regulation generates skewed impacts on income because these impacts were the incidental price
needing to be paid for advancing legitimate objectives, such as efficiency or other public-
interested values.20
A key challenge, obviously, lies in defining what counts as a legitimate public objective.
One could try to define it in terms of whatever emerges from the political process itself, either in
terms of specific, pertinent policy decisions or of relevant but general principles derived from
repeated democratic practice. Specific decisions could be easily susceptible to the very same
private interests under evaluation. For this reason, it is sometimes suggested that the benchmark
be based on “repeated actions” by an authoritative public body (Carpenter and Moss 2014:13).
Either way, relying on the political process to define public objectives becomes problematic if
that process is captured. The process, after all, is what the analyst is evaluating for capture. If
major agricultural companies, say, succeed in convincing the government to pass repeated laws
advantaging the farm industry, it would be circular to use those legislative actions to define the
benchmark against which to assess whether those very laws, which are obviously beneficial to
the farm industry, possess a reasonable public objective. The analyst needs some kind of
independent metric, and standard welfare economic principles (like those neatly summarized in
Executive Order 12,866 and in the Office of Management and Budget’s Circular A-4) offer a
reasonable option. No one should expect, of course, that such economic judgments will be
uncontestable. One must make a qualitative, but serious, analytical effort to evaluate possible
public objectives, and see if they stand up to close scrutiny as reasonably justifiable motivations
for policy action.
At a minimum, the justification behind a public rationale needs to be falsifiable, capable
of testing in some fashion, and based on a criterion which, of necessity, eliminates “tautological
or vacuous definitions” (Carpenter and Moss 2014). Such a minimal requirement may seem
obvious, but it bears noting because whenever one is assessing potential regulatory problems, “in
the hindsight of calamity, it is always possible to point to regulators and say that they failed”
(Carrigan and Coglianese 2012:5). After all, why did the government not prevent in the first
place what, in hindsight, is an obvious problem – at least if the government had not been
captured by those who stood to lose from the legal intervention that (again in hindsight) would
have eliminated or reduced the problem? If inequality has reached obnoxious proportions, then
on one view this must have been because policy makers drifted, failing to act to prevent income
levels from reaching extremes. Of course, inaction can have many causes, even if only one
seems obvious with the benefit of hindsight. The mere fact that inequality has arisen cannot,
except tautologically, constitute evidence of regulatory rent-seeking due simply to the failure to
put in place laws that would have prohibited skyrocketing incomes.
Without care, arguments about the failure to regulate executive compensation risk
perilously veering to tautology. Yes, agency problems can exist and might well help explain
20
Carpenter and Moss (2014:13) define capture as “the result or process by which regulation, in law or application,
is consistently or repeatedly directed away from the public interest and toward the interests of the regulated industry,
by the intent and action of the industry itself.”
29. 29
how some managers succeed in extracting rents from their companies’ compensation committees
(Bebchuk, Fried, and Walker 2002). But does that mean the policy process has been captured?
Piketty (2014:331-335) does not claim that regulation failed to control the fat tail of executive
pay, but he does argue that differences in “social norms” across countries explain the rise of
“supermanager” income in US and UK corporations but not Japanese or continental European
firms. The clearest evidence of such norms, of course, presumably rests with the same decisions
about executive pay that the norms are supposed to influence. Hacker and Pierson (2010:246-
47) more convincingly steer away from the shoals of tautology when they defend policy drift
over executive compensation by showing affirmative (vociferous) lobbying efforts aimed at
blocking regulation. Yet, the existence of even well-organized, self-interested opposition to
policy change does not necessarily mean that the status quo lacks a legitimate (even if
contestable) public-interested basis. The analyst would need to invest heavily in the substantive
debate over executive compensation reform to know how serious any underlying problem might
be and what the precise tradeoffs might be with different alternative solutions. The rationales
might well be misguided, but serious economic arguments do exist for the status quo on
executive compensation (e.g., Mankiw 2013). In the end, policy drift can be real but, much like
with the third face of power (Lukes 1974), confirmation may depend on intuition or other
subtleties. In much the same way, concepts like “cognitive capture” (Stiglitz 2013:59) and
“cultural capture” (Kwak 2014) make sense in theory, but complicate empirical demonstration.
As is already well-understood, what can be said about executive compensation can be
said about other policies: namely, that serious, substantive, public-interested arguments co-exist
and align with someone’s self-interest. Empiricists must therefore search carefully, probing
deeply into policy history. Consider, for instance, how a reflexive linkage between the growth of
the financial industry – “financialization” – and inequality can lead to a presumption that any
form of financial deregulation supports the capture thesis. After all, financialization, which
typically traces its origins to the lifting of interest rate caps in the early 1970s, tracks rather
closely the timing of inequality’s growth. Yet the early financial deregulatory move to lift
interest rate caps on savings accounts appears to have originated in something other than merely
industry’s self-interest. Sociologist Greta Krippner (2011:84) traces its origins to an effort “led
by organizations such as the Consumer Federation of America, Ralph Nader’s Public Citizen,
and the AAERP” – hardly water-carriers for the financial industry.
My purpose here is not to enter into a debate over, or an inquiry into, either interest rate
caps or executive compensation reform. Rather my purpose is simply twofold: first, as already
noted, to illustrate and caution against potential risks of tautological thinking. Second, and still
more importantly given an overarching motivation of this paper has been to assess how well
general regulatory process reforms might address inequality, it is to call attention to the inherent
necessity of making concrete, regulation-specific judgments when seeking truly to evaluate
capture and its potential contribution to inequality. Each law or regulation will vary not only in
how its costs and benefits are distributed, and not only in how it affects individual income. It
will also vary in the historical alignment of interest groups involved in the process of its
enactment (or its failure to be enacted). It will vary, too, in the kind, strength, and credibility of
possible public-minded justifications for whatever (skewed) outcomes eventually prevailed.
Given that someone will always benefit from a regulation and someone will always lose, it does
not make sense to characterize regulation writ large, or the regulatory system overall, as “rigged”