TREB's MARKET WATCH REPORT for SEPTEMBER 2018

Toronto Real Estate Board President Garry Bhaura announced that Greater Toronto Area REALTORS® reported 6,455 sales through TREB's MLS® System in September 2018 – up 1.9 per cent compared to September 2017. The average selling price for September 2018 sales was up by 2.9 per cent over the same period to $796,786. The MLS® HPI composite benchmark price was up by two per cent year-over-year. New listings entered into TREB's MLS® System in September 2018 amounted to 15,920 – down by 3.1 per cent compared to September 2017. With sales up year-over-year and new listings down, market conditions became tighter. Many buyers may have found it more difficult to find a home meeting their needs. "It is healthy to see sales and prices in many areas across the Greater Toronto Area up a bit, compared to last year's lows. At the same, however, it is important to remember that TREB's market area is made up of over 500 communities. Market conditions have obviously unfolded differently across these communities. This is why it's important to work with a REALTOR® who is familiar with local market conditions in your areas of interest," said Mr. Bhaura. "While higher borrowing costs and tougher mortgage qualification rules have kept sales levels off the record pace set in 2016, many households remain positive about home ownership as a quality long-term investment. As the GTA population continues to grow, the real challenge in the housing market will be supply rather than demand. The Toronto Real Estate Board is especially concerned with issues affecting housing supply as we move towards municipal elections across the region," added Mr. Bhaura. On a monthly basis, after preliminary seasonal adjustment, sales edged up by 0.2 per cent in September 2018 compared to August 2018. The average selling price, after preliminary seasonal adjustment, edged lower by 0.5 per cent month-over-month. "Generally speaking, annual rates of price growth have been stronger for higher density home types in 2018, including condominium apartments, townhouses and semi-detached houses. In many neighbourhoods, these home types provide more affordable home ownership options. This is why a policy focus on increasing mid-density housing options throughout the GTA is important," said Jason Mercer, TREB's Director of Market Analysis.

Recommandé
Recommandé
Contenu connexe
Plus de Shawn Venasse
Plus de Shawn Venasse (20)
Dernier
Dernier (20)
TREB's MARKET WATCH REPORT for SEPTEMBER 2018
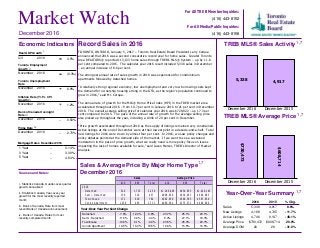
- 1. Toronto Employment Growth November 2016 (0.3%) Month December 2016 1 Year 3 Year 5 Year 3.14% 3.39% 4.64% December 2016 1 Year 3 Year 5 Year -- -- -- Market Watch For All TREB Member Inquiries: (416) 443-8158 For All Media/Public Inquiries: (416) 443-8152 Record Sales in 2016 TORONTO, ONTARIO, January 5, 2017 – Toronto Real Estate Board President Larry Cerqua announced that 2016 was a second consecutive record year for home sales. Greater Toronto Area REALTORS® reported 113,133 home sales through TREB’s MLS® System – up by 11.8 per cent compared to 2015. The calendar year 2016 result included 5,338 sales in December – an annual increase of 8.6 per cent. The strongest annual rate of sales growth in 2016 was experienced for condominium apartments followed by detached homes. “A relatively strong regional economy, low unemployment and very low borrowing costs kept the demand for ownership housing strong in the GTA, as the region’s population continued to grow in 2016,” said Mr. Cerqua. The annual rate of growth for the MLS® Home Price Index (HPI) in the TREB market area accelerated throughout 2016 – from 10.7 per cent in January 2016 to 21 per cent in December 2016. The overall average selling price for calendar year 2016 was $729,922 – up 17.3 per cent compared to 2015. The pace of the annual rate of growth for the average selling price also picked up throughout the year, including a climb of 20 per cent in December. “Price growth accelerated throughout 2016 as the supply of listings remained very constrained. Active listings at the end of December were at their lowest point in a decade-and-a-half. Total new listings for 2016 were down by almost four per cent. In 2016, we saw policy changes and policy debates pointed at the demand side of the market. If we want to see a sustained moderation in the pace of price growth, what we really need is more policy focus on issues impacting the lack of homes available for sale,” said Jason Mercer, TREB’s Director of Market Analysis. TREB MLS® Sales Activity 5,338 4,917 December 2016 December 2015 TREB MLS® Average Price $730,472 $608,714 December 2016 December 2015 Year-Over-Year Summary 2016 2015 % Chg. Sales New Listings Active Listings Average Price Average DOM 5,338 4,917 8.6% 4,188 4,745 -11.7% 4,746 9,137 -48.1% $730,472 $608,714 20.0% 20 29 -31.0% Sources and Notes: i - Statistics Canada, Quarter-over-quarter growth, annualized ii - Statistics Canada, Year-over-year growth for the most recently reported month iii - Bank of Canada, Rate from most recent Bank of Canada announcement iv - Bank of Canada, Rates for most recently completed month Real GDP Growth Q3 2016 3.5% Toronto Unemployment Rate November 2016 6.9% Inflation Rate (Yr./Yr. CPI Growth) November 2016 1.2% Bank of Canada Overnight Rate December 2016 -- 0.50% Prime Rate December 2016 -- 2.70% Economic Indicators Metrics Sales Average Price 416 905 Total 416 905 Total 2016 Detached Semi - Detached Townhouse Condo Apartment 526 1,733 2,259 $1,286,605 $934,055 $1,016,145 138 319 457 $808,920 $630,053 $684,065 172 610 782 $662,959 $566,395 $587,634 1,238 493 1,731 $466,592 $375,572 $440,669 Sales & Average Price By Major Home Type December 2016 December 2016 i ii ii iii iv Detached Semi - Detached Townhouse Condo Apartment 23.7% 25.1% 23.1% 8.4% 27.1% 18.3% 23.5% 25.3% 23.7% 16.6% 15.5% 16.5% Detached Semi - Detached Townhouse Condo Apartment -7.6% 12.0% 6.8% -11.5% 0.6% -3.4% -19.6% 6.1% -0.9% 19.5% 16.0% 18.5% 1,7 1,7 1,7 1,7 Year-Over-Year Per Cent Change Mortgage Rates
- 2. Toronto Real Estate Board Market Watch, December 2016 SALES BY PRICE RANGE AND HOUSE TYPE DECEMBER 2016 2 Price Range Detached Semi-Detached Att/Row/Twnhouse Condo Townhouse Condo Apt Link Co-op Apt Det Condo Co-ownership Apt Total $0 to $99,999 $100,000 to $199,999 $200,000 to $299,999 $300,000 to $399,999 $400,000 to $499,999 $500,000 to $599,999 $600,000 to $699,999 $700,000 to $799,999 $800,000 to $899,999 $900,000 to $999,999 $1,000,000 to $1,249,999 $1,250,000 to $1,499,999 $1,500,000 to $1,749,999 $1,750,000 to $1,999,999 $2,000,000+ 0 0 0 0 1 0 0 0 0 1 3 0 0 6 40 0 3 0 0 52 4 2 0 25 307 0 3 0 6 347 51 16 14 73 571 0 0 2 3 730 134 30 65 90 386 9 3 1 2 720 243 113 115 87 179 19 1 1 0 758 291 126 89 53 116 14 1 0 0 690 284 90 57 13 50 5 0 0 0 499 250 41 25 10 28 25 0 0 0 379 187 13 25 6 19 7 0 0 0 257 278 15 11 3 14 3 0 0 0 324 207 7 8 2 6 1 0 0 0 231 130 0 3 0 8 0 0 0 0 141 66 2 0 0 1 0 0 0 0 69 131 2 0 2 5 0 0 0 0 140 Price Range Detached Semi-Detached Att/Row/Twnhouse Condo Townhouse Condo Apt Link Co-op Apt Det Condo Co-ownership Apt Total $0 to $99,999 $100,000 to $199,999 $200,000 to $299,999 $300,000 to $399,999 $400,000 to $499,999 $500,000 to $599,999 $600,000 to $699,999 $700,000 to $799,999 $800,000 to $899,999 $900,000 to $999,999 $1,000,000 to $1,249,999 $1,250,000 to $1,499,999 $1,500,000 to $1,749,999 $1,750,000 to $1,999,999 $2,000,000+ 2 0 0 1 81 0 3 0 1 88 89 8 5 158 948 0 23 0 9 1,240 480 86 41 769 6,898 5 25 2 36 8,342 1,742 523 598 2,027 10,041 157 14 13 20 15,135 3,777 1,270 1,905 2,372 5,747 285 17 27 9 15,409 5,877 2,884 2,353 1,513 2,700 274 8 20 3 15,632 7,381 2,421 1,622 603 1,410 252 5 15 1 13,710 7,105 1,414 1,040 277 706 256 5 5 0 10,808 5,967 780 638 172 363 294 5 4 1 8,224 4,042 428 315 87 209 142 2 2 0 5,227 5,947 432 203 93 265 61 0 4 0 7,005 4,466 193 109 54 139 6 2 1 0 4,970 2,559 82 34 15 84 0 0 0 0 2,774 1,358 35 14 10 34 0 1 0 0 1,452 2,925 66 13 10 102 0 0 1 0 3,117 SALES BY PRICE RANGE AND HOUSE TYPE YEAR-TO-DATE, 2016 Total Sales Share of Total Sales Average Price 2,259 457 412 370 1,731 83 11 4 11 5,338 42.3% 8.6% 7.7% 6.9% 32.4% 1.6% 0.2% 0.1% 0.2% 100.0% $1,016,145 $684,065 $655,731 $511,808 $440,669 $719,543 $350,411 $454,700 $313,173 $730,472 Total Sales Share of Total Sales Average Price 53,717 10,622 8,890 8,161 29,727 1,732 110 94 80 113,133 47.5% 9.4% 7.9% 7.2% 26.3% 1.5% 0.1% 0.1% 0.1% 100.0% $974,698 $673,738 $621,601 $476,824 $416,252 $662,931 $408,150 $588,197 $302,462 $729,922 1,7 1,7
- 3. Toronto Real Estate Board Market Watch, December 2016 Number of Sales Dollar Volume Average Price Median Price New Listings SNLR (Trend) Active Listings Mos. Inv. (Trend) Avg. SP / LP Avg. DOM TREB Total Halton Region Burlington Halton Hills Milton Oakville Peel Region Brampton Caledon Mississauga City of Toronto Toronto West Toronto Central Toronto East York Region Aurora E. Gwillimbury Georgina King Markham Newmarket Richmond Hill Vaughan Whitchurch-Stouffville Durham Region Ajax Brock Clarington Oshawa Pickering Scugog Uxbridge Whitby Dufferin County Orangeville Simcoe County Adjala-Tosorontio Bradford West GwillimburyEssa Innisfil New Tecumseth 5,338 $3,899,257,117 730,472 $607,500 4,188 73.3% 4,746 1.1 101% 20 404 $328,376,002 812,812 $714,500 309 78.7% 439 1.1 100% 23 94 $69,834,995 742,925 $670,250 75 79.6% 116 1.1 98% 26 35 $23,413,290 668,951 $575,000 24 80.8% 59 1.2 98% 31 106 $72,460,729 683,592 $643,500 71 82.7% 65 0.8 101% 24 169 $162,666,988 962,527 $869,000 139 75.6% 199 1.2 100% 19 1,094 $704,672,866 644,125 $589,000 924 74.7% 904 1.0 101% 19 546 $335,299,654 614,102 $585,250 461 75.0% 362 0.8 100% 17 55 $50,063,890 910,253 $805,000 39 70.0% 93 1.7 96% 32 493 $319,309,322 647,686 $568,000 424 74.9% 449 1.1 101% 19 2,105 $1,495,195,673 710,307 $534,900 1,667 70.1% 2,012 1.4 102% 21 542 $331,020,506 610,739 $513,500 420 71.1% 560 1.4 101% 24 1,082 $855,574,703 790,734 $518,500 846 67.9% 1,085 1.6 101% 22 481 $308,600,464 641,581 $632,000 401 74.0% 367 0.9 104% 18 1,035 $968,051,714 935,316 $830,000 751 71.0% 873 1.1 101% 21 60 $58,236,213 970,604 $843,800 49 74.8% 56 0.8 103% 19 26 $19,164,500 737,096 $670,000 17 75.4% 33 1.5 102% 16 66 $36,560,213 553,943 $513,400 60 74.7% 76 1.2 99% 21 15 $21,092,400 1,406,160 $1,345,000 21 60.1% 84 2.7 100% 24 284 $263,264,626 926,988 $839,500 208 70.0% 195 1.1 102% 20 87 $73,869,688 849,077 $792,000 45 79.4% 39 0.7 100% 21 183 $192,181,622 1,050,173 $950,000 135 68.3% 142 1.1 103% 24 252 $242,537,008 962,448 $866,500 181 69.9% 205 1.1 101% 20 62 $61,145,444 986,217 $831,778 35 73.9% 43 1.1 99% 20 528 $301,465,534 570,957 $520,000 411 81.0% 337 0.7 102% 14 104 $60,549,287 582,205 $571,000 72 79.3% 47 0.6 102% 14 7 $3,569,100 509,871 $440,000 5 75.1% 17 2.5 98% 44 73 $37,563,005 514,562 $480,000 46 82.8% 51 0.7 102% 13 154 $72,587,754 471,349 $448,500 142 83.0% 75 0.5 104% 12 63 $44,143,576 700,692 $615,000 52 78.9% 49 0.8 102% 17 13 $6,856,800 527,446 $580,000 9 77.6% 21 1.4 98% 18 14 $16,637,000 1,188,357 $1,150,000 12 75.7% 31 1.8 97% 27 100 $59,559,012 595,590 $565,000 73 81.8% 46 0.5 103% 13 27 $12,538,300 464,381 $470,000 17 87.8% 14 0.7 100% 22 27 $12,538,300 464,381 $470,000 17 87.8% 14 0.7 100% 22 145 $88,957,028 613,497 $560,000 109 79.0% 167 1.3 99% 25 12 $7,368,999 614,083 $537,500 8 79.2% 24 2.2 97% 27 56 $39,194,429 699,901 $644,000 36 77.4% 37 0.9 101% 16 11 $4,664,800 424,073 $410,000 14 81.3% 22 1.3 98% 33 29 $17,346,900 598,169 $530,000 23 76.0% 48 1.4 97% 34 37 $20,381,900 550,862 $510,000 28 83.2% 36 1.2 97% 30 SUMMARY OF EXISTING HOME TRANSACTIONS ALL HOME TYPES, DECEMBER 2016 ALL TREB AREAS 3 1 1 1 2 5498 3
- 4. Toronto Real Estate Board Market Watch, December 2016 SUMMARY OF EXISTING HOME TRANSACTIONS ALL HOME TYPES, DECEMBER 2016 CITY OF TORONTO MUNICIPAL BREAKDOWN 4 Number of Sales Dollar Volume Average Price Median Price New Listings SNLR (Trend) Active Listings Mos. Inv. (Trend) Avg. SP / LP Avg. DOM TREB Total City of Toronto Total Toronto West Toronto W01 Toronto W02 Toronto W03 Toronto W04 Toronto W05 Toronto W06 Toronto W07 Toronto W08 Toronto W09 Toronto W10 Toronto Central Toronto C01 Toronto C02 Toronto C03 Toronto C04 Toronto C06 Toronto C07 Toronto C08 Toronto C09 Toronto C10 Toronto C11 Toronto C12 Toronto C13 Toronto C14 Toronto C15 Toronto East Toronto E01 Toronto E02 Toronto E03 Toronto E04 Toronto E05 Toronto E06 Toronto E07 Toronto E08 Toronto E09 Toronto E10 Toronto E11 5,338 $3,899,257,117 $730,472 $607,500 4,188 73.3% 4,746 1.1 101% 20 2,105 $1,495,195,673 $710,307 $534,900 1,667 70.1% 2,012 1.4 102% 21 542 $331,020,506 $610,739 $513,500 420 71.1% 560 1.4 101% 24 31 $22,925,094 $739,519 $570,000 18 75.1% 27 1.2 104% 19 34 $27,870,653 $819,725 $801,000 28 75.4% 24 0.9 104% 16 29 $18,092,327 $623,873 $650,000 28 75.7% 23 0.9 103% 19 65 $35,471,500 $545,715 $510,000 44 68.4% 53 1.5 98% 23 71 $37,827,800 $532,786 $560,000 72 67.9% 115 1.7 98% 26 114 $68,289,815 $599,033 $455,250 80 65.3% 142 1.9 100% 26 17 $20,745,000 $1,220,294 $1,225,000 15 72.0% 14 1.1 108% 20 89 $56,616,255 $636,138 $418,000 64 74.4% 77 1.4 103% 24 24 $13,236,049 $551,502 $639,000 20 74.1% 21 1.2 101% 22 68 $29,946,013 $440,383 $325,250 51 71.7% 64 1.3 98% 28 1,082 $855,574,703 $790,734 $518,500 846 67.9% 1,085 1.6 101% 22 340 $196,446,196 $577,783 $500,000 263 67.3% 346 1.7 101% 22 44 $48,772,761 $1,108,472 $769,000 45 55.0% 108 2.5 100% 20 26 $27,860,968 $1,071,576 $1,010,000 27 65.7% 40 1.5 108% 14 36 $58,961,200 $1,637,811 $1,760,350 38 66.0% 57 1.3 101% 23 27 $23,895,036 $885,001 $730,000 21 75.2% 19 1.1 107% 17 90 $79,531,664 $883,685 $580,500 65 68.5% 75 1.4 100% 25 103 $51,825,384 $503,159 $461,000 100 68.4% 135 1.6 100% 21 18 $19,789,500 $1,099,417 $777,500 13 67.7% 18 1.8 99% 24 35 $29,095,543 $831,301 $607,000 32 68.5% 34 1.3 104% 17 25 $15,512,605 $620,504 $329,900 24 76.4% 18 1.0 102% 18 31 $79,408,800 $2,561,574 $2,510,000 26 64.3% 49 2.1 102% 22 54 $52,204,780 $966,755 $576,500 31 75.7% 26 1.1 109% 15 128 $100,018,478 $781,394 $495,000 64 68.3% 88 1.6 99% 27 125 $72,251,788 $578,014 $406,000 97 70.3% 72 1.4 101% 22 481 $308,600,464 $641,581 $632,000 401 74.0% 367 0.9 104% 18 27 $23,647,201 $875,822 $835,000 17 77.3% 18 0.7 107% 14 34 $34,982,609 $1,028,900 $817,520 22 75.5% 25 0.9 105% 14 50 $39,370,100 $787,402 $804,750 34 76.5% 24 0.7 107% 16 62 $30,652,901 $494,402 $533,500 53 73.0% 36 0.9 102% 15 48 $27,996,300 $583,256 $487,900 50 72.5% 55 1.0 104% 24 16 $13,733,900 $858,369 $638,500 17 66.4% 20 0.9 101% 17 76 $43,600,176 $573,687 $473,750 55 71.2% 37 1.2 103% 19 36 $24,209,377 $672,483 $658,500 28 76.2% 31 0.9 101% 18 55 $27,873,900 $506,798 $445,000 41 76.3% 36 1.0 102% 20 31 $19,585,001 $631,774 $689,900 40 69.5% 44 1.1 104% 16 46 $22,948,999 $498,891 $507,500 44 76.7% 41 0.9 102% 18 1 1 1 2 8 3 9 4 5
- 5. Toronto Real Estate Board Market Watch, December 2016 SUMMARY OF EXISTING HOME TRANSACTIONS ALL HOME TYPES, YEAR-TO-DATE 2016 ALL TREB AREAS 5 Number of Sales Dollar Volume Average Price Median Price New Listings Avg. SP / LP Avg. DOM TREB Total Halton Region Burlington Halton Hills Milton Oakville Peel Region Brampton Caledon Mississauga City of Toronto Toronto West Toronto Central Toronto East York Region Aurora E. Gwillimbury Georgina King Markham Newmarket Richmond Hill Vaughan Whitchurch-Stouffville Durham Region Ajax Brock Clarington Oshawa Pickering Scugog Uxbridge Whitby Dufferin County Orangeville Simcoe County Adjala-Tosorontio Bradford West GwillimburyEssa Innisfil New Tecumseth 113,133 $82,578,210,100 $729,922 $602,000 154,266 103% 17 9,863 $7,962,817,620 $807,342 $690,000 12,528 101% 17 2,327 $1,610,967,527 $692,294 $629,900 2,924 100% 19 1,007 $638,450,601 $634,013 $585,000 1,247 100% 18 2,486 $1,597,013,453 $642,403 $612,000 3,007 102% 14 4,043 $4,116,386,039 $1,018,151 $890,000 5,350 101% 18 23,673 $14,589,119,479 $616,277 $570,000 31,701 101% 15 10,964 $6,410,388,107 $584,676 $560,000 14,627 101% 13 1,125 $898,516,864 $798,682 $739,000 1,606 99% 20 11,584 $7,280,214,508 $628,472 $569,900 15,468 102% 17 41,126 $30,461,427,754 $740,685 $564,900 58,648 103% 19 10,151 $6,568,742,634 $647,103 $575,000 14,269 103% 20 20,596 $17,201,674,662 $835,195 $515,000 30,355 103% 22 10,379 $6,691,010,458 $644,668 $640,000 14,024 106% 15 22,125 $20,888,848,980 $944,129 $835,000 31,180 103% 16 1,398 $1,336,762,358 $956,196 $850,500 1,869 104% 14 457 $357,174,645 $781,564 $699,900 606 100% 22 1,296 $674,282,478 $520,280 $489,000 1,736 100% 19 478 $616,468,692 $1,289,683 $1,167,500 795 98% 33 6,113 $5,891,666,220 $963,793 $875,000 8,735 105% 16 1,998 $1,555,963,562 $778,761 $740,650 2,517 103% 11 4,385 $4,773,042,675 $1,088,493 $998,000 6,421 104% 16 4,959 $4,677,115,028 $943,157 $853,000 7,093 102% 16 1,041 $1,006,373,322 $966,737 $818,000 1,408 101% 17 12,654 $6,755,063,860 $533,828 $503,000 15,623 104% 12 2,142 $1,249,950,661 $583,544 $560,000 2,700 105% 10 241 $97,678,627 $405,306 $334,900 321 98% 36 2,056 $975,884,485 $474,652 $448,000 2,484 103% 13 3,495 $1,550,502,967 $443,635 $420,000 4,213 105% 10 1,580 $977,606,818 $618,738 $580,000 2,003 103% 14 392 $218,837,120 $558,258 $499,950 505 99% 22 381 $296,681,963 $778,693 $710,000 503 99% 25 2,367 $1,387,921,219 $586,363 $559,900 2,894 105% 10 678 $305,157,927 $450,085 $437,500 772 101% 15 678 $305,157,927 $450,085 $437,500 772 101% 15 3,014 $1,615,774,480 $536,090 $497,000 3,814 99% 23 202 $124,237,510 $615,037 $567,000 255 98% 35 832 $535,521,301 $643,655 $610,000 1,075 100% 17 442 $193,342,074 $437,426 $398,200 544 99% 26 802 $401,879,648 $501,097 $465,000 1,055 99% 23 736 $360,793,947 $490,209 $454,000 885 100% 24 1 1 1 2 4 5
- 6. Toronto Real Estate Board Market Watch, December 2016 SUMMARY OF EXISTING HOME TRANSACTIONS ALL HOME TYPES, YEAR-TO-DATE 2016 CITY OF TORONTO MUNICIPAL BREAKDOWN 6 Number of Sales Dollar Volume Average Price Median Price New Listings Avg. SP / LP Avg. DOM TREB Total City of Toronto Total Toronto West Toronto W01 Toronto W02 Toronto W03 Toronto W04 Toronto W05 Toronto W06 Toronto W07 Toronto W08 Toronto W09 Toronto W10 Toronto Central Toronto C01 Toronto C02 Toronto C03 Toronto C04 Toronto C06 Toronto C07 Toronto C08 Toronto C09 Toronto C10 Toronto C11 Toronto C12 Toronto C13 Toronto C14 Toronto C15 Toronto East Toronto E01 Toronto E02 Toronto E03 Toronto E04 Toronto E05 Toronto E06 Toronto E07 Toronto E08 Toronto E09 Toronto E10 Toronto E11 113,133 $82,578,210,100 $729,922 $602,000 154,266 103% 17 41,126 $30,461,427,754 $740,685 $564,900 58,648 103% 19 10,151 $6,568,742,634 $647,103 $575,000 14,269 103% 20 686 $531,532,443 $774,829 $551,500 913 105% 20 908 $765,936,470 $843,542 $800,000 1,205 108% 14 749 $463,111,817 $618,307 $610,000 990 105% 14 926 $560,130,479 $604,893 $590,000 1,354 103% 19 1,337 $661,437,733 $494,718 $520,000 1,970 101% 24 1,699 $971,824,713 $571,998 $480,000 2,600 102% 24 362 $370,777,869 $1,024,248 $960,000 503 106% 15 1,959 $1,503,064,776 $767,261 $550,000 2,632 102% 21 536 $314,061,860 $585,936 $621,550 723 103% 18 989 $426,864,474 $431,612 $395,000 1,379 101% 20 20,596 $17,201,674,662 $835,195 $515,000 30,355 103% 22 6,625 $3,639,272,760 $549,324 $450,000 9,848 101% 23 835 $1,063,490,304 $1,273,641 $960,000 1,517 101% 22 594 $805,797,890 $1,356,562 $920,000 904 103% 17 945 $1,561,649,963 $1,652,540 $1,600,000 1,431 105% 15 473 $405,972,625 $858,293 $785,000 629 109% 20 1,611 $1,333,643,534 $827,836 $525,000 2,351 103% 21 2,108 $1,113,963,987 $528,446 $448,000 3,083 100% 22 355 $595,508,651 $1,677,489 $1,351,000 524 101% 22 670 $582,008,156 $868,669 $622,500 978 106% 17 492 $405,551,418 $824,292 $445,000 644 106% 16 539 $1,342,668,209 $2,491,036 $2,242,000 838 100% 27 945 $943,858,450 $998,792 $653,000 1,249 109% 17 2,328 $1,889,399,212 $811,598 $466,500 3,406 101% 24 2,076 $1,518,889,503 $731,642 $471,850 2,953 105% 21 10,379 $6,691,010,458 $644,668 $640,000 14,024 106% 15 894 $748,171,910 $836,881 $807,200 1,156 110% 10 745 $702,457,338 $942,896 $820,000 987 107% 12 974 $776,137,720 $796,856 $780,000 1,273 110% 12 1,191 $656,643,879 $551,338 $613,000 1,632 105% 15 1,198 $781,768,975 $652,562 $582,500 1,652 107% 15 377 $286,958,479 $761,163 $698,000 568 105% 13 1,203 $668,132,385 $555,389 $510,000 1,690 105% 19 709 $427,767,199 $603,339 $640,000 931 105% 14 1,419 $673,056,862 $474,318 $412,000 1,860 103% 18 730 $501,584,087 $687,101 $692,250 1,050 104% 14 939 $468,331,624 $498,756 $505,000 1,225 104% 15 1 1 1 2 4 5
- 7. Toronto Real Estate Board Market Watch, December 2016 SUMMARY OF EXISTING HOME TRANSACTIONS DETACHED HOUSES, DECEMBER 2016 ALL TREB AREAS 7 Sales Dollar Volume Average Price Median Price New Listings Active Listings Avg. SP / LP Avg. DOM TREB Total Halton Region Burlington Halton Hills Milton Oakville Peel Region Brampton Caledon Mississauga City of Toronto Toronto West Toronto Central Toronto East York Region Aurora E. Gwillimbury Georgina King Markham Newmarket Richmond Hill Vaughan Whitchurch-Stouffville Durham Region Ajax Brock Clarington Oshawa Pickering Scugog Uxbridge Whitby Dufferin County Orangeville Simcoe County Adjala-Tosorontio Bradford West GwillimburyEssa Innisfil New Tecumseth 2,259 $2,295,471,655 $1,016,145 $843,600 1,736 2,224 101% 20 228 $232,697,011 $1,020,601 $899,450 163 281 99% 27 56 $50,319,150 $898,556 $815,000 43 74 97% 27 29 $20,831,290 $718,320 $680,000 20 56 98% 35 45 $38,977,495 $866,167 $778,000 34 47 101% 40 98 $122,569,076 $1,250,705 $1,155,500 66 104 100% 19 473 $407,472,072 $861,463 $770,000 400 512 100% 20 292 $211,453,357 $724,155 $695,000 252 237 100% 18 44 $43,376,490 $985,829 $897,500 36 80 96% 37 137 $152,642,225 $1,114,177 $935,000 112 195 101% 21 526 $676,754,364 $1,286,605 $997,000 416 488 103% 19 165 $165,447,400 $1,002,712 $850,000 129 167 102% 22 160 $329,420,199 $2,058,876 $1,742,000 120 183 103% 19 201 $181,886,765 $904,909 $800,000 167 138 104% 16 559 $675,626,300 $1,208,634 $1,125,000 393 530 101% 21 28 $36,917,156 $1,318,470 $1,243,400 18 28 104% 15 22 $17,130,000 $778,636 $697,500 14 32 102% 16 63 $35,106,213 $557,241 $513,900 54 69 99% 20 13 $19,988,000 $1,537,538 $1,345,000 20 77 100% 24 115 $163,098,933 $1,418,252 $1,335,000 80 78 101% 19 57 $56,050,800 $983,347 $900,000 24 22 100% 23 85 $131,654,434 $1,548,876 $1,360,000 71 78 104% 22 130 $164,874,320 $1,268,264 $1,108,000 88 111 101% 21 46 $50,806,444 $1,104,488 $886,000 24 35 99% 22 341 $218,466,080 $640,663 $600,000 264 253 102% 16 56 $38,396,488 $685,652 $660,000 38 25 102% 14 6 $3,268,100 $544,683 $477,550 5 17 98% 51 48 $27,462,250 $572,130 $521,750 32 40 101% 15 109 $56,511,554 $518,455 $480,000 95 57 104% 12 33 $28,496,088 $863,518 $765,000 27 36 101% 21 12 $6,481,900 $540,158 $602,500 8 21 98% 19 14 $16,637,000 $1,188,357 $1,150,000 11 29 97% 27 63 $41,212,700 $654,170 $638,000 48 28 103% 15 17 $9,795,500 $576,206 $567,500 10 10 100% 13 17 $9,795,500 $576,206 $567,500 10 10 100% 13 115 $74,660,328 $649,220 $585,000 90 150 98% 26 12 $7,368,999 $614,083 $537,500 8 24 97% 27 40 $30,543,029 $763,576 $707,500 27 31 100% 17 9 $3,889,800 $432,200 $465,000 11 20 97% 37 28 $16,811,900 $600,425 $520,000 22 43 97% 35 26 $16,046,600 $617,177 $536,250 22 32 97% 26 1 2 3 4 51 1 1
- 8. Toronto Real Estate Board Market Watch, December 2016 SUMMARY OF EXISTING HOME TRANSACTIONS DETACHED HOUSES, DECEMBER 2016 CITY OF TORONTO MUNICIPAL BREAKDOWN 8 Sales Dollar Volume Average Price Median Price New Listings Active Listings Avg. SP / LP Avg. DOM TREB Total City of Toronto Total Toronto West Toronto W01 Toronto W02 Toronto W03 Toronto W04 Toronto W05 Toronto W06 Toronto W07 Toronto W08 Toronto W09 Toronto W10 Toronto Central Toronto C01 Toronto C02 Toronto C03 Toronto C04 Toronto C06 Toronto C07 Toronto C08 Toronto C09 Toronto C10 Toronto C11 Toronto C12 Toronto C13 Toronto C14 Toronto C15 Toronto East Toronto E01 Toronto E02 Toronto E03 Toronto E04 Toronto E05 Toronto E06 Toronto E07 Toronto E08 Toronto E09 Toronto E10 Toronto E11 2,259 $2,295,471,655 $1,016,145 $843,600 1,736 2,224 101% 20 526 $676,754,364 $1,286,605 $997,000 416 488 103% 19 165 $165,447,400 $1,002,712 $850,000 129 167 102% 22 7 $10,239,000 $1,462,714 $1,600,000 7 8 107% 7 12 $12,982,400 $1,081,867 $1,050,000 7 5 107% 12 17 $11,433,327 $672,549 $661,000 17 14 103% 18 25 $21,272,000 $850,880 $745,000 18 27 98% 26 14 $12,927,000 $923,357 $804,000 13 23 95% 25 20 $23,654,268 $1,182,713 $1,089,444 5 15 99% 26 15 $19,931,000 $1,328,733 $1,259,000 14 12 108% 16 21 $28,358,055 $1,350,384 $1,213,000 19 36 106% 29 10 $7,915,350 $791,535 $782,500 9 7 103% 17 24 $16,735,000 $697,292 $675,000 20 20 99% 26 160 $329,420,199 $2,058,876 $1,742,000 120 183 103% 19 1 $1,540,000 $1,540,000 $1,540,000 1 5 103% 0 3 $5,416,000 $1,805,333 $1,900,000 3 8 101% 11 12 $16,857,683 $1,404,807 $1,243,000 7 11 113% 12 23 $48,717,000 $2,118,130 $1,900,000 23 30 102% 21 12 $17,392,036 $1,449,336 $1,416,000 7 3 110% 17 26 $45,161,800 $1,736,992 $1,650,500 16 23 100% 21 1 $1,400,000 $1,400,000 $1,400,000 1 2 97% 62 4 $8,847,000 $2,211,750 $1,895,000 3 8 96% 55 5 $9,057,000 $1,811,400 $1,700,000 3 1 112% 14 5 $8,198,000 $1,639,600 $1,353,000 2 1 103% 16 20 $69,286,000 $3,464,300 $3,159,500 22 43 102% 20 18 $36,329,680 $2,018,316 $1,714,000 5 4 112% 13 18 $41,670,000 $2,315,000 $2,145,000 16 35 98% 23 12 $19,548,000 $1,629,000 $1,549,000 11 9 104% 12 201 $181,886,765 $904,909 $800,000 167 138 104% 16 8 $8,842,688 $1,105,336 $994,444 2 5 102% 24 14 $19,671,400 $1,405,100 $1,177,750 4 4 103% 23 26 $25,319,800 $973,838 $834,000 19 12 107% 11 25 $18,005,500 $720,220 $701,000 30 16 102% 14 10 $11,149,200 $1,114,920 $1,125,250 9 12 107% 11 12 $12,005,900 $1,000,492 $811,450 10 10 100% 22 26 $23,934,276 $920,549 $861,000 21 11 106% 17 18 $17,753,900 $986,328 $837,500 18 19 101% 18 25 $17,738,000 $709,520 $710,000 17 11 103% 21 24 $17,867,501 $744,479 $741,000 29 28 105% 10 13 $9,598,600 $738,354 $685,000 8 10 102% 20 1 1 1 1 2 3 4 5
- 9. Toronto Real Estate Board Market Watch, December 2016 SUMMARY OF EXISTING HOME TRANSACTIONS SEMI-DETACHED HOUSES, DECEMBER 2016 ALL TREB AREAS 9 Sales Dollar Volume Average Price Median Price New Listings Active Listings Avg. SP / LP Avg. DOM TREB Total Halton Region Burlington Halton Hills Milton Oakville Peel Region Brampton Caledon Mississauga City of Toronto Toronto West Toronto Central Toronto East York Region Aurora E. Gwillimbury Georgina King Markham Newmarket Richmond Hill Vaughan Whitchurch-Stouffville Durham Region Ajax Brock Clarington Oshawa Pickering Scugog Uxbridge Whitby Dufferin County Orangeville Simcoe County Adjala-Tosorontio Bradford West GwillimburyEssa Innisfil New Tecumseth 457 $312,617,753 $684,065 $648,000 345 192 103% 14 24 $15,672,135 $653,006 $642,500 12 7 101% 19 5 $3,159,400 $631,880 $659,900 0 1 98% 41 1 $549,000 $549,000 $549,000 1 0 110% 7 10 $6,252,000 $625,200 $613,000 5 1 99% 12 8 $5,711,735 $713,967 $719,368 6 5 104% 16 174 $106,482,451 $611,968 $610,000 148 79 103% 12 104 $59,703,751 $574,075 $569,500 85 45 102% 13 3 $1,855,000 $618,333 $600,000 0 6 99% 18 67 $44,923,700 $670,503 $667,000 63 28 104% 11 138 $111,630,980 $808,920 $730,000 107 77 104% 15 52 $35,608,041 $684,770 $650,000 43 33 101% 19 35 $37,049,036 $1,058,544 $887,000 29 26 105% 13 51 $38,973,903 $764,194 $731,313 35 18 107% 14 74 $57,576,387 $778,059 $749,000 44 13 102% 15 4 $3,104,799 $776,200 $717,400 3 5 101% 6 0 - - - 0 0 - - 1 $545,000 $545,000 $545,000 0 0 101% 6 0 - - - 1 1 - - 15 $12,535,300 $835,687 $808,000 10 1 107% 15 14 $8,729,888 $623,563 $616,500 10 1 100% 14 12 $10,782,000 $898,500 $796,500 5 1 101% 22 25 $19,764,400 $790,576 $756,800 14 4 102% 15 3 $2,115,000 $705,000 $720,000 1 0 105% 8 37 $16,981,400 $458,957 $463,000 28 15 105% 10 7 $4,044,000 $577,714 $600,000 4 7 106% 5 0 - - - 0 0 - - 3 $1,269,500 $423,167 $440,000 1 0 103% 8 13 $4,517,500 $347,500 $356,000 11 1 107% 11 6 $3,318,000 $553,000 $552,000 6 4 101% 14 1 $374,900 $374,900 $374,900 1 0 100% 1 0 - - - 0 0 - - 7 $3,457,500 $493,929 $480,000 5 3 107% 9 1 $432,000 $432,000 $432,000 1 0 102% 5 1 $432,000 $432,000 $432,000 1 0 102% 5 9 $3,842,400 $426,933 $415,000 5 1 101% 18 0 - - - 0 0 - - 4 $1,858,400 $464,600 $465,000 2 1 103% 9 1 $365,000 $365,000 $365,000 1 0 103% 5 0 - - - 0 0 - - 4 $1,619,000 $404,750 $407,500 2 0 99% 31 1 1 1 1 2 3 4 5
- 10. Toronto Real Estate Board Market Watch, December 2016 SUMMARY OF EXISTING HOME TRANSACTIONS SEMI-DETACHED HOUSES, DECEMBER 2016 CITY OF TORONTO MUNICIPAL BREAKDOWN 10 Sales Dollar Volume Average Price Median Price New Listings Active Listings Avg. SP / LP Avg. DOM TREB Total City of Toronto Total Toronto West Toronto W01 Toronto W02 Toronto W03 Toronto W04 Toronto W05 Toronto W06 Toronto W07 Toronto W08 Toronto W09 Toronto W10 Toronto Central Toronto C01 Toronto C02 Toronto C03 Toronto C04 Toronto C06 Toronto C07 Toronto C08 Toronto C09 Toronto C10 Toronto C11 Toronto C12 Toronto C13 Toronto C14 Toronto C15 Toronto East Toronto E01 Toronto E02 Toronto E03 Toronto E04 Toronto E05 Toronto E06 Toronto E07 Toronto E08 Toronto E09 Toronto E10 Toronto E11 457 $312,617,753 $684,065 $648,000 345 192 103% 14 138 $111,630,980 $808,920 $730,000 107 77 104% 15 52 $35,608,041 $684,770 $650,000 43 33 101% 19 1 $632,500 $632,500 $632,500 1 3 93% 7 8 $6,508,253 $813,532 $808,500 5 5 105% 14 8 $5,213,000 $651,625 $650,000 10 8 103% 14 3 $1,928,000 $642,667 $657,000 1 0 99% 11 21 $13,343,000 $635,381 $621,000 16 14 100% 25 4 $3,246,788 $811,697 $714,950 4 3 103% 12 0 - - - 0 0 - - 3 $2,120,000 $706,667 $720,000 1 0 101% 30 2 $1,410,500 $705,250 $705,250 2 0 99% 12 2 $1,206,000 $603,000 $603,000 3 0 101% 21 35 $37,049,036 $1,058,544 $887,000 29 26 105% 13 7 $9,190,836 $1,312,977 $1,274,036 4 6 108% 20 1 $916,500 $916,500 $916,500 3 6 122% 3 3 $3,271,000 $1,090,333 $1,286,000 0 2 99% 15 2 $2,968,700 $1,484,350 $1,484,350 1 1 109% 7 2 $1,515,000 $757,500 $757,500 1 0 98% 6 2 $1,769,000 $884,500 $884,500 3 4 109% 11 0 - - - 0 0 - - 0 - - - 2 3 - - 3 $5,083,000 $1,694,333 $1,358,000 1 2 102% 8 1 $850,000 $850,000 $850,000 1 0 106% 7 1 $1,000,000 $1,000,000 $1,000,000 1 0 108% 4 4 $3,143,000 $785,750 $740,000 3 0 103% 22 0 - - - 0 1 - - 9 $7,342,000 $815,778 $846,000 9 1 102% 9 51 $38,973,903 $764,194 $731,313 35 18 107% 14 11 $9,025,413 $820,492 $761,000 8 6 109% 10 12 $10,590,389 $882,532 $791,250 8 3 108% 8 10 $8,030,000 $803,000 $822,500 5 3 108% 15 5 $2,838,101 $567,620 $558,000 5 2 105% 18 3 $2,181,000 $727,000 $750,000 3 0 108% 8 1 $642,000 $642,000 $642,000 1 0 109% 6 4 $2,589,000 $647,250 $673,500 0 0 98% 35 1 $645,000 $645,000 $645,000 1 1 110% 6 1 $645,000 $645,000 $645,000 0 0 99% 7 0 - - - 1 1 - - 3 $1,788,000 $596,000 $590,000 3 2 98% 21 1 1 1 1 2 3 4 5
- 11. Toronto Real Estate Board Market Watch, December 2016 SUMMARY OF EXISTING HOME TRANSACTIONS CONDOMINIUM TOWNHOUSES, DECEMBER 2016 ALL TREB AREAS 11 Sales Dollar Volume Average Price Median Price New Listings Active Listings Avg. SP / LP Avg. DOM TREB Total Halton Region Burlington Halton Hills Milton Oakville Peel Region Brampton Caledon Mississauga City of Toronto Toronto West Toronto Central Toronto East York Region Aurora E. Gwillimbury Georgina King Markham Newmarket Richmond Hill Vaughan Whitchurch-Stouffville Durham Region Ajax Brock Clarington Oshawa Pickering Scugog Uxbridge Whitby Dufferin County Orangeville Simcoe County Adjala-Tosorontio Bradford West GwillimburyEssa Innisfil New Tecumseth 370 $189,368,906 $511,808 $491,250 335 269 102% 17 38 $18,730,000 $492,895 $475,750 34 31 101% 17 16 $8,353,500 $522,094 $495,000 9 6 100% 23 3 $980,000 $326,667 $310,000 1 0 95% 15 1 $365,000 $365,000 $365,000 2 2 106% 9 18 $9,031,500 $501,750 $469,000 22 23 102% 13 129 $61,081,179 $473,498 $476,000 96 56 103% 18 35 $13,548,250 $387,093 $370,000 20 15 101% 24 0 - - - 0 0 - - 94 $47,532,929 $505,669 $521,500 76 41 103% 15 119 $67,813,828 $569,864 $515,000 121 120 102% 19 31 $13,089,064 $422,228 $390,000 41 47 103% 18 49 $36,667,488 $748,316 $627,000 40 38 101% 19 39 $18,057,276 $463,007 $482,000 40 35 103% 19 46 $27,684,200 $601,830 $603,000 51 45 101% 17 7 $3,333,500 $476,214 $447,500 15 10 103% 14 0 - - - 0 0 - - 0 - - - 1 1 - - 0 - - - 0 0 - - 21 $12,955,700 $616,938 $600,000 18 15 102% 14 5 $2,856,000 $571,200 $560,000 4 7 99% 22 3 $1,953,000 $651,000 $628,000 3 3 96% 50 10 $6,586,000 $658,600 $640,000 9 8 100% 12 0 - - - 1 1 - - 36 $13,467,199 $374,089 $370,450 32 16 106% 11 9 $3,537,899 $393,100 $379,900 3 0 107% 11 0 - - - 0 0 - - 2 $610,000 $305,000 $305,000 1 1 100% 20 13 $4,003,800 $307,985 $299,500 14 6 106% 7 9 $4,113,000 $457,000 $440,000 9 5 104% 14 0 - - - 0 0 - - 0 - - - 1 1 - - 3 $1,202,500 $400,833 $352,500 4 3 108% 11 1 $310,000 $310,000 $310,000 1 1 101% 2 1 $310,000 $310,000 $310,000 1 1 101% 2 1 $282,500 $282,500 $282,500 0 0 97% 42 0 - - - 0 0 - - 0 - - - 0 0 - - 0 - - - 0 0 - - 0 - - - 0 0 - - 1 $282,500 $282,500 $282,500 0 0 97% 42 1 1 1 1 2 3 4 5
- 12. Toronto Real Estate Board Market Watch, December 2016 SUMMARY OF EXISTING HOME TRANSACTIONS CONDOMINIUM TOWNHOUSES, DECEMBER 2016 CITY OF TORONTO MUNICIPAL BREAKDOWN 12 Sales Dollar Volume Average Price Median Price New Listings Active Listings Avg. SP / LP Avg. DOM TREB Total City of Toronto Total Toronto West Toronto W01 Toronto W02 Toronto W03 Toronto W04 Toronto W05 Toronto W06 Toronto W07 Toronto W08 Toronto W09 Toronto W10 Toronto Central Toronto C01 Toronto C02 Toronto C03 Toronto C04 Toronto C06 Toronto C07 Toronto C08 Toronto C09 Toronto C10 Toronto C11 Toronto C12 Toronto C13 Toronto C14 Toronto C15 Toronto East Toronto E01 Toronto E02 Toronto E03 Toronto E04 Toronto E05 Toronto E06 Toronto E07 Toronto E08 Toronto E09 Toronto E10 Toronto E11 370 $189,368,906 $511,808 $491,250 335 269 102% 17 119 $67,813,828 $569,864 $515,000 121 120 102% 19 31 $13,089,064 $422,228 $390,000 41 47 103% 18 1 $814,041 $814,041 $814,041 0 0 105% 18 2 $852,000 $426,000 $426,000 5 5 100% 10 0 - - - 0 0 - - 2 $766,000 $383,000 $383,000 2 4 100% 21 11 $3,595,900 $326,900 $355,000 24 30 100% 15 5 $3,101,310 $620,262 $623,910 3 1 112% 23 0 - - - 0 0 - - 3 $1,338,000 $446,000 $420,000 3 2 103% 12 1 $638,000 $638,000 $638,000 1 3 100% 5 6 $1,983,813 $330,636 $356,000 3 2 99% 26 49 $36,667,488 $748,316 $627,000 40 38 101% 19 7 $6,749,300 $964,186 $785,000 9 16 101% 22 2 $3,726,000 $1,863,000 $1,863,000 5 5 100% 4 1 $873,500 $873,500 $873,500 0 1 97% 55 0 - - - 0 0 - - 0 - - - 0 0 - - 6 $3,046,388 $507,731 $522,194 6 6 101% 18 2 $1,285,000 $642,500 $642,500 0 1 98% 27 0 - - - 1 1 - - 1 $590,000 $590,000 $590,000 0 0 103% 8 1 $303,000 $303,000 $303,000 0 1 98% 7 6 $6,075,800 $1,012,633 $1,071,500 2 1 102% 29 0 - - - 0 0 - - 8 $5,406,500 $675,813 $717,500 1 1 101% 27 15 $8,612,000 $574,133 $620,000 16 5 104% 10 39 $18,057,276 $463,007 $482,000 40 35 103% 19 1 $617,000 $617,000 $617,000 2 5 99% 23 4 $2,415,500 $603,875 $606,750 3 2 106% 6 0 - - - 0 0 - - 5 $2,605,000 $521,000 $517,000 6 5 101% 6 6 $3,049,000 $508,167 $512,500 10 13 100% 31 0 - - - 0 0 - - 6 $2,976,500 $496,083 $503,750 5 0 106% 19 3 $1,084,777 $361,592 $335,000 1 0 108% 16 6 $2,568,000 $428,000 $434,000 2 2 99% 22 3 $850,000 $283,333 $245,000 4 2 103% 38 5 $1,891,499 $378,300 $399,999 7 6 109% 15 1 1 1 1 2 3 4 5
- 13. Toronto Real Estate Board Market Watch, December 2016 SUMMARY OF EXISTING HOME TRANSACTIONS CONDOMINIUM APARTMENT, DECEMBER 2016 ALL TREB AREAS 13 Sales Dollar Volume Average Price Median Price New Listings Active Listings Avg. SP / LP Avg. DOM TREB Total Halton Region Burlington Halton Hills Milton Oakville Peel Region Brampton Caledon Mississauga City of Toronto Toronto West Toronto Central Toronto East York Region Aurora E. Gwillimbury Georgina King Markham Newmarket Richmond Hill Vaughan Whitchurch-Stouffville Durham Region Ajax Brock Clarington Oshawa Pickering Scugog Uxbridge Whitby Dufferin County Orangeville Simcoe County Adjala-Tosorontio Bradford West GwillimburyEssa Innisfil New Tecumseth 1,731 $762,797,295 $440,669 $383,709 1,388 1,822 99% 24 43 $17,404,625 $404,759 $357,000 46 81 99% 20 12 $5,039,000 $419,917 $326,000 23 32 98% 18 0 - - - 0 0 - - 12 $5,136,248 $428,021 $384,000 5 3 101% 13 19 $7,229,377 $380,494 $347,777 18 46 99% 27 218 $73,363,583 $336,530 $320,000 188 210 99% 23 42 $12,219,515 $290,941 $284,500 31 31 99% 21 0 - - - 0 2 - - 176 $61,144,068 $347,409 $325,000 157 177 99% 23 1,238 $577,640,499 $466,592 $414,250 971 1,277 100% 24 276 $105,565,824 $382,485 $351,577 197 297 99% 27 800 $420,894,655 $526,118 $460,000 638 817 100% 23 162 $51,180,020 $315,926 $298,950 136 163 100% 20 202 $85,610,733 $423,816 $387,500 157 215 99% 28 5 $2,799,490 $559,898 $550,000 2 2 98% 47 0 - - - 0 0 - - 0 - - - 1 1 - - 2 $1,104,400 $552,200 $552,200 0 6 98% 27 86 $35,091,043 $408,035 $374,500 60 76 99% 27 3 $1,105,000 $368,333 $350,000 3 4 99% 23 50 $19,697,900 $393,958 $357,000 40 55 99% 32 56 $25,812,900 $460,945 $441,500 48 65 99% 22 0 - - - 3 6 - - 24 $7,569,555 $315,398 $295,450 22 29 99% 18 12 $3,767,400 $313,950 $293,000 11 7 99% 18 0 - - - 0 0 - - 3 $867,755 $289,252 $280,000 4 9 99% 14 5 $1,406,400 $281,280 $282,500 4 3 101% 22 2 $760,000 $380,000 $380,000 1 1 97% 18 0 - - - 0 0 - - 0 - - - 0 0 - - 2 $768,000 $384,000 $384,000 2 9 99% 19 6 $1,208,300 $201,383 $180,450 4 3 97% 58 6 $1,208,300 $201,383 $180,450 4 3 97% 58 0 - - - 0 7 - - 0 - - - 0 0 - - 0 - - - 0 3 - - 0 - - - 0 0 - - 0 - - - 0 3 - - 0 - - - 0 1 - - 1 1 1 1 2 3 4 5
- 14. Toronto Real Estate Board Market Watch, December 2016 SUMMARY OF EXISTING HOME TRANSACTIONS CONDOMINIUM APARTMENT, DECEMBER 2016 CITY OF TORONTO MUNICIPAL BREAKDOWN 14 Sales Dollar Volume Average Price Median Price New Listings Active Listings Avg. SP / LP Avg. DOM TREB Total City of Toronto Total Toronto West Toronto W01 Toronto W02 Toronto W03 Toronto W04 Toronto W05 Toronto W06 Toronto W07 Toronto W08 Toronto W09 Toronto W10 Toronto Central Toronto C01 Toronto C02 Toronto C03 Toronto C04 Toronto C06 Toronto C07 Toronto C08 Toronto C09 Toronto C10 Toronto C11 Toronto C12 Toronto C13 Toronto C14 Toronto C15 Toronto East Toronto E01 Toronto E02 Toronto E03 Toronto E04 Toronto E05 Toronto E06 Toronto E07 Toronto E08 Toronto E09 Toronto E10 Toronto E11 1,731 $762,797,295 $440,669 $383,709 1,388 1,822 99% 24 1,238 $577,640,499 $466,592 $414,250 971 1,277 100% 24 276 $105,565,824 $382,485 $351,577 197 297 99% 27 20 $10,222,053 $511,103 $468,000 9 14 103% 25 7 $3,600,000 $514,286 $518,000 9 8 99% 25 4 $1,446,000 $361,500 $365,500 1 0 100% 28 34 $10,865,500 $319,574 $315,000 23 22 100% 21 23 $6,632,900 $288,387 $319,000 17 44 98% 35 80 $34,987,672 $437,346 $410,000 64 120 99% 27 2 $814,000 $407,000 $407,000 1 1 100% 51 60 $24,254,300 $404,238 $360,000 40 39 100% 23 11 $3,272,199 $297,473 $225,000 8 10 96% 30 35 $9,471,200 $270,606 $270,000 25 39 98% 31 800 $420,894,655 $526,118 $460,000 638 817 100% 23 316 $169,714,260 $537,070 $485,000 244 310 100% 23 33 $34,196,136 $1,036,247 $641,000 34 89 99% 24 9 $6,383,785 $709,309 $545,000 19 25 103% 12 8 $6,311,500 $788,938 $415,000 14 26 93% 34 13 $4,988,000 $383,692 $393,000 13 16 99% 18 54 $27,289,476 $505,361 $462,500 39 40 99% 28 98 $47,915,884 $488,938 $458,000 96 128 100% 21 11 $8,912,500 $810,227 $672,000 6 6 101% 13 24 $13,582,543 $565,939 $545,609 27 30 100% 16 18 $6,161,605 $342,311 $287,500 21 16 99% 20 4 $3,047,000 $761,750 $709,000 1 5 98% 28 27 $9,737,200 $360,637 $344,000 21 20 101% 14 96 $45,904,978 $478,177 $445,940 42 49 99% 29 89 $36,749,788 $412,919 $358,000 61 57 99% 27 162 $51,180,020 $315,926 $298,950 136 163 100% 20 6 $3,866,600 $644,433 $617,500 5 0 108% 6 3 $1,595,320 $531,773 $395,000 5 14 106% 13 11 $3,927,300 $357,027 $310,000 8 8 98% 21 24 $6,241,300 $260,054 $278,250 10 11 101% 16 24 $7,589,100 $316,213 $303,250 25 30 98% 32 3 $1,086,000 $362,000 $305,000 6 10 102% 4 36 $11,381,400 $316,150 $315,000 26 25 100% 19 13 $4,096,700 $315,131 $291,000 6 10 100% 19 23 $6,922,900 $300,996 $312,000 22 23 101% 18 4 $867,500 $216,875 $226,750 5 12 99% 33 15 $3,605,900 $240,393 $248,000 18 20 100% 21 1 1 1 1 2 3 4 5
- 15. Toronto Real Estate Board Market Watch, December 2016 SUMMARY OF EXISTING HOME TRANSACTIONS LINK, DECEMBER 2016 ALL TREB AREAS 15 Sales Dollar Volume Average Price Median Price New Listings Active Listings Avg. SP / LP Avg. DOM TREB Total Halton Region Burlington Halton Hills Milton Oakville Peel Region Brampton Caledon Mississauga City of Toronto Toronto West Toronto Central Toronto East York Region Aurora E. Gwillimbury Georgina King Markham Newmarket Richmond Hill Vaughan Whitchurch-Stouffville Durham Region Ajax Brock Clarington Oshawa Pickering Scugog Uxbridge Whitby Dufferin County Orangeville Simcoe County Adjala-Tosorontio Bradford West GwillimburyEssa Innisfil New Tecumseth 83 $59,722,068 $719,543 $695,000 59 28 103% 14 7 $5,107,000 $729,571 $695,000 5 3 105% 11 1 $588,500 $588,500 $588,500 0 0 103% 9 0 - - - 0 0 - - 3 $1,897,500 $632,500 $632,500 1 1 99% 18 3 $2,621,000 $873,667 $870,000 4 2 109% 5 12 $7,347,500 $612,292 $625,250 15 7 100% 19 6 $3,342,000 $557,000 $541,000 11 6 100% 17 2 $1,285,000 $642,500 $642,500 1 0 99% 9 4 $2,720,500 $680,125 $690,000 3 1 102% 26 10 $8,125,000 $812,500 $814,500 4 3 104% 14 0 - - - 0 1 - - 1 $1,399,000 $1,399,000 $1,399,000 0 1 100% 25 9 $6,726,000 $747,333 $809,000 4 1 105% 13 34 $28,918,580 $850,546 $842,540 20 9 103% 14 1 $852,000 $852,000 $852,000 0 0 114% 13 0 - - - 0 0 - - 0 - - - 0 0 - - 0 - - - 0 0 - - 16 $14,212,080 $888,255 $867,500 14 8 103% 16 3 $1,853,000 $617,667 $600,000 1 0 98% 17 8 $6,867,000 $858,375 $845,000 3 0 105% 9 6 $5,134,500 $855,750 $822,500 2 1 102% 15 0 - - - 0 0 - - 14 $7,208,988 $514,928 $522,500 11 3 104% 9 1 $535,000 $535,000 $535,000 1 0 105% 14 0 - - - 0 0 - - 4 $1,967,500 $491,875 $502,500 3 1 104% 10 2 $830,000 $415,000 $415,000 3 1 103% 10 1 $565,888 $565,888 $565,888 1 1 103% 16 0 - - - 0 0 - - 0 - - - 0 0 - - 6 $3,310,600 $551,767 $567,550 3 0 105% 7 0 - - - 0 0 - - 0 - - - 0 0 - - 6 $3,015,000 $502,500 $520,000 4 3 102% 22 0 - - - 0 0 - - 5 $2,605,000 $521,000 $540,000 2 1 102% 22 1 $410,000 $410,000 $410,000 2 2 99% 25 0 - - - 0 0 - - 0 - - - 0 0 - - 1 1 1 1 2 3 4 5
- 16. Toronto Real Estate Board Market Watch, December 2016 SUMMARY OF EXISTING HOME TRANSACTIONS LINK, DECEMBER 2016 CITY OF TORONTO MUNICIPAL BREAKDOWN 16 Sales Dollar Volume Average Price Median Price New Listings Active Listings Avg. SP / LP Avg. DOM TREB Total City of Toronto Total Toronto West Toronto W01 Toronto W02 Toronto W03 Toronto W04 Toronto W05 Toronto W06 Toronto W07 Toronto W08 Toronto W09 Toronto W10 Toronto Central Toronto C01 Toronto C02 Toronto C03 Toronto C04 Toronto C06 Toronto C07 Toronto C08 Toronto C09 Toronto C10 Toronto C11 Toronto C12 Toronto C13 Toronto C14 Toronto C15 Toronto East Toronto E01 Toronto E02 Toronto E03 Toronto E04 Toronto E05 Toronto E06 Toronto E07 Toronto E08 Toronto E09 Toronto E10 Toronto E11 83 $59,722,068 $719,543 $695,000 59 28 103% 14 10 $8,125,000 $812,500 $814,500 4 3 104% 14 0 - - - 0 1 - - 0 - - - 0 0 - - 0 - - - 0 0 - - 0 - - - 0 0 - - 0 - - - 0 0 - - 0 - - - 0 1 - - 0 - - - 0 0 - - 0 - - - 0 0 - - 0 - - - 0 0 - - 0 - - - 0 0 - - 0 - - - 0 0 - - 1 $1,399,000 $1,399,000 $1,399,000 0 1 100% 25 0 - - - 0 0 - - 0 - - - 0 0 - - 0 - - - 0 0 - - 0 - - - 0 0 - - 0 - - - 0 0 - - 0 - - - 0 1 - - 0 - - - 0 0 - - 0 - - - 0 0 - - 0 - - - 0 0 - - 0 - - - 0 0 - - 0 - - - 0 0 - - 0 - - - 0 0 - - 1 $1,399,000 $1,399,000 $1,399,000 0 0 100% 25 0 - - - 0 0 - - 9 $6,726,000 $747,333 $809,000 4 1 105% 13 0 - - - 0 0 - - 0 - - - 0 0 - - 0 - - - 0 0 - - 0 - - - 0 0 - - 4 $3,350,000 $837,500 $835,000 2 0 111% 11 0 - - - 0 0 - - 2 $1,443,000 $721,500 $721,500 1 1 100% 19 0 - - - 0 0 - - 0 - - - 0 0 - - 0 - - - 0 0 - - 3 $1,933,000 $644,333 $680,000 1 0 99% 11 1 1 1 1 2 3 4 5
- 17. Toronto Real Estate Board Market Watch, December 2016 SUMMARY OF EXISTING HOME TRANSACTIONS ATTACHED/ROW/TOWNHOUSE, DECEMBER 2016 ALL TREB AREAS 17 Sales Dollar Volume Average Price Median Price New Listings Active Listings Avg. SP / LP Avg. DOM TREB Total Halton Region Burlington Halton Hills Milton Oakville Peel Region Brampton Caledon Mississauga City of Toronto Toronto West Toronto Central Toronto East York Region Aurora E. Gwillimbury Georgina King Markham Newmarket Richmond Hill Vaughan Whitchurch-Stouffville Durham Region Ajax Brock Clarington Oshawa Pickering Scugog Uxbridge Whitby Dufferin County Orangeville Simcoe County Adjala-Tosorontio Bradford West GwillimburyEssa Innisfil New Tecumseth 412 $270,161,215 $655,731 $612,000 313 193 103% 14 64 $38,765,231 $605,707 $602,500 49 34 101% 15 4 $2,375,445 $593,861 $594,223 0 1 96% 24 2 $1,053,000 $526,500 $526,500 2 3 101% 13 35 $19,832,486 $566,642 $576,786 24 11 103% 11 23 $15,504,300 $674,100 $712,000 23 19 100% 20 86 $48,147,581 $559,856 $548,745 76 39 101% 13 66 $34,749,281 $526,504 $530,250 62 28 101% 12 6 $3,547,400 $591,233 $610,500 2 5 100% 10 14 $9,850,900 $703,636 $632,500 12 6 103% 18 53 $46,215,077 $871,983 $777,777 38 34 105% 17 14 $10,274,777 $733,913 $695,000 8 10 103% 17 22 $24,473,800 $1,112,445 $1,014,000 14 14 104% 16 17 $11,466,500 $674,500 $629,000 16 10 107% 17 120 $92,635,514 $771,963 $759,000 86 61 103% 17 15 $11,229,268 $748,618 $712,000 11 11 100% 24 4 $2,034,500 $508,625 $482,250 3 1 101% 15 2 $909,000 $454,500 $454,500 4 5 103% 56 0 - - - 0 0 - - 31 $25,371,570 $818,438 $785,000 26 17 105% 11 5 $3,275,000 $655,000 $650,000 3 5 103% 17 25 $21,227,288 $849,092 $850,288 13 5 104% 18 25 $20,364,888 $814,596 $785,000 20 16 103% 15 13 $8,224,000 $632,615 $649,000 6 1 103% 15 76 $37,772,312 $497,004 $499,450 54 20 103% 11 19 $10,268,500 $540,447 $544,000 15 8 102% 14 1 $301,000 $301,000 $301,000 0 0 99% 7 13 $5,386,000 $414,308 $400,000 5 0 104% 9 12 $5,318,500 $443,208 $442,500 15 7 105% 11 12 $6,890,600 $574,217 $525,000 8 2 104% 9 0 - - - 0 0 - - 0 - - - 0 0 - - 19 $9,607,712 $505,669 $512,000 11 3 103% 9 2 $792,500 $396,250 $396,250 1 0 103% 8 2 $792,500 $396,250 $396,250 1 0 103% 8 11 $5,833,000 $530,273 $575,000 9 5 102% 14 0 - - - 0 0 - - 7 $4,188,000 $598,286 $591,000 5 1 103% 6 0 - - - 0 0 - - 1 $535,000 $535,000 $535,000 1 2 100% 12 3 $1,110,000 $370,000 $365,000 3 2 98% 32 1 1 1 1 2 3 4 5
- 18. Toronto Real Estate Board Market Watch, December 2016 SUMMARY OF EXISTING HOME TRANSACTIONS ATTACHED/ROW/TOWNHOUSE, DECEMBER 2016 CITY OF TORONTO MUNICIPAL BREAKDOWN 18 Sales Dollar Volume Average Price Median Price New Listings Active Listings Avg. SP / LP Avg. DOM TREB Total City of Toronto Total Toronto West Toronto W01 Toronto W02 Toronto W03 Toronto W04 Toronto W05 Toronto W06 Toronto W07 Toronto W08 Toronto W09 Toronto W10 Toronto Central Toronto C01 Toronto C02 Toronto C03 Toronto C04 Toronto C06 Toronto C07 Toronto C08 Toronto C09 Toronto C10 Toronto C11 Toronto C12 Toronto C13 Toronto C14 Toronto C15 Toronto East Toronto E01 Toronto E02 Toronto E03 Toronto E04 Toronto E05 Toronto E06 Toronto E07 Toronto E08 Toronto E09 Toronto E10 Toronto E11 412 $270,161,215 $655,731 $612,000 313 193 103% 14 53 $46,215,077 $871,983 $777,777 38 34 105% 17 14 $10,274,777 $733,913 $695,000 8 10 103% 17 1 $700,000 $700,000 $700,000 1 2 102% 6 5 $3,928,000 $785,600 $830,000 2 1 101% 19 0 - - - 0 1 - - 1 $640,000 $640,000 $640,000 0 0 98% 29 2 $1,329,000 $664,500 $664,500 2 2 99% 10 4 $3,127,777 $781,944 $776,389 3 1 111% 14 0 - - - 0 0 - - 0 - - - 0 0 - - 0 - - - 0 0 - - 1 $550,000 $550,000 $550,000 0 3 98% 28 22 $24,473,800 $1,112,445 $1,014,000 14 14 104% 16 9 $9,251,800 $1,027,978 $960,000 4 8 109% 17 2 $3,090,000 $1,545,000 $1,545,000 0 0 100% 10 0 - - - 0 0 - - 0 - - - 0 0 - - 0 - - - 0 0 - - 2 $2,265,000 $1,132,500 $1,132,500 1 1 99% 19 1 $989,000 $989,000 $989,000 1 2 100% 13 1 $960,000 $960,000 $960,000 1 0 122% 6 0 - - - 1 1 - - 0 - - - 0 0 - - 0 - - - 0 0 - - 3 $2,535,000 $845,000 $915,000 1 0 106% 15 4 $5,383,000 $1,345,750 $1,301,500 5 2 99% 21 0 - - - 0 0 - - 17 $11,466,500 $674,500 $629,000 16 10 107% 17 1 $1,295,500 $1,295,500 $1,295,500 0 2 130% 11 1 $710,000 $710,000 $710,000 1 1 120% 2 3 $2,093,000 $697,667 $625,000 2 1 107% 45 1 $653,000 $653,000 $653,000 1 1 99% 17 1 $678,000 $678,000 $678,000 1 0 99% 13 0 - - - 0 0 - - 2 $1,276,000 $638,000 $638,000 2 0 99% 4 1 $629,000 $629,000 $629,000 1 1 105% 6 0 - - - 0 0 - - 0 - - - 1 1 - - 7 $4,132,000 $590,286 $595,000 7 3 105% 14 1 1 1 1 2 3 4 5
- 19. Toronto Real Estate Board Market Watch, December 2016 SUMMARY OF EXISTING HOME TRANSACTIONS CO-OP APARTMENT, DECEMBER 2016 ALL TREB AREAS 19 Sales Dollar Volume Average Price Median Price New Listings Active Listings Avg. SP / LP Average DOM TREB Total Halton Region Burlington Halton Hills Milton Oakville Peel Region Brampton Caledon Mississauga City of Toronto Toronto West Toronto Central Toronto East York Region Aurora E. Gwillimbury Georgina King Markham Newmarket Richmond Hill Vaughan Whitchurch-Stouffville Durham Region Ajax Brock Clarington Oshawa Pickering Scugog Uxbridge Whitby Dufferin County Orangeville Simcoe County Adjala-Tosorontio Bradford West GwillimburyEssa Innisfil New Tecumseth 11 $3,854,525 $350,411 $283,500 4 7 99% 21 0 - - - 0 2 - - 0 - - - 0 2 - - 0 - - - 0 0 - - 0 - - - 0 0 - - 0 - - - 0 0 - - 1 $283,500 $283,500 $283,500 0 0 100% 19 1 $283,500 $283,500 $283,500 0 0 100% 19 0 - - - 0 0 - - 0 - - - 0 0 - - 10 $3,571,025 $357,103 $343,950 4 5 99% 21 3 $717,900 $239,300 $270,000 2 3 99% 19 5 $2,543,125 $508,625 $475,000 0 0 99% 22 2 $310,000 $155,000 $155,000 2 2 98% 22 0 - - - 0 0 - - 0 - - - 0 0 - - 0 - - - 0 0 - - 0 - - - 0 0 - - 0 - - - 0 0 - - 0 - - - 0 0 - - 0 - - - 0 0 - - 0 - - - 0 0 - - 0 - - - 0 0 - - 0 - - - 0 0 - - 0 - - - 0 0 - - 0 - - - 0 0 - - 0 - - - 0 0 - - 0 - - - 0 0 - - 0 - - - 0 0 - - 0 - - - 0 0 - - 0 - - - 0 0 - - 0 - - - 0 0 - - 0 - - - 0 0 - - 0 - - - 0 0 - - 0 - - - 0 0 - - 0 - - - 0 0 - - 0 - - - 0 0 - - 0 - - - 0 0 - - 0 - - - 0 0 - - 0 - - - 0 0 - - 0 - - - 0 0 - - 1 1 1 1 2 3 4 5
- 20. Toronto Real Estate Board Market Watch, December 2016 SUMMARY OF EXISTING HOME TRANSACTIONS CO-OP APARTMENT, DECEMBER 2016 CITY OF TORONTO MUNICIPAL BREAKDOWN 20 Sales Dollar Volume Average Price Median Price New Listings Active Listings Avg. SP / LP Avg. DOM TREB Total City of Toronto Total Toronto West Toronto W01 Toronto W02 Toronto W03 Toronto W04 Toronto W05 Toronto W06 Toronto W07 Toronto W08 Toronto W09 Toronto W10 Toronto Central Toronto C01 Toronto C02 Toronto C03 Toronto C04 Toronto C06 Toronto C07 Toronto C08 Toronto C09 Toronto C10 Toronto C11 Toronto C12 Toronto C13 Toronto C14 Toronto C15 Toronto East Toronto E01 Toronto E02 Toronto E03 Toronto E04 Toronto E05 Toronto E06 Toronto E07 Toronto E08 Toronto E09 Toronto E10 Toronto E11 11 $3,854,525 $350,411 $283,500 4 7 99% 21 10 $3,571,025 $357,103 $343,950 4 5 99% 21 3 $717,900 $239,300 $270,000 2 3 99% 19 0 - - - 0 0 - - 0 - - - 0 0 - - 0 - - - 0 0 - - 0 - - - 0 0 - - 0 - - - 0 0 - - 1 $172,000 $172,000 $172,000 1 2 96% 30 0 - - - 0 1 - - 2 $545,900 $272,950 $272,950 1 0 101% 14 0 - - - 0 0 - - 0 - - - 0 0 - - 5 $2,543,125 $508,625 $475,000 0 0 99% 22 0 - - - 0 0 - - 2 $998,125 $499,063 $499,063 0 0 103% 17 1 $475,000 $475,000 $475,000 0 0 95% 17 0 - - - 0 0 - - 0 - - - 0 0 - - 0 - - - 0 0 - - 0 - - - 0 0 - - 2 $1,070,000 $535,000 $535,000 0 0 98% 31 0 - - - 0 0 - - 0 - - - 0 0 - - 0 - - - 0 0 - - 0 - - - 0 0 - - 0 - - - 0 0 - - 0 - - - 0 0 - - 2 $310,000 $155,000 $155,000 2 2 98% 22 0 - - - 0 0 - - 0 - - - 1 1 - - 0 - - - 0 0 - - 2 $310,000 $155,000 $155,000 1 1 98% 22 0 - - - 0 0 - - 0 - - - 0 0 - - 0 - - - 0 0 - - 0 - - - 0 0 - - 0 - - - 0 0 - - 0 - - - 0 0 - - 0 - - - 0 0 - - 1 1 1 1 2 3 4 5
- 21. Toronto Real Estate Board Market Watch, December 2016 SUMMARY OF EXISTING HOME TRANSACTIONS DETACHED CONDOMINIUM, DECEMBER 2016 ALL TREB AREAS 21 Sales Dollar Volume Average Price Median Price New Listings Active Listings Avg. SP / LP Avg. DOM TREB Total Halton Region Burlington Halton Hills Milton Oakville Peel Region Brampton Caledon Mississauga City of Toronto Toronto West Toronto Central Toronto East York Region Aurora E. Gwillimbury Georgina King Markham Newmarket Richmond Hill Vaughan Whitchurch-Stouffville Durham Region Ajax Brock Clarington Oshawa Pickering Scugog Uxbridge Whitby Dufferin County Orangeville Simcoe County Adjala-Tosorontio Bradford West GwillimburyEssa Innisfil New Tecumseth 4 $1,818,800 $454,700 $434,450 3 3 98% 47 0 - - - 0 0 - - 0 - - - 0 0 - - 0 - - - 0 0 - - 0 - - - 0 0 - - 0 - - - 0 0 - - 1 $495,000 $495,000 $495,000 1 1 99% 13 0 - - - 0 0 - - 0 - - - 0 0 - - 1 $495,000 $495,000 $495,000 1 1 99% 13 0 - - - 1 0 - - 0 - - - 0 0 - - 0 - - - 0 0 - - 0 - - - 1 0 - - 0 - - - 0 0 - - 0 - - - 0 0 - - 0 - - - 0 0 - - 0 - - - 0 0 - - 0 - - - 0 0 - - 0 - - - 0 0 - - 0 - - - 0 0 - - 0 - - - 0 0 - - 0 - - - 0 0 - - 0 - - - 0 0 - - 0 - - - 0 1 - - 0 - - - 0 0 - - 0 - - - 0 0 - - 0 - - - 0 0 - - 0 - - - 0 0 - - 0 - - - 0 0 - - 0 - - - 0 0 - - 0 - - - 0 1 - - 0 - - - 0 0 - - 0 - - - 0 0 - - 0 - - - 0 0 - - 3 $1,323,800 $441,267 $373,900 1 1 98% 59 0 - - - 0 0 - - 0 - - - 0 0 - - 0 - - - 0 0 - - 0 - - - 0 0 - - 3 $1,323,800 $441,267 $373,900 1 1 98% 59 1 1 1 1 2 3 4 5
- 22. Toronto Real Estate Board Market Watch, December 2016 SUMMARY OF EXISTING HOME TRANSACTIONS DETACHED CONDOMINIUM, DECEMBER 2016 CITY OF TORONTO MUNICIPAL BREAKDOWN 22 Sales Dollar Volume Average Price Median Price New Listings Active Listings Avg. SP / LP Avg. DOM TREB Total City of Toronto Total Toronto West Toronto W01 Toronto W02 Toronto W03 Toronto W04 Toronto W05 Toronto W06 Toronto W07 Toronto W08 Toronto W09 Toronto W10 Toronto Central Toronto C01 Toronto C02 Toronto C03 Toronto C04 Toronto C06 Toronto C07 Toronto C08 Toronto C09 Toronto C10 Toronto C11 Toronto C12 Toronto C13 Toronto C14 Toronto C15 Toronto East Toronto E01 Toronto E02 Toronto E03 Toronto E04 Toronto E05 Toronto E06 Toronto E07 Toronto E08 Toronto E09 Toronto E10 Toronto E11 4 $1,818,800 $454,700 $434,450 3 3 98% 47 0 - - - 1 0 - - 0 - - - 0 0 - - 0 - - - 0 0 - - 0 - - - 0 0 - - 0 - - - 0 0 - - 0 - - - 0 0 - - 0 - - - 0 0 - - 0 - - - 0 0 - - 0 - - - 0 0 - - 0 - - - 0 0 - - 0 - - - 0 0 - - 0 - - - 0 0 - - 0 - - - 0 0 - - 0 - - - 0 0 - - 0 - - - 0 0 - - 0 - - - 0 0 - - 0 - - - 0 0 - - 0 - - - 0 0 - - 0 - - - 0 0 - - 0 - - - 0 0 - - 0 - - - 0 0 - - 0 - - - 0 0 - - 0 - - - 0 0 - - 0 - - - 0 0 - - 0 - - - 0 0 - - 0 - - - 0 0 - - 0 - - - 0 0 - - 0 - - - 1 0 - - 0 - - - 0 0 - - 0 - - - 0 0 - - 0 - - - 0 0 - - 0 - - - 0 0 - - 0 - - - 0 0 - - 0 - - - 0 0 - - 0 - - - 0 0 - - 0 - - - 1 0 - - 0 - - - 0 0 - - 0 - - - 0 0 - - 0 - - - 0 0 - - 1 1 1 1 2 3 4 5
- 23. Toronto Real Estate Board Market Watch, December 2016 SUMMARY OF EXISTING HOME TRANSACTIONS CO-OWNERSHIP APARTMENT, DECEMBER 2016 ALL TREB AREAS 23 Sales Dollar Volume Average Price Median Price New Listings Active Listings Avg. SP / LP Avg. DOM TREB Total Halton Region Burlington Halton Hills Milton Oakville Peel Region Brampton Caledon Mississauga City of Toronto Toronto West Toronto Central Toronto East York Region Aurora E. Gwillimbury Georgina King Markham Newmarket Richmond Hill Vaughan Whitchurch-Stouffville Durham Region Ajax Brock Clarington Oshawa Pickering Scugog Uxbridge Whitby Dufferin County Orangeville Simcoe County Adjala-Tosorontio Bradford West GwillimburyEssa Innisfil New Tecumseth 11 $3,444,900 $313,173 $298,000 5 8 99% 21 0 - - - 0 0 - - 0 - - - 0 0 - - 0 - - - 0 0 - - 0 - - - 0 0 - - 0 - - - 0 0 - - 0 - - - 0 0 - - 0 - - - 0 0 - - 0 - - - 0 0 - - 0 - - - 0 0 - - 11 $3,444,900 $313,173 $298,000 5 8 99% 21 1 $317,500 $317,500 $317,500 0 2 111% 7 10 $3,127,400 $312,740 $276,500 5 6 97% 22 0 - - - 0 0 - - 0 - - - 0 0 - - 0 - - - 0 0 - - 0 - - - 0 0 - - 0 - - - 0 0 - - 0 - - - 0 0 - - 0 - - - 0 0 - - 0 - - - 0 0 - - 0 - - - 0 0 - - 0 - - - 0 0 - - 0 - - - 0 0 - - 0 - - - 0 0 - - 0 - - - 0 0 - - 0 - - - 0 0 - - 0 - - - 0 0 - - 0 - - - 0 0 - - 0 - - - 0 0 - - 0 - - - 0 0 - - 0 - - - 0 0 - - 0 - - - 0 0 - - 0 - - - 0 0 - - 0 - - - 0 0 - - 0 - - - 0 0 - - 0 - - - 0 0 - - 0 - - - 0 0 - - 0 - - - 0 0 - - 0 - - - 0 0 - - 0 - - - 0 0 - - 1 1 1 1 2 3 4 5
- 24. Toronto Real Estate Board Market Watch, December 2016 SUMMARY OF EXISTING HOME TRANSACTIONS CO-OWNERSHIP APARTMENT, DECEMBER 2016 CITY OF TORONTO MUNICIPAL BREAKDOWN 24 Sales Dollar Volume Average Price Median Price New Listings Active Listings Avg. SP / LP Avg. DOM TREB Total City of Toronto Total Toronto West Toronto W01 Toronto W02 Toronto W03 Toronto W04 Toronto W05 Toronto W06 Toronto W07 Toronto W08 Toronto W09 Toronto W10 Toronto Central Toronto C01 Toronto C02 Toronto C03 Toronto C04 Toronto C06 Toronto C07 Toronto C08 Toronto C09 Toronto C10 Toronto C11 Toronto C12 Toronto C13 Toronto C14 Toronto C15 Toronto East Toronto E01 Toronto E02 Toronto E03 Toronto E04 Toronto E05 Toronto E06 Toronto E07 Toronto E08 Toronto E09 Toronto E10 Toronto E11 11 $3,444,900 $313,173 $298,000 5 8 99% 21 11 $3,444,900 $313,173 $298,000 5 8 99% 21 1 $317,500 $317,500 $317,500 0 2 111% 7 1 $317,500 $317,500 $317,500 0 0 111% 7 0 - - - 0 0 - - 0 - - - 0 0 - - 0 - - - 0 0 - - 0 - - - 0 1 - - 0 - - - 0 0 - - 0 - - - 0 0 - - 0 - - - 0 0 - - 0 - - - 0 1 - - 0 - - - 0 0 - - 10 $3,127,400 $312,740 $276,500 5 6 97% 22 0 - - - 1 1 - - 1 $430,000 $430,000 $430,000 0 0 98% 8 0 - - - 1 1 - - 3 $964,000 $321,333 $324,000 0 0 99% 23 0 - - - 0 0 - - 0 - - - 0 0 - - 1 $235,500 $235,500 $235,500 2 2 101% 16 0 - - - 0 0 - - 2 $783,000 $391,500 $391,500 0 0 94% 50 0 - - - 0 0 - - 0 - - - 0 0 - - 2 $459,900 $229,950 $229,950 1 2 99% 12 1 $255,000 $255,000 $255,000 0 0 95% 6 0 - - - 0 0 - - 0 - - - 0 0 - - 0 - - - 0 0 - - 0 - - - 0 0 - - 0 - - - 0 0 - - 0 - - - 0 0 - - 0 - - - 0 0 - - 0 - - - 0 0 - - 0 - - - 0 0 - - 0 - - - 0 0 - - 0 - - - 0 0 - - 0 - - - 0 0 - - 0 - - - 0 0 - - 1 1 1 1 2 3 4 5
- 25. Toronto Real Estate Board Market Watch, December 2016 FOCUS ON THE MLS HOME PRICE INDEX INDEX AND BENCHMARK PRICE, DECEMBER 2016 ALL TREB AREAS 25 Composite Single-Family Detached Single-Family Attached Townhouse Apartment Index Benchmark Yr./Yr. % Chg. Index Benchmark Yr./Yr. % Chg. Index Benchmark Yr./Yr. % Chg. Index Benchmark Yr./Yr. % Chg. Index Benchmark Yr./Yr. % Chg. TREB Total Halton Region Burlington Halton Hills Milton Oakville Peel Region Brampton Caledon Mississauga City of Toronto York Region Aurora East Gwillimbury Georgina King Markham Newmarket Richmond Hill Vaughan Whitchurch-Stouffville Durham Region Ajax Brock Clarington Oshawa Pickering Scugog Uxbridge Whitby Dufferin County Orangeville Simcoe County Adjala-Tosorontio Bradford West GwillimburyEssa Innisfil New Tecumseth 227.7 $694,900 21.05% 238.0 $885,600 23.25% 241.2 $681,900 22.13% 220.3 $481,600 20.38% 189.8 $381,500 15.24% 239.0 $781,800 20.95% 236.1 $876,000 21.14% 243.1 $630,700 21.98% 220.5 $435,200 19.19% - - - 239.1 $708,200 18.72% 235.5 $829,000 17.11% 235.3 $561,200 15.91% 222.0 $443,300 18.65% - - - 213.2 $620,800 20.18% 216.2 $691,700 22.63% 236.6 $582,700 23.81% 206.2 $371,700 20.37% - - - 229.2 $632,900 22.04% 216.5 $750,700 23.64% 239.2 $597,100 24.26% 208.1 $381,500 19.87% - - - 250.8 $924,800 20.87% 249.4 $1,033,600 20.77% 253.3 $685,500 20.73% 225.7 $498,400 18.85% - - - 217.5 $595,300 22.12% 221.1 $749,300 22.49% 227.2 $579,600 23.88% 222.9 $461,200 20.55% 177.7 $306,200 17.22% 216.0 $551,200 24.64% 214.0 $626,000 23.41% 220.2 $518,800 25.68% 213.9 $397,200 27.40% 166.2 $260,100 19.65% 199.7 $712,700 23.27% 200.0 $735,800 23.69% 228.7 $565,300 26.14% - - - - - - 220.2 $616,100 20.13% 234.1 $873,900 21.55% 236.0 $644,800 22.09% 226.0 $485,400 18.57% 179.7 $315,200 16.76% 219.7 $720,400 17.55% 239.6 $1,038,900 20.22% 240.3 $798,500 18.08% 220.9 $533,900 19.41% 192.0 $396,700 14.76% 263.0 $903,100 25.24% 271.5 $1,067,500 27.46% 268.4 $777,800 24.55% 223.4 $568,100 17.46% 188.6 $409,100 13.82% 259.5 $835,300 27.14% 260.0 $965,900 28.02% 264.7 $684,500 24.51% 196.9 $498,700 18.90% 198.8 $411,100 18.76% 221.2 $716,900 22.21% 226.0 $744,900 23.56% 234.8 $497,100 24.96% - - - - - - 225.7 $468,600 28.09% 236.9 $488,300 27.64% 242.6 $478,200 28.50% - - - - - - 233.3 $989,000 22.98% 234.4 $989,200 22.66% 243.5 $570,300 13.31% - - - - - - 274.6 $947,100 25.33% 295.6 $1,215,200 29.88% 276.7 $824,000 23.75% 230.6 $574,900 15.24% 186.2 $429,200 11.76% 239.4 $706,000 24.62% 244.3 $822,300 27.97% 247.0 $582,400 23.93% 224.2 $452,700 17.63% 202.3 $340,700 18.86% 286.0 $1,037,000 28.94% 310.5 $1,319,900 30.74% 288.9 $875,900 27.89% 203.3 $569,200 16.04% 184.3 $383,900 14.61% 248.1 $897,100 21.86% 242.2 $1,008,300 23.07% 259.3 $789,000 23.36% 243.5 $662,300 22.98% 194.0 $430,500 14.93% 262.3 $988,900 23.44% 262.1 $1,005,700 23.92% 230.4 $632,900 20.88% - - - - - - 218.6 $514,400 26.43% 216.4 $564,200 26.25% 229.3 $459,500 26.41% 206.0 $336,600 28.11% 196.8 $353,800 23.70% 228.0 $563,400 25.00% 225.3 $603,400 24.61% 238.9 $513,900 25.54% 223.4 $408,400 28.61% 182.6 $310,100 19.42% 169.9 $321,100 18.81% 170.8 $323,500 18.94% - - - - - - - - - 207.4 $438,900 22.79% 202.5 $486,600 25.15% 212.4 $405,500 21.37% 195.3 $349,600 20.70% 204.3 $289,100 26.97% 218.6 $418,600 30.27% 216.3 $460,700 29.21% 230.4 $385,900 29.73% 187.3 $250,600 32.93% 187.7 $253,200 23.65% 222.9 $602,700 24.53% 221.8 $693,100 24.19% 231.7 $540,100 23.38% 224.3 $402,600 27.66% 209.3 $409,800 25.63% 192.9 $503,300 20.49% 198.6 $514,200 21.10% 191.5 $400,800 21.90% - - - - - - 198.0 $605,500 21.40% 197.4 $611,300 21.18% 194.3 $476,800 22.97% - - - - - - 221.8 $579,800 27.91% 223.4 $641,800 27.66% 229.8 $506,200 28.88% 201.7 $366,300 23.82% 186.5 $363,900 21.82% 217.4 $498,300 25.09% 226.9 $517,100 25.50% 211.2 $395,800 24.90% - - - - - - 217.4 $498,300 25.09% 226.9 $517,100 25.50% 211.2 $395,800 24.90% - - - - - - 214.9 $458,200 24.44% 208.2 $461,400 25.05% 226.3 $434,300 24.68% - - - - - - 177.2 $628,900 17.90% 177.2 $628,900 17.90% - - - - - - - - - 239.9 $596,200 24.36% 218.4 $669,000 26.24% 243.6 $506,400 25.76% - - - - - - 211.8 $496,000 23.35% 206.0 $521,000 21.68% 214.6 $365,700 22.63% - - - - - - 211.6 $391,500 27.16% 211.4 $391,700 27.04% 236.0 $367,200 29.10% - - - - - - 197.0 $455,100 21.16% 190.4 $490,500 20.20% 206.3 $393,800 21.28% - - - - - -
- 26. Toronto Real Estate Board Market Watch, December 2016 FOCUS ON THE MLS HOME PRICE INDEX INDEX AND BENCHMARK PRICE, DECEMBER 2016 CITY OF TORONTO 26 Composite Single-Family Detached Single-Family Attached Townhouse Apartment Index Benchmark Yr./Yr. % Chg. Index Benchmark Yr./Yr. % Chg. Index Benchmark Yr./Yr. % Chg. Index Benchmark Yr./Yr. % Chg. Index Benchmark Yr./Yr. % Chg. TREB Total City of Toronto Toronto W01 Toronto W02 Toronto W03 Toronto W04 Toronto W05 Toronto W06 Toronto W07 Toronto W08 Toronto W09 Toronto W10 Toronto C01 Toronto C02 Toronto C03 Toronto C04 Toronto C06 Toronto C07 Toronto C08 Toronto C09 Toronto C10 Toronto C11 Toronto C12 Toronto C13 Toronto C14 Toronto C15 Toronto E01 Toronto E02 Toronto E03 Toronto E04 Toronto E05 Toronto E06 Toronto E07 Toronto E08 Toronto E09 Toronto E10 Toronto E11 228 $694,900 21.05% 238 $885,600 23.25% 241 $681,900 22.13% 220 $481,600 20.38% 190 $381,500 15.24% 220 $720,400 17.55% 240 $1,038,900 20.22% 240 $798,500 18.08% 221 $533,900 19.41% 192 $396,700 14.76% 188 $768,300 11.82% 207 $1,064,300 16.08% 229 $881,600 19.13% 206 $424,200 13.94% 159 $371,700 6.13% 227 $818,100 11.11% 233 $956,500 10.69% 268 $820,900 12.37% 176 $483,900 8.00% 164 $666,800 12.37% 239 $620,200 16.00% 249 $676,700 18.59% 245 $626,400 13.99% 146 $353,900 11.96% 173 $329,700 14.58% 213 $558,400 18.97% 223 $703,200 18.76% 215 $625,800 15.64% 193 $467,800 7.48% 184 $271,300 20.23% 201 $477,200 19.19% 218 $726,800 19.06% 202 $591,300 19.63% 209 $344,100 23.79% 172 $225,400 20.32% 191 $557,900 19.33% 254 $805,200 25.78% 207 $628,800 23.45% 232 $684,100 31.86% 139 $346,700 11.31% 215 $918,000 21.63% 229 $991,000 23.48% 208 $850,800 18.98% 160 $587,800 29.47% 120 $488,200 7.40% 181 $734,700 14.30% 197 $1,029,500 14.49% 198 $752,000 16.74% 189 $461,900 26.69% 163 $328,300 12.79% 198 $509,800 15.37% 209 $780,000 12.34% 186 $520,500 11.53% 208 $536,900 13.25% 177 $226,700 22.44% 202 $469,500 21.79% 223 $656,300 24.16% 217 $586,800 23.86% 194 $349,600 19.46% 167 $254,400 16.91% 222 $549,600 14.39% 228 $805,200 11.05% 251 $872,200 11.68% 219 $652,400 19.80% 217 $451,200 15.02% 225 $1,068,800 14.03% 210 $1,662,100 12.68% 241 $1,267,100 11.79% 213 $997,400 7.56% 216 $601,900 16.40% 247 $1,271,800 17.61% 242 $1,459,700 17.97% 256 $947,700 16.05% - - - 243 $642,000 16.71% 227 $1,406,500 19.29% 233 $1,631,500 18.96% 231 $1,105,400 15.83% 207 $772,600 23.24% 189 $448,300 19.22% 246 $980,900 21.19% 273 $1,167,200 29.36% 210 $785,800 14.91% - - - 211 $467,400 10.22% 233 $800,400 22.25% 304 $1,390,800 31.23% 221 $790,300 20.09% 198 $581,300 21.77% 180 $425,000 13.60% 207 $533,000 15.38% 192 $597,000 24.89% 234 $974,900 21.71% 225 $681,200 29.60% 205 $452,700 14.00% 147 $1,088,700 4.12% 127 $1,592,900 0.63% 138 $1,120,500 -6.20% 181 $932,800 8.86% 162 $537,400 6.01% 229 $892,200 10.86% 244 $1,497,400 18.33% 235 $1,158,200 10.40% 246 $563,400 1.70% 220 $527,400 11.44% 209 $749,600 11.57% 193 $1,293,600 5.58% 214 $949,300 3.63% 153 $243,900 21.54% 226 $321,900 17.26% 212 $1,814,300 20.63% 203 $2,184,900 19.45% 238 $1,020,600 18.84% 266 $901,600 34.31% 206 $647,900 15.28% 226 $834,500 25.11% 265 $1,422,000 31.58% 236 $756,100 26.45% 235 $669,000 30.36% 179 $354,800 17.19% 227 $770,300 23.01% 312 $1,694,800 33.68% 251 $1,225,400 25.66% 252 $851,500 10.82% 191 $480,900 18.68% 232 $774,200 23.06% 314 $1,470,200 38.82% 270 $877,500 30.00% 239 $589,600 19.29% 164 $383,000 11.35% 273 $847,600 22.23% 269 $908,300 18.77% 289 $912,200 22.58% 261 $528,100 30.08% 221 $524,400 10.83% 242 $900,300 17.75% 214 $940,300 13.68% 258 $862,800 20.33% 261 $835,600 30.40% 234 $641,200 10.22% 238 $734,300 16.07% 252 $848,100 18.61% 228 $741,400 14.48% - - - 173 $258,800 7.12% 229 $573,500 18.39% 239 $704,600 19.66% 239 $579,800 28.36% 205 $442,600 7.17% 212 $320,400 13.10% 230 $614,000 21.42% 263 $926,900 23.88% 257 $708,900 26.05% 231 $503,100 18.12% 178 $350,600 11.57% 243 $685,700 17.86% 246 $702,500 18.86% 250 $594,000 18.85% 222 $548,500 12.65% 216 $476,700 14.39% 232 $571,400 15.34% 265 $867,700 15.41% 255 $665,300 17.99% 235 $509,900 16.31% 195 $333,700 13.31% 223 $547,900 17.30% 236 $735,200 14.54% 212 $545,100 19.55% 211 $430,700 10.88% 196 $313,000 30.49% 211 $509,800 16.89% 235 $669,100 18.26% 220 $538,900 19.28% 226 $416,500 20.86% 182 $341,600 14.81% 233 $658,200 19.05% 230 $737,500 17.43% 223 $579,800 19.77% 254 $445,100 21.11% 185 $297,600 36.24% 220 $484,700 20.31% 240 $665,100 19.69% 234 $530,900 22.11% 185 $364,100 19.78% 191 $284,900 21.14%
- 27. Toronto Real Estate Board Market Watch, December 2016 HISTORIC ANNUAL STATISTICS 27 Year Sales Average Price 2004 2005 2006 2007 2008 2009 2010 2011 2012 2013 2014 83,501 $315,231 84,145 $335,907 83,084 $351,941 93,193 $376,236 74,552 $379,347 87,308 $395,460 85,545 $431,276 89,096 $465,014 85,496 $497,130 87,049 $522,958 92,782 $566,624 2015 MONTHLY STATISTICS NOTES 1 - Sales, dollar volume, average sale prices and median sale prices are based on firm transactions entered into the TREB MLS® system between the first and last day of the month/period being reported. 2 - New listings entered into the TREB MLS® system between the first and last day of the month/period being reported. 3 - Active listings at the end of the last day of the month/period being reported. 4 - Ratio of the average selling price to the average listing price for firm transactions entered into the TREB MLS® system between the first and last day of the month/period being reported. 5 - Average number of days on the market for firm transactions entered into the TREB MLS® system between the first and last day of the month/period being reported. 6 - Due to past changes to TREB's service area, caution should be exercised when making historical comparisons. 7 - Past monthly and year-to-date figures are revised on a monthly basis. 8 - SNLR = Sales-to-New Listings Ratio. Calculated using a 12-month moving average (sales/new listings). 9 - Mos. Inv. = Months of Inventory. Calculated using a 12-month moving average (active listings/sales). 2016 MONTHLY STATISTICS *For historic annual sales and average price data over a longer time frame go to: January February March April May June July August September October November December Year to Date 4,640 $630,193 7,583 $685,738 10,260 $688,011 12,017 $739,767 12,793 $752,324 12,730 $746,961 9,934 $710,538 9,751 $710,975 9,836 $756,168 9,723 $762,747 8,528 $777,181 5,338 $730,472 113,133 $724,256 January February March April May June July August September October November December Annual 4,318 $552,925 6,294 $596,320 8,886 $613,818 11,254 $636,094 11,640 $649,648 11,905 $639,309 9,813 $608,875 7,943 $603,534 8,147 $627,867 8,759 $630,254 7,337 $632,774 4,917 $608,714 101,213 $622,121 1,6,7 1,7 1,7 http://www.torontorealestateboard.com/market_news/market_watch/historic_stats/p df/TREB_historic_statistics.pdf Copyright® 2017 Toronto Real Estate Board $729,922113,133