
Recommandé
Contenu connexe
Tendances
Tendances (20)
Similaire à Big data Analytics
Similaire à Big data Analytics (20)
Dernier
Dernier (20)
Big data Analytics
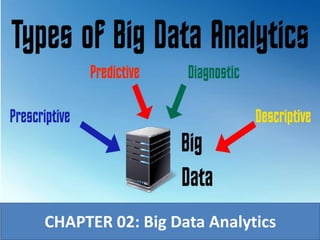
- 1. CHAPTER 02: Big Data Analytics
- 2. BDA • Big data analytics is the process of examining large and varied data sets -- i.e., big data -- to uncover – hidden patterns, – unknown correlations, – market trends, – customer preferences – Meaningful/actionable information/insights to make faster and better decisions (informed decisions).
- 3. BDA • Data analytics helps to slice and dice the data to extract insights that allow to leverage this data to give an organization a competitive advantage. • BDA supports 360 degree view of the customer (clickstream data which is unstructured).
- 7. BDA • Businesses can use advanced analytics techniques such as – text analytics, – machine learning, – predictive analytics, – data mining, statistics – and natural language processing to gain new insights from previously untapped data sources with existing enterprise data.
- 8. BDA • It is technology enabled analytics to process and analyze big data. • BDA is about gaining a meaningful, deeper, and richer insight into the business to steer it in the right direction, understanding the customer’s demographics to cross-sell and up-sell to them, by better leveraging the services of vendors and suppliers, etc.
- 10. BDA • BDA is a tight handshake between three communities: IT, business users, and data scientists. • BDA is working with data sets whose volume and variety exceed the current storage, processing capabilities and infrastructure of an enterprise. • BDA is about moving code to data, because programs for distributed processing is tiny (few KBs) compared to the data (TB, PB, EB, ZB and YB).
- 11. Types of USD available for analysis BDA RFID CRM ERP POS Websites Social Media
- 12. What big data analytics is not?
- 13. Why the sudden hype around BDA? 1. Data is growing at a 40% compound annual rate, reaching nearly 74 ZB by 2021. The volume of business data worldwide is expected to double every 1.2 years. – Examples: – Wal-Mart : Process one million customer transactions per hour. – Twitter: 500 million tweets per day. – 2.7 billion “Likes” and comments are posted by Facebook users in a day.
- 14. Why the sudden hype around BDA? 2. Cost per gigabyte of storage has hugely dropped. 3. An overwhelming number of user friendly analytics tools are available in the market today. 4. Three Digital Accelerators : bandwidth, digital storage, and processing power.
- 15. Classification of Analytics 1. First School of Thought. 2. Second School of Thought
- 16. First school of thought • Classified analytics into: – Basic analytics – Operationalized analytics – Advanced analytics – Monetized analytics. • convert into or express in the form of currency.
- 18. First school of thought • Basic analytics: – Deals with slicing and dicing of data to help with basic business insights. – Reporting on historical data, basic visualization, etc.. • Operationalized analytics: – Focusing on the integration of analytics into business units in order to take specific action on insights. – Analytics are integrated into both production technology systems and business processes.
- 19. First school of thought • Advanced analytics: – Forecasting for the future by predictive and prescriptive modeling. • Monetized analytics: – Used to derive direct business revenue. – The act of generating measurable economic benefits from available data sources
- 20. Six ways to indirectly monetize your data 1. Reduce costs 2. Enhance your product or service 3. Enter new business sectors or tap into new types of customers 4. Develop new products, services, or markets. 5. Drive sales and marketing 6. Improve productivity and efficiencies.
- 21. Second school of thought
- 24. Analytics 1.0, 2.0 and 3.0
- 25. Analytics 1.0 (1950-2009) • Descriptive statistics. • Report on events, occurrences, etc. of the past. • Key questions: – What happened? – Why did it happen? • Data: – CRM, ERP, or 3rd party applications – Small and structured data sources, DW and Data mart – Internally sourced. – Relational databases.
- 26. Analytics 2.0 (2005-2012) • Descriptive + predictive statistics • Uses data from the past to make predictions for the future. • Key questions: – What will happen? – Why will it happen? • Data: – Big data (SD, USD and SSD) – Massive parallel servers running Hadoop – Externally sourced. – DB applications, Hadoop clusters, Hadoop environment.
- 27. Analytics 3.0 (2012 to present) • Descriptive +predictive + Prescriptive statistics. • Uses data from the past to make predictions for the future and at the same time make recommendations to leverage the situations to one’s advantage. • Key questions: – What will happen? – When will it happen? – Why will it happen? – What action should be taken? • Data: – Big data (SD, USD and SSD) in real-time. – Internally + Externally sourced. – In memory analytics, M/C learning, agile analytical methods.
- 28. Challenges that prevent business from capitalizing on big data 1. Getting the business units to share information across organizational silos. 2. Finding the right skills (business analysts and data scientists) that can manage large amounts of SD, SSD, and USD and create insight from it. 3. The need to address the storage and processing of large volume, velocity and variety of big data. 4. Deciding whether to use SD or USD, internal or external data to make business decisions. 5. Choosing the optimal way to report finding and analysis of big data for the presentation to make the more sense. 6. Determining what to do with insights created from big data.
- 29. Top challenges facing big data 1. The practical issues of storing all the data (Scale) 2. Security: lack of authentication and authorization 3. Data schema (No fixed and rigid schema) leads to dynamic schema. 4. Consistency /Eventual consistency 5. Availability (24 x 7) (Failure transparency) 6. Partition tolerance (Both H/w and S/w) 7. Validating big data (Data quality) : accuracy, completeness and timeliness.
- 30. Importance
- 31. Importance of BDA • Cost reduction: Cost-effective storage system for huge data sets. [Hadoop and cloud based analytics] • Faster, better decision making: Provides ways to analyze information quickly and make decisions. • [Hadoop processing speed and in-memory analytics, combined with the ability to analyze new sources of data]
- 32. Importance of BDA • New products and services: Evaluation of customer needs and satisfaction through BDA. –business can create new products to meet customers’ needs. –With BDA, more companies are creating new products, including new revenue opportunities, more effective marketing, better customer service. –Example: Automated car, health care apps and entertainment apps, Bank apps, Govt. apps,
- 33. Technologies needed to meet challenges posed by big data 1. Cheap and abundant storage. 2. Faster processor to help with quicker processing of big data. 3. Affordable open-source, distributed big data platforms such as Hadoop. 4. Parallel processing, clustering, virtualization, large grid environments, high connectivity, high throughputs and low latency. 5. Cloud computing and other flexible resource allocation arrangements.
- 36. Data Science • Data science is an interdisciplinary field that uses scientific methods, processes, algorithms and systems to extract knowledge and insights from structured and unstructured data. • It employs techniques and theories drawn from many fields within the broad areas of mathematics, statistics, information technology including machine learning, probability models, classification, cluster analysis, data mining, databases, pattern recognition and visualization.
- 37. Data Science • Data Science is primarily used to make predictions and decisions using predictive, prescriptive analytics and machine learning. • Prescriptive analytics is all about providing advice. it not only predicts but suggests a range of prescribed actions and associated outcomes.
- 38. Data science – development of data product • A "data product" is a technical asset that: (1) utilizes data as input, and (2) processes that data to return algorithmically-generated results. • The classic example of a data product is a recommendation engine, which ingests user data, and makes personalized recommendations based on that data
- 39. Examples of data products: • Amazon's recommendation engines suggest items for you to buy. Netflix recommends movies to you. Spotify recommends music to you. • Gmail's spam filter is data product – an algorithm behind the scenes processes incoming mail and determines if a message is spam or not. • Computer vision used for self-driving cars is also data product – machine learning algorithms are able to recognize traffic lights, other cars on the road, pedestrians, etc.
- 40. The role of Data Science • The self-driving cars collect live data from sensors, including radars, cameras and lasers to create a map of its surroundings. Based on this data, it takes decisions like when to speed up, when to speed down, when to overtake, where to take a turn – making use of advanced machine learning algorithms. • Data Science can be used in predictive analytics: Data from ships, aircrafts, radars, satellites can be collected and analyzed to build models. These models will not only forecast the weather but also help in predicting the occurrence of any natural calamities.
- 41. Domains of Data Science Infographic
- 42. Difference between Data Analysis and Data Science • Data Analysis includes descriptive analytics and prediction to a certain extent. • On the other hand, Data Science is more about Predictive Analytics and Machine Learning. • Data Science is a more forward-looking approach, an exploratory way with the focus on analyzing the past or current data and predicting the future outcomes with the aim of making informed decisions.
- 43. Use-cases of for Data Science • Internet search • Digital Advertisements • Recommender Systems • Image Recognition • Speech Recognition • Gaming • Price Comparison Websites • Airline Route Planning • Fraud and Risk Detection • Medical diagnosis, etc.
- 44. Data Science is multi-disciplinary
- 45. Data Science process 1. Collecting raw data from multiple disparate data sources. 2. Processing the data 3. Integrating the data and preparing clean datasets 4. Engaging in explorative data analysis using model (ML model) and algorithms. 5. Preparing presentations using data visualization. 6. Communicating the findings to all stakeholders 7. Making faster and better decisions.
- 46. Business Acumen (wisdom) skills of Data Scientist • Understanding of domain • Business strategy • Problem solving • Communication • Presentation • Thirst for knowledge
- 47. Technology Expertise of Data Scientist • Good database knowledge such as RDBMS • Good NoSQL database knowledge such as MongoDB, Cassandra, Hbase, etc. • Languages such as Java, Python, R, C++, etc. • Open-source tools such as Hadoop. • Data warehousing • Data Mining, Pattern recognition, algorithms • Excellent understanding of machine learning techniques and algorithms, such as K-means, Regression, kNN, Naive Bayes, SVM, PCA, Decision tree, Tableau, Flare, Google visualization APIs, text analytics, DL, NLP, AI etc.
- 48. Mathematics Expertise of Data Scientist • Probability • Statistics • Linear Algebra • Calculus
- 49. Data Scientist • A data scientist is a professional responsible for collecting, analyzing and interpreting large amounts of data to identify ways to help a business to improve operations and gain a competitive edge over competitors. • They're part mathematician, part computer scientist and part trend-spotter.
- 50. Responsibilities of Data Scientist 1. Prepare and integrates large and varied datasets and develop relevant data sets for analysis. 2. Thoroughly clean and prune data to discard irrelevant information 3. Applies business/domain knowledge to provide context. 4. Employs a blend of analytical techniques to develop models and algorithms to understand the data, interpret relationships, spot trends and unveil patterns.
- 51. Responsibilities of Data Scientist 5. Communicates or presents findings or results in the business context in a language that is understood by the different business stakeholders. 6. Invent new algorithms to solve problems and build new tools to automate work. (IIT)
- 52. Responsibilities of Data Scientist 7. Employ sophisticated analytics programs, machine learning and statistical methods to prepare data for use in predictive and prescriptive modeling. 8. Explore and examine data from a variety of angles to determine hidden weaknesses, trends and/or opportunities
- 53. Terminologies/Technologies used in big data environment 1. In-memory analytics 2. In-database processing 3. Symmetric multiprocessor system (SMP) 4. Massively parallel processing 5. Parallel and distributed systems 6. Shared nothing architecture
- 54. In-memory analytics • In-memory analytics is an approach to querying data that resides in a computer's random access memory (RAM), as opposed to querying data that is stored on physical disks. • This results in reduced query response times, allowing analytic applications to support faster business decisions. • In-memory analytics is achieved through adoption of 64- bit architectures, which can handle more memory and larger files compared to 32-bit.
- 55. In-database processing • In-database analytics is a technology that allows data processing to be conducted within the database by building analytic logic into the database itself. • In-database processing, sometimes referred to as in- database analytics, refers to the integration of data analytics into data warehousing functionality. • It eliminates the time and effort required to transform data and move it back and forth between a database and a separate analytics application. • Example: credit card fraud detection, Bank risk management, etc.
- 56. Symmetric multiprocessor system (SMP) • SMP (symmetric multiprocessing) is the processing of programs by multiple processors that share a common operating system and memory. • In symmetric (or "tightly coupled") multiprocessing, the processors share memory and the I/O bus or data path. • A single copy of the operating system is in charge of all the processors (homogeneous).
- 58. Massively parallel processing (MPP) • MPP (massively parallel processing) is the coordinated processing of a problem (program) by multiple processors that work on different parts of the program in parallel, with each processor having its own operating system and dedicated memory. • The MPP processors communicate using message passing. • Typically, the setup for MPP is more complicated, requiring thought about how to partition a common database among processors and how to assign work among the processors. An MPP system is also known as a "loosely coupled" or "shared nothing" system.
- 59. Massively parallel processing (MPP) • An MPP system is considered better than a symmetrically parallel system ( SMP ) for applications that allow a number of databases to be searched in parallel. These include decision support system, data warehouse and big data applications.
- 61. Parallel Systems
- 64. Shared Nothing architecture (SNA) • A shared nothing architecture (SN) is a distributed computing architecture in which each node is independent and self-sufficient. More specifically, none of the nodes share memory or disk storage. • shared-nothing is often called massively parallel processor (MPP). Many research prototypes and commercial products have adopted the shared-nothing architecture because it has the best scalability. • In the shared-nothing architecture, each node is made of processor, main memory and disk and communicates with other nodes through the interconnection network. Each node is under the control of its own copy of the operating system.
- 65. SNA advantages 1. Fault isolation 2. Scalability 3. Absence of single point of failure 4. Self-healing capabilities
- 66. CAP Theorem
- 67. CAP Theorem • The CAP theorem, also named Brewer's theorem after computer scientist Eric Brewer, states that it is impossible for a distributed data store to simultaneously provide more than two out of the following three guarantees: 1. Consistency: Every read fetches the last write. 2. Availability: Every request gets a response on success/failure. 3. Partition tolerance: System continues to work despite message loss or partial failure or N/W partition. • Distributed data store: It is is a computer network where information is stored on more than one node, often in a replicated fashion. It is also known as distributed database.
- 68. CAP Theorem
- 69. Possible combinations of CAP for databases 1. Availability and Partition Tolerance (AP) 2. Consistency and Partition Tolerance (CP) 3. Consistency and Availability (CA) Note: Google’s BigTable, Amazon’s Dynamo and Facebook’s Cassandra uses one of these combinations.
- 71. BASE • BASE stands for Basically Available, Soft state, Eventual consistency and used to achieve high availability in distributed computing. • Basically available indicates that the system guarantees the availability, in terms of the CAP theorem. • Soft state indicates that the state of the system may change over time. • Eventual consistency indicates that the system will become consistent over time or after a certain time all nodes become consistent,
- 72. Few top analytics tools 1. MS Excel 2. SAS 3. IBM SPSS Modeler 4. Statistica 5. QlickView 6. Tableau 7. R analytics 8. Weka 9. Apache Spark 10. KNIME, Rapidminer 11. Splunk and so on.