2013 Holiday Shopping Data Recap - ShopVisible
•
0 j'aime•348 vues

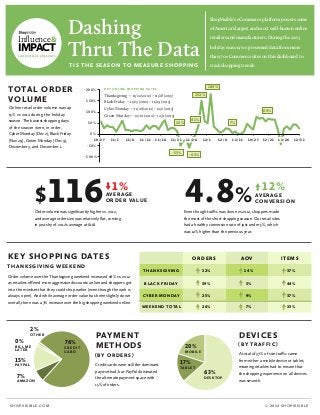
ShopVisible's eCommerce platform powers some of America's largest and most well-known online retailers and manufacturers. During the 2013 holiday season, we presented data from more than 70 eCommerce sites on our dashboard to track shopping trends.
Recommandé

Recommandé
Contenu connexe
Dernier
Dernier (20)
En vedette
En vedette (20)
2013 Holiday Shopping Data Recap - ShopVisible
- 1. Influence& IMPACT SHOPVISIBLE PRESENTS Dashing Thru The Data ShopVisible’s eCommerce platform powers some of America’s largest and most well-known online retailers and manufacturers. During the 2013 holiday season, we presented data from more than 70 eCommerce sites on this dashboard to T I S T H E S E A S O N TO M E A S U R E S H O P P I N G TOTAL ORDER VOLUME 200% 184% K E Y O N L I N E S H O P P I N G D AT E S 152% Thanksgiving — 11/22 (2012) – 11/28 (2013) 150% Online retail order volume was up 15% vs 2012 during the holiday season. The busiest shopping days of the season were, in order, Cyber Monday (Dec 2), Black Friday (Nov 29), Green Monday (Dec 9), December 3, and December 1. 100% Black Friday — 11/23 (2012) – 11/29 (2013) Cyber Monday — 11/26 (2012) – 12/2 (2013) 69% Green Monday — 12/10 (2012) – 12/9 (2013) 41% 13% 50% 10/27 11/1 11/6 11/11 11/16 11/21 11/26 -53% 15% PAY PA L 7% AMAZON SHOPVISIBLE.COM 12/21 12/26 12/31 12% AV E R A G E CONVERSION ORDERS AOV ITEMS THANKSGIVING Order volume over the Thanksgiving weekend increased 26% vs. 2012 as retailers offered more aggressive discounts online and shoppers got into the mindset that they could shop earlier (even though the web is always open). And while average order value has been slightly down overall, there was a 7% increase over the big shopping weekend online. CREDIT CARD 10/27 -63% KEY SHOPPING DATES BILL ME L AT E R 12/11 Even though traffic was down vs 2012, shoppers made the most of the short shopping season. Our retail sites had a healthy conversion rate of just under 5%, which was 12% higher than the previous year. THANKSGIVING WEEKEND 76% 12/6 4.8% 1% AV E R A G E O R D E R VA L U E Order volume was significantly higher vs. 2012, and average order size was relatively flat, coming in just shy of 2012's average at $116. 0% 12/1 -50% $ 116 2% 7% 0% -100% OTHER track shopping trends. 32% 14% 37% B L A C K F R I D AY 39% 3% 44% C Y B E R M O N D AY 25% 9% 37% W E E K E N D TO TA L 26% 7% 33% PAYMENT METHODS (BY ORDERS) Credit cards were still the dominant pay method, but PayPal dominated the alternate payment space with 15% of orders. DEVICES (BY TRAFFIC) 20% MOBILE 17% TA B L E T 63% D E S K TO P A total of 37% of site traffic came from either a mobile device or tablet, meaning retailers had to ensure that the shopping experience on all devices was smooth. © 2014 SHOPVISIBLE