Google Data Studio_Building a User Journey Funnel with Google Analytics
•
0 j'aime•149 vues

A simple and powerful way of layering different segments to extract insight from the user journey funnel. Data source: Google Analytics demo

Recommandé
Contenu connexe
Tendances
Similaire à Google Data Studio_Building a User Journey Funnel with Google Analytics
Similaire à Google Data Studio_Building a User Journey Funnel with Google Analytics (20)
Plus de Silvia Alongi
Plus de Silvia Alongi (20)
Dernier
Dernier (20)
Google Data Studio_Building a User Journey Funnel with Google Analytics
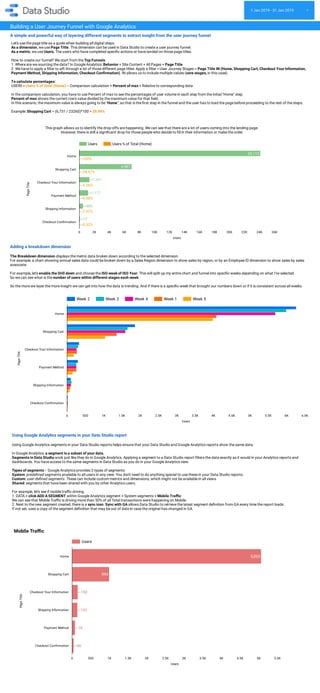
- 1. Week 2 Week 3 Week 4 Week 1 Week 5 0 500 1K 1.5K 2K 2.5K 3K 3.5K 4K 4.5K 5K 5.5K 6K 6.5K Home Shopping Cart Checkout Your Information Payment Method Shipping Information Checkout Con rmation Users PageTitle The Breakdown dimension displays the metric data broken down according to the selected dimension. For example, a chart showing annual sales data could be broken down by a Sales Region dimension to show sales by region, or by an Employee ID dimension to show sales by sales associate. For example, let's enable the Drill down and choose the ISO week of ISO Year. This will split up my entire chart and funnel into speci c weeks depending on what I've selected. So we can see what is the number of users within different stages each week. So the more we layer the more insight we can get into how the data is trending. And if there is a speci c week that brought our numbers down or if it is consistent across all weeks. This graph allows us to identify the drop-offs are happening. We can see that there are a lot of users coming into the landing page. However, there is still a signi cant drop for those people who decide to ll in their information or make the order. Users 0 500 1K 1.5K 2K 2.5K 3K 3.5K 4K 4.5K 5K 5.5K Home Shopping Cart Checkout Your Information Shipping Information Payment Method Checkout Con rmation 5,063 994 150 143 76 46 Users PageTitle Users Users % of Total (Home) 0 2K 4K 6K 8K 10K 12K 14K 16K 18K 20K 22K 24K 26K Home Shopping Cart Checkout Your Information Payment Method Shipping Information Checkout Con rmation 24,113 6,961 1,341 1,177 486 77 100% 28.87% 5.56% 4.88% 2.02% 0.32% Users PageTitle Let's use the page title as a guide when building all digital steps. As a dimension, we use Page Title. This dimension can be used in Data Studio to create a user journey funnel. As a metric, we use Users. The users who have completed speci c actions or have landed on those page titles. How to create our funnel? We start from the Top Funnels. 1. Where are we sourcing the data? In Google Analytics: Behavior + Site Content + All Pages + Page Title 2. We have to apply a lter to sift through a lot of those different page titles: Apply a lter > User Journey Stages = Page Title IN (Home, Shopping Cart, Checkout Your Information, Payment Method, Shipping Information, Checkout Con rmation). IN allows us to include multiple values (core stages, in this case). To calculate percentages: USERS > Users % of Total (Home) = Comparison calculation + Percent of max + Relative to corresponding data In the comparison calculation, you have to use Percent of max to see the percentages of user volume in each step from the initial "Home" step. Percent of max shows the current row's value divided by the maximum value for that eld. In this scenario, the maximum value is always going to be "Home", as that is the rst step in the funnel and the user has to load the page before proceeding to the rest of the steps. Example: Shopping Cart = (6,731 / 23260)*100 = 28.94% Using Google Analytics segments in your Data Studio reports helps ensure that your Data Studio and Google Analytics reports show the same data. In Google Analytics, a segment is a subset of your data. Segments in Data Studio work just like they do in Google Analytics. Applying a segment to a Data Studio report lters the data exactly as it would in your Analytics reports and dashboards. You have access to the same segments in Data Studio as you do in your Google Analytics view. Types of segments - Google Analytics provides 3 types of segments: System: prede ned segments available to all users in any view. You don't need to do anything special to use these in your Data Studio reports. Custom: user-de ned segments. These can include custom metrics and dimensions, which might not be available in all views. Shared: segments that have been shared with you by other Analytics users. For example, let's see if mobile tra c driving. 1. DATA + click ADD A SEGMENT within Google Analytics segment + System segments + Mobile Tra c We can see that Mobile Tra c is driving more than 50% of all Total transactions were happening on Mobile. 2. Next to the new segment created, there is a sync icon. Sync with GA allows Data Studio to retrieve the latest segment de nition from GA every time the report loads. If not set, uses a copy of the segment de nition that may be out of date in case the original has changed in GA. Mobile Tra c Building a User Journey Funnel with Google Analytics 1 Jan 2019 - 31 Jan 2019 ▼ A simple and powerful way of layering different segments to extract insight from the user journey funnel Adding a breakdown dimension Using Google Analytics segments in your Data Studio report