Soumettre la recherche
Mettre en ligne
User Behaviour Report - Google Data Studio
•
0 j'aime
•
103 vues
Silvia Alongi
Suivre
Understanding user behaviour Data source: [Sample] Google Analytics Data
Lire moins
Lire la suite
Données & analyses
Signaler
Partager
Signaler
Partager
1 sur 1
Recommandé
Seo 2014 New Era, New Strategy
Richard Hill
Video Case Groupon
Video Case Groupon
Mayuree Srikulwong
Gamification - making work fun, or making fun of work?
Collabor8now Ltd
Swayne Hill, Cloud9 Vision & Update
Cloud9 Analytics
[New] google analytics_behavior_overview
[New] google analytics_behavior_overview
MAYANKDIXIT57
Digital Marketing Performance Report_Google Data Studio
Silvia Alongi
Marketing Performance Report - Google Merchandise Store
Rahul Kumar
Venture Capital - Innovation, Market Sizing
Richard Chan, MBA
iMedia Agency Summit: Scottsdale, AZ, December 6, 2015
Joe Pych
Radical Transparency
97th Floor
Financial Statement
Financial Statement
Huy Lê
KDD capabilities 2016 v1.0
KDDanalytics
Digital solutions review
Ralph Paglia
Thinking Outside the Box Professional Development Seminar Social Marketing: M...
Paramore | the digital agency
BMO Capital Capital Markets at DES: The State of Advertising Technology
Digiday
Google presentation
Google presentation
Vik Reddy
Google presentation
Google presentation
Vik Reddy
Google - Investment Analysis & Mgmt 120213 10pm v4 final
Richard Chan, MBA
Increase AUM with Marketing Automation Part 3: Marketing Analytics to Prove ROI
Marketo
Understanding Distributor Marketing Tool Usage & Effectiveness
Channel Marketing Group
Final Google[1]
Final Google[1]
Cody Fergusson
Fitbit should buy smart mat
Chris DiGiacomandrea
What is *Pacing* in Marketing Performance Measurement? (And why you’d be fool...
Joe Pych
Pet tracker financial model ppt
Carlos Felipe Colmenares Misas
The 15 Minute Breakdown: The Answer to Signal Loss
Tinuiti
KTC Oppday 58Q2
KTC Oppday 58Q2
Share Rora
Google Data Studio_Digital Performance Overview_Template
Silvia Alongi
OIL Ultime Digital Campaign 2018
Digitall
POWER BI - Pie Chart, Doughnut Chart, Treemap, Funnel Chart
Silvia Alongi
POWER BI - Ribbon Chart, Waterfall, Scatter Chart, Bubble Chart, Dot Plot Chart
Silvia Alongi
Contenu connexe
Similaire à User Behaviour Report - Google Data Studio
iMedia Agency Summit: Scottsdale, AZ, December 6, 2015
Joe Pych
Radical Transparency
97th Floor
Financial Statement
Financial Statement
Huy Lê
KDD capabilities 2016 v1.0
KDDanalytics
Digital solutions review
Ralph Paglia
Thinking Outside the Box Professional Development Seminar Social Marketing: M...
Paramore | the digital agency
BMO Capital Capital Markets at DES: The State of Advertising Technology
Digiday
Google presentation
Google presentation
Vik Reddy
Google presentation
Google presentation
Vik Reddy
Google - Investment Analysis & Mgmt 120213 10pm v4 final
Richard Chan, MBA
Increase AUM with Marketing Automation Part 3: Marketing Analytics to Prove ROI
Marketo
Understanding Distributor Marketing Tool Usage & Effectiveness
Channel Marketing Group
Final Google[1]
Final Google[1]
Cody Fergusson
Fitbit should buy smart mat
Chris DiGiacomandrea
What is *Pacing* in Marketing Performance Measurement? (And why you’d be fool...
Joe Pych
Pet tracker financial model ppt
Carlos Felipe Colmenares Misas
The 15 Minute Breakdown: The Answer to Signal Loss
Tinuiti
KTC Oppday 58Q2
KTC Oppday 58Q2
Share Rora
Google Data Studio_Digital Performance Overview_Template
Silvia Alongi
OIL Ultime Digital Campaign 2018
Digitall
Similaire à User Behaviour Report - Google Data Studio
(20)
iMedia Agency Summit: Scottsdale, AZ, December 6, 2015
Radical Transparency
Financial Statement
Financial Statement
KDD capabilities 2016 v1.0
Digital solutions review
Thinking Outside the Box Professional Development Seminar Social Marketing: M...
BMO Capital Capital Markets at DES: The State of Advertising Technology
Google presentation
Google presentation
Google presentation
Google presentation
Google - Investment Analysis & Mgmt 120213 10pm v4 final
Increase AUM with Marketing Automation Part 3: Marketing Analytics to Prove ROI
Understanding Distributor Marketing Tool Usage & Effectiveness
Final Google[1]
Final Google[1]
Fitbit should buy smart mat
What is *Pacing* in Marketing Performance Measurement? (And why you’d be fool...
Pet tracker financial model ppt
The 15 Minute Breakdown: The Answer to Signal Loss
KTC Oppday 58Q2
KTC Oppday 58Q2
Google Data Studio_Digital Performance Overview_Template
OIL Ultime Digital Campaign 2018
Plus de Silvia Alongi
POWER BI - Pie Chart, Doughnut Chart, Treemap, Funnel Chart
Silvia Alongi
POWER BI - Ribbon Chart, Waterfall, Scatter Chart, Bubble Chart, Dot Plot Chart
Silvia Alongi
Power BI - Table, Matrix, Bar Charts, Line Chart, Area Chart and Combo Charts
Silvia Alongi
Power BI - Mapping
Power BI - Mapping
Silvia Alongi
Power BI - Using conditional formatting in Tables
Silvia Alongi
Power BI - Measure performance (Gauges, Cards, KPIs)
Silvia Alongi
Affiliate Marketing_Sales Deck
Silvia Alongi
Search Landscape Analysis (Competitor Analysis)
Silvia Alongi
SERP Layout on Desktop Search_Training Deck
Silvia Alongi
Keyword Research Process_Training Deck
Silvia Alongi
Keyword Ranking Report
Silvia Alongi
Google Data Studio_Calculated Fields and Custom Dimensions
Silvia Alongi
Google Data Sudio_Dynamic Tables,Filters and Aggregation
Silvia Alongi
Google Data Studio_Building a User Journey Funnel with Google Analytics
Silvia Alongi
SEM Exam - 50 Questions with answers
Silvia Alongi
SEO exam - 50 Questions with answers
Silvia Alongi
Report. Affiliate marketing. Plan of attack for generating new affiliate busi...
Silvia Alongi
Programmatic Revolution_Report_Silvia Alongi
Silvia Alongi
The Programmatic Revolution_Presentation_Silvia Alongi
Silvia Alongi
VIVA SRL - Marketing Plan
Silvia Alongi
Plus de Silvia Alongi
(20)
POWER BI - Pie Chart, Doughnut Chart, Treemap, Funnel Chart
POWER BI - Ribbon Chart, Waterfall, Scatter Chart, Bubble Chart, Dot Plot Chart
Power BI - Table, Matrix, Bar Charts, Line Chart, Area Chart and Combo Charts
Power BI - Mapping
Power BI - Mapping
Power BI - Using conditional formatting in Tables
Power BI - Measure performance (Gauges, Cards, KPIs)
Affiliate Marketing_Sales Deck
Search Landscape Analysis (Competitor Analysis)
SERP Layout on Desktop Search_Training Deck
Keyword Research Process_Training Deck
Keyword Ranking Report
Google Data Studio_Calculated Fields and Custom Dimensions
Google Data Sudio_Dynamic Tables,Filters and Aggregation
Google Data Studio_Building a User Journey Funnel with Google Analytics
SEM Exam - 50 Questions with answers
SEO exam - 50 Questions with answers
Report. Affiliate marketing. Plan of attack for generating new affiliate busi...
Programmatic Revolution_Report_Silvia Alongi
The Programmatic Revolution_Presentation_Silvia Alongi
VIVA SRL - Marketing Plan
Dernier
2024 Q2 Orange County (CA) Tableau User Group Meeting
Alison Pitt
社内勉強会資料 Mamba - A new era or ephemeral
NABLAS株式会社
一比一原版麦考瑞大学毕业证成绩单如何办理
cyebo
AI Imagen for data-storytelling Infographics.pdf
MichaelSenkow
Atlantic Grupa Case Study (Mintec Data AI)
Jon Hansen
Exploratory Data Analysis - Dilip S.pptx
DilipVasan
一比一原版(Monash毕业证书)莫纳什大学毕业证成绩单如何办理
pyhepag
Webinar One View, Multiple Systems No-Code Integration of Salesforce and ERPs
CEPTES Software Inc
一比一原版加利福尼亚大学尔湾分校毕业证成绩单如何办理
pyhepag
How I opened a fake bank account and didn't go to prison
Payment Village
一比一原版西悉尼大学毕业证成绩单如何办理
pyhepag
Data Analytics for Digital Marketing Lecture for Advanced Digital & Social Me...
Valters Lauzums
Machine Learning for Accident Severity Prediction
Boston Institute of Analytics
Abortion pills in Dammam Saudi Arabia// +966572737505 // buy cytotec
Abortion pills in Riyadh +966572737505 get cytotec
Pre-ProductionImproveddsfjgndflghtgg.pptx
Stephen266013
Data Visualization Exploring and Explaining with Data 1st Edition by Camm sol...
ssuserf63bd7
Slip-and-fall Injuries: Top Workers' Comp Claims
Bisnar Chase Personal Injury Attorneys
Easy and simple project file on mp online
balibahu1313
一比一原版纽卡斯尔大学毕业证成绩单如何办理
cyebo
basics of data science with application areas.pdf
vyankatesh1
Dernier
(20)
2024 Q2 Orange County (CA) Tableau User Group Meeting
社内勉強会資料 Mamba - A new era or ephemeral
一比一原版麦考瑞大学毕业证成绩单如何办理
AI Imagen for data-storytelling Infographics.pdf
Atlantic Grupa Case Study (Mintec Data AI)
Exploratory Data Analysis - Dilip S.pptx
一比一原版(Monash毕业证书)莫纳什大学毕业证成绩单如何办理
Webinar One View, Multiple Systems No-Code Integration of Salesforce and ERPs
一比一原版加利福尼亚大学尔湾分校毕业证成绩单如何办理
How I opened a fake bank account and didn't go to prison
一比一原版西悉尼大学毕业证成绩单如何办理
Data Analytics for Digital Marketing Lecture for Advanced Digital & Social Me...
Machine Learning for Accident Severity Prediction
Abortion pills in Dammam Saudi Arabia// +966572737505 // buy cytotec
Pre-ProductionImproveddsfjgndflghtgg.pptx
Data Visualization Exploring and Explaining with Data 1st Edition by Camm sol...
Slip-and-fall Injuries: Top Workers' Comp Claims
Easy and simple project file on mp online
一比一原版纽卡斯尔大学毕业证成绩单如何办理
basics of data science with application areas.pdf
User Behaviour Report - Google Data Studio
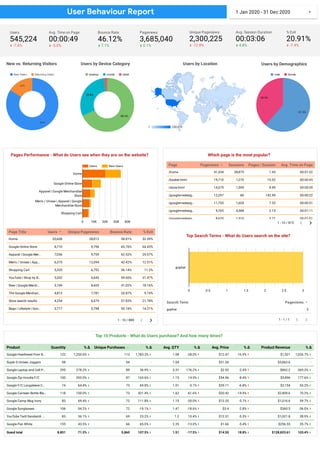
1.
Pages Performance -
What do Users see when they are on the website? Page Title Users Unique Pageviews Bounce Rate % Exit Home 20,608 28,012 38.81% 32.59% Google Online Store 8,710 9,796 65.76% 64.43% Apparel | Google Mer… 7,056 9,759 62.52% 29.57% Men's / Unisex | App… 6,375 12,394 42.42% 12.51% Shopping Cart 5,320 6,752 36.14% 11.2% YouTube | Shop by B… 5,202 6,643 59.66% 31.47% New | Google Merch… 5,199 8,429 41.02% 18.16% The Google Merchan… 4,813 7,781 20.87% 9.74% Store search results 4,254 6,079 57.83% 21.78% Bags | Lifestyle | Goo… 3,717 5,798 50.74% 14.21% ▼ 1 - 10 / 880 < > Users New Users 0 10K 20K 30K 40K Home Google Online Store Apparel | Google Merchandise Store Men's / Unisex | Apparel | Google Merchandise Store Shopping Cart Search Term Pageviews gopher 3 ▼ 1 - 1 / 1 < > Top Search Terms - What do Users search on the site? 1 Jan 2020 - 31 Dec 2020 ▼ User Behaviour Repo Users 545,224 -7.6% Unique Pageviews 2,300,225 -12.8% Pageviews 3,685,040 0.1% Avg. Session Duration 00:03:06 4.8% % Exit 20.91% -7.4% Bounce Rate 46.12% 7.1% Avg. Time on Page 00:00:49 -5.0% New vs. Returning Visitors New Visitor Returning Visitor 16% 84% 1 1 1 232,419 232,419 232,419 Users by Location male female 38.5% 61.5% Users by Demographics Which page is the most popular? 0 0.5 1 1.5 2 2.5 3 gopher Page Pageviews Sessions Pages / Session Avg. Time on Page /home 41,334 28,875 1.43 00:01:32 /basket.html 19,710 1,270 15.52 00:00:45 /store.html 14,379 1,599 8.99 00:00:39 /google+redesig… 12,297 86 142.99 00:00:22 /google+redesig… 11,755 1,605 7.32 00:00:51 /google+redesig… 9,765 4,588 2.13 00:01:11 /google+redesig… 8,620 1,510 5.71 00:01:01 ▼ 1 - 10 / 815 < > desktop mobile tablet 29.8% 68.4% Users by Device Category Product Quantity % Δ Unique Purchases % Δ Avg. QTY % Δ Avg. Price % Δ Product Revenue % Δ Google Heathered Pom B… 122 1,255.6% 113 1,783.3% 1.08 -28.0% $12.47 -16.9% $1,521 1,026.7% Super G Unisex Joggers 98 - 94 - 1.04 - $31.26 - $3,063.6 - Google Laptop and Cell P… 295 278.2% 89 36.9% 3.31 176.2% $2.92 -2.4% $862.2 269.3% Google Zip Hoodie F/C 100 203.0% 87 163.6% 1.15 14.9% $54.96 -8.4% $5,496 177.6% Google F/C Longsleeve C… 74 64.4% 73 69.8% 1.01 -3.1% $29.11 -6.8% $2,154 53.2% Google Canteen Bottle Bla… 118 100.0% 73 421.4% 1.62 -61.6% $20.42 -14.9% $2,409.6 70.2% Google Camp Mug Ivory 83 69.4% 72 111.8% 1.15 -20.0% $12.25 -5.7% $1,016.6 59.7% Google Sunglasses 106 -34.2% 72 -19.1% 1.47 -18.6% $3.4 -2.8% $360.5 -36.0% YouTube Twill Sandwich … 83 36.1% 69 23.2% 1.2 10.4% $12.31 -5.3% $1,021.8 28.9% Google Pen White 155 43.5% 66 65.0% 2.35 -13.0% $1.66 -5.4% $256.55 35.7% Grand total 8,851 71.3% 5,860 107.5% 1.51 -17.5% $14.55 18.8% $128,823.61 103.4% … Top 10 Products - What do Users purchase? And how many times?