SlideShare une entreprise Scribd logo
1  sur  8
Télécharger pour lire hors ligne
Program Evaluation and Review Technique
PERT network chart for a seven-month project with five milestones (10 through 50) and six
activities (A through F).
The Program (or Project) Evaluation and Review Technique, commonly abbreviated
PERT, is a model for project management designed to analyze and represent the tasks
involved in completing a given project.
Overview
PERT is a method to analyze the involved tasks in completing a given project, especially the
time needed to complete each task, and identifying the minimum time needed to complete the
total project.
This model was invented by Booz Allen Hamilton, Inc. under contract to the United States
Department of Defense's US Navy Special Projects Office in 1958 as part of the Polaris
mobile submarine-launched ballistic missile project. This project was a direct response to the
Sputnik crisis. Some US government contracts required that PERT be used as part of
management supervision.
PERT was developed primarily to simplify the planning and scheduling of large and complex
projects. It was able to incorporate uncertainty by making it possible to schedule a project
while not knowing precisely the details and durations of all the activities. It is more of an
event-oriented technique rather than start- and completion-oriented, and is used more in
R&D-type projects where time, rather than cost, is the major factor.
This project model was the first of its kind, a revival for scientific management, founded in
Fordism and Taylorism. Only DuPont corporation's critical path method was invented at
roughly the same time as PERT.
The most recognizable feature of PERT is the "PERT Networks", a chart of interconnecting
timelines. PERT is intended for very large-scale, one-time, complex, non-routine projects.
PERT terminology and conventions
Conventions
 A PERT chart is a tool that facilitates decision making; The first draft of a PERT
chart will number its events sequentially in 10s (10, 20, 30, etc.) to allow the later
insertion of additional events.
 Two consecutive events in a PERT chart are linked by activities, which are
conventionally represented as arrows in the diagram above.
 The events are presented in a logical sequence and no activity can commence until its
immediately preceding event is completed.
 The planner decides which milestones should be PERT events and also decides their
―proper‖ sequence.
 A PERT chart may have multiple pages with many sub-tasks.
Pert is valuable to manage where multiple task are going simultaneously to reduce the
redundancy
Terminology
 A PERT event: is a point that marks the start or completion of one or more tasks. It
consumes no time, and uses no resources. It marks the completion of one or more
tasks, and is not ―reached‖ until all of the activities leading to that event have been
completed.
 A predecessor event: an event (or events) that immediately precedes some other event
without any other events intervening. It may be the consequence of more than one
activity.
 A successor event: an event (or events) that immediately follows some other event
without any other events intervening. It may be the consequence of more than one
activity.
 A PERT activity: is the actual performance of a task. It consumes time, it requires
resources (such as labour, materials, space, machinery), and it can be understood as
representing the time, effort, and resources required to move from one event to
another. A PERT activity cannot be completed until the event preceding it has
occurred.
 Optimistic time (BC): the minimum possible time required to accomplish a task,
assuming everything proceeds better than is normally expected
 Pessimistic time (WC): the maximum possible time required to accomplish a task,
assuming everything goes wrong (but excluding major catastrophes).
 Most likely time (ML): the best estimate of the time required to accomplish a task,
assuming everything proceeds as normal.
 Expected time (TE): the best estimate of the time required to accomplish a task,
assuming everything proceeds as normal (the implication being that the expected time
is the average time the task would require if the task were repeated on a number of
occasions over an extended period of time).
TE = (BC + 4ML + WC) ÷ 6
 Critical Path: the longest possible continuous pathway taken from the initial event to
the terminal event. It determines the total calendar time required for the project; and,
therefore, any time delays along the critical path will delay the reaching of the
terminal event by at least the same amount.
 Critical Activity: An activity that has total float equal to zero. Activity with zero float
does not mean it is on critical path.
 Lead time (rhymes with "feed", not "fed"): the time by which a predecessor event
must be completed in order to allow sufficient time for the activities that must elapse
before a specific PERT event is reached to be completed.
 Lag time: the earliest time by which a successor event can follow a specific PERT
event.
 Slack: the slack of an event is a measure of the excess time and resources available in
achieving this event. Positive slack(+) would indicate ahead of schedule; negative
slack would indicate behind schedule; and zero slack would indicate on schedule.
 Fast tracking: performing more critical activities in parallel
 Crashing critical path: Shortening duration of critical activities
 Float or Slack is the amount of time that a task in a project network can be delayed
without causing a delay - Subsequent tasks – (free float) or Project Completion –
(total float)
Implementing PERT
The first step to scheduling the project is to determine the tasks that the project requires and
the order in which they must be completed. The order may be easy to record for some tasks
(e.g. When building a house, the land must be graded before the foundation can be laid) while
difficult for others (There are two areas that need to be graded, but there are only enough
bulldozers to do one). Additionally, the time estimates usually reflect the normal, non-rushed
time. Many times, the time required to execute the task can be reduced for an additional cost
or a reduction in the quality.
In the following example there are seven tasks, labeled A through G. Some tasks can be done
concurrently (A and B) while others cannot be done until their predecessor task is complete
(C cannot begin until A is complete). Additionally, each task has three time estimates: the
optimistic time estimate (BC), the most likely or normal time estimate (ML), and the
pessimistic time estimate (WC). The expected time (TE) is computed using the formula (BC +
4ML + WC)/6.
Activity Predecessor
Time estimates
Expected time
Opt. (BC) Normal (ML) Pess. (WC)
A — 2 4 6 4.00
B — 3 5 9 5.33
C A 4 5 7 5.17
D A 4 6 10 6.33
E B, C 4 5 7 5.17
F D 3 4 8 4.50
G E 3 5 8 5.17
Once this step is complete, one can draw a Gantt chart or a network diagram.
A Gantt chart created using Microsoft Project (MSP). Note (1) the critical path is in
red, (2) the slack is the black lines connected to non-critical activities, (3) since
Saturday and Sunday are not work days and are thus excluded from the schedule,
some bars on the Gantt chart are longer if they cut through a weekend.
A Gantt chart created using OmniPlan. Note (1) the critical path is highlighted, (2) the
slack is not specifically indicated on task 5 (d), though it can be observed on tasks 3
and 7 (b and f), (3) since weekends are indicated by a thin vertical line, and take up no
additional space on the work calendar, bars on the Gantt chart are not longer or
shorter when they do or don't carry over a weekend.
A network diagram can be created by hand or by using diagram software. There are two types
of network diagrams, activity on arrow (AOA) and activity on node (AON). Activity on node
diagrams are generally easier to create and interpret. To create an AON diagram, it is
recommended (but not required) to start with a node named start. This "activity" has a
duration of zero (0). Then you draw each activity that does not have a predecessor activity (a
and b in this example) and connect them with an arrow from start to each node. Next, since
both c and d list a as a predecessor activity, their nodes are drawn with arrows coming from
a. Activity e is listed with b and c as predecessor activities, so node e is drawn with arrows
coming from both b and c, signifying that e cannot begin until both b and c have been
completed. Activity f has d as a predecessor activity, so an arrow is drawn connecting the
activities. Likewise, an arrow is drawn from e to g. Since there are no activities that come
after f or g, it is recommended (but again not required) to connect them to a node labeled
finish.
A network diagram created using Microsoft Project (MSP). Note the critical path is in
red.
A node like this one (from Microsoft Visio) can be used to display the activity name,
duration, ES, EF, LS, LF, and slack.
By itself, the network diagram pictured above does not give much more information than a
Gantt chart; however, it can be expanded to display more information. The most common
information shown is:
1. The activity name
2. The normal duration time
3. The early start time (ES)
4. The early finish time (EF)
5. The late start time (LS)
6. The late finish time (LF)
7. The slack
In order to determine this information it is assumed that the activities and normal duration
times are given. The first step is to determine the ES and EF. The ES is defined as the
maximum EF of all predecessor activities, unless the activity in question is the first activity,
for which the ES is zero (0). The EF is the ES plus the task duration (EF = ES + duration).
 The ES for start is zero since it is the first activity. Since the duration is zero, the EF
is also zero. This EF is used as the ES for a and b.
 The ES for a is zero. The duration (4 work days) is added to the ES to get an EF of
four. This EF is used as the ES for c and d.
 The ES for b is zero. The duration (5.33 work days) is added to the ES to get an EF of
5.33.
 The ES for c is four. The duration (5.17 work days) is added to the ES to get an EF of
9.17.
 The ES for d is four. The duration (6.33 work days) is added to the ES to get an EF of
10.33. This EF is used as the ES for f.
 The ES for e is the greatest EF of its predecessor activities (b and c). Since b has an
EF of 5.33 and c has an EF of 9.17, the ES of e is 9.17. The duration (5.17 work days)
is added to the ES to get an EF of 14.34. This EF is used as the ES for g.
 The ES for f is 10.33. The duration (4.5 work days) is added to the ES to get an EF of
14.83.
 The ES for g is 14.34. The duration (5.17 work days) is added to the ES to get an EF
of 19.51.
 The ES for finish is the greatest EF of its predecessor activities (f and g). Since f has
an EF of 14.83 and g has an EF of 19.51, the ES of finish is 19.51. Finish is a
milestone (and therefore has a duration of zero), so the EF is also 19.51.
Barring any unforeseen events, the project should take 19.51 work days to complete. The
next step is to determine the late start (LS) and late finish (LF) of each activity. This will
eventually show if there are activities that have slack. The LF is defined as the minimum LS
of all successor activities, unless the activity is the last activity, for which the LF equals the
EF. The LS is the LF minus the task duration (LS = LF - duration).
 The LF for finish is equal to the EF (19.51 work days) since it is the last activity in the
project. Since the duration is zero, the LS is also 19.51 work days. This will be used
as the LF for f and g.
 The LF for g is 19.51 work days. The duration (5.17 work days) is subtracted from the
LF to get an LS of 14.34 work days. This will be used as the LF for e.
 The LF for f is 19.51 work days. The duration (4.5 work days) is subtracted from the
LF to get an LS of 15.01 work days. This will be used as the LF for d.
 The LF for e is 14.34 work days. The duration (5.17 work days) is subtracted from the
LF to get an LS of 9.17 work days. This will be used as the LF for b and c.
 The LF for d is 15.01 work days. The duration (6.33 work days) is subtracted from the
LF to get an LS of 8.68 work days.
 The LF for c is 9.17 work days. The duration (5.17 work days) is subtracted from the
LF to get an LS of 4 work days.
 The LF for b is 9.17 work days. The duration (5.33 work days) is subtracted from the
LF to get an LS of 3.84 work days.
 The LF for a is the minimum LS of its successor activities. Since c has an LS of 4
work days and d has an LS of 8.68 work days, the LF for a is 4 work days. The
duration (4 work days) is subtracted from the LF to get an LS of 0 work days.
 The LF for start is the minimum LS of its successor activities. Since a has an LS of 0
work days and b has an LS of 3.84 work days, the LS is 0 work days.
The next step is to determine the critical path and if any activities have slack. The critical
path is the path that takes the longest to complete. To determine the path times, add the task
durations for all available paths. Activities that have slack can be delayed without changing
the overall time of the project. Slack is computed in one of two ways, slack = LF - EF or
slack = LS - ES. Activities that are on the critical path have a slack of zero (0).
 The duration of path adf is 14.83 work days.
 The duration of path aceg is 19.51 work days.
 The duration of path beg is 15.67 work days.
The critical path is aceg and the critical time is 19.51 work days. It is important to note that
there can be more than one critical path (in a project more complex than this example) or that
the critical path can change. For example, let's say that activities d and f take their pessimistic
(b) times to complete instead of their expected (TE) times. The critical path is now adf and the
critical time is 22 work days. On the other hand, if activity c can be crashed to one work day,
the path time for aceg is reduced to 15.34 work days, which is slightly less than the time of
the new critical path, beg (15.67 work days).
Assuming these scenarios do not happen, the slack for each activity can now be determined.
 Start and finish are milestones and by definition have no duration, therefore they can
have no slack (0 work days).
 The activities on the critical path by definition have a slack of zero; however, it is
always a good idea to check the math anyway when drawing by hand.
o LFa - EFa = 4 - 4 = 0
o LFc - EFc = 9.17 - 9.17 = 0
o LFe - EFe = 14.34 - 14.34 = 0
o LFg - EFg = 19.51 - 19.51 = 0
 Activity b has an LF of 9.17 and an EF of 5.33, so the slack is 3.84 work days.
 Activity d has an LF of 15.01 and an EF of 10.33, so the slack is 4.68 work days.
 Activity f has an LF of 19.51 and an EF of 14.83, so the slack is 4.68 work days.
Therefore, activity b can be delayed almost 4 work days without delaying the project.
Likewise, activity d or activity f can be delayed 4.68 work days without delaying the project
(alternatively, d and f can be delayed 2.34 work days each).
A completed network diagram created using Microsoft Visio. Note the critical path is
in red.
Note: This is information publically available through Wikipedia on the Internet and is thus freely
provided as part of the additional information provided on Project Management courses by
Robertson Consulting Ltd. Contact Simon@robertsonconsulting.co.uk or Tel: +44 (0) 7967 300344

Contenu connexe

Tendances

Network Problem CPM & PERT
Network Problem CPM &  PERTNetwork Problem CPM &  PERT
Network Problem CPM & PERTPulchowk Campus
 
Program evaluation and review technique
Program evaluation and review techniqueProgram evaluation and review technique
Program evaluation and review techniqueGautam Chopra
 
Pert and its applications
Pert and its applicationsPert and its applications
Pert and its applicationsAmrit Mty
 
Programme evaluation & review technique (pert)
Programme evaluation & review technique (pert)Programme evaluation & review technique (pert)
Programme evaluation & review technique (pert)AnkitaKadam20
 
Applications of pert
Applications of pertApplications of pert
Applications of pertnitigga92
 
Critical path method (cpm)
Critical path method (cpm)Critical path method (cpm)
Critical path method (cpm)hoang tung
 
PERT and CPM
PERT and CPMPERT and CPM
PERT and CPMstudent
 
Network Techniques for Project Management
Network Techniques for Project ManagementNetwork Techniques for Project Management
Network Techniques for Project ManagementIshan Gandhi
 
Chapter 12(cpm pert)
Chapter 12(cpm pert)Chapter 12(cpm pert)
Chapter 12(cpm pert)Debanjan15
 

Tendances (20)

06 pert cpm
06 pert cpm06 pert cpm
06 pert cpm
 
Pert Diagram & Gantt chart
Pert Diagram & Gantt chartPert Diagram & Gantt chart
Pert Diagram & Gantt chart
 
Project Management Techniques
Project Management TechniquesProject Management Techniques
Project Management Techniques
 
Network Problem CPM & PERT
Network Problem CPM &  PERTNetwork Problem CPM &  PERT
Network Problem CPM & PERT
 
Pert
PertPert
Pert
 
Program evaluation and review technique
Program evaluation and review techniqueProgram evaluation and review technique
Program evaluation and review technique
 
Pert analysis
Pert analysisPert analysis
Pert analysis
 
Pert and its applications
Pert and its applicationsPert and its applications
Pert and its applications
 
Programme evaluation & review technique (pert)
Programme evaluation & review technique (pert)Programme evaluation & review technique (pert)
Programme evaluation & review technique (pert)
 
PERT
PERTPERT
PERT
 
06 pert cpm (1)
06 pert cpm (1)06 pert cpm (1)
06 pert cpm (1)
 
Critical Path Method
Critical Path MethodCritical Path Method
Critical Path Method
 
Seminar on pert
Seminar on pertSeminar on pert
Seminar on pert
 
Pert and CPM
Pert and CPMPert and CPM
Pert and CPM
 
Applications of pert
Applications of pertApplications of pert
Applications of pert
 
Critical path method (cpm)
Critical path method (cpm)Critical path method (cpm)
Critical path method (cpm)
 
PERT and CPM
PERT and CPMPERT and CPM
PERT and CPM
 
Network Techniques for Project Management
Network Techniques for Project ManagementNetwork Techniques for Project Management
Network Techniques for Project Management
 
Project management techniques
Project management techniquesProject management techniques
Project management techniques
 
Chapter 12(cpm pert)
Chapter 12(cpm pert)Chapter 12(cpm pert)
Chapter 12(cpm pert)
 

Similaire à Program Evaluation And Review Technique

Program Evaluation and Review Technique (PERT)
Program Evaluation and Review Technique (PERT)Program Evaluation and Review Technique (PERT)
Program Evaluation and Review Technique (PERT)Abhishek Pachisia
 
Critical path method(cpm)
Critical path method(cpm)Critical path method(cpm)
Critical path method(cpm)chandkec
 
(PROGRAM EVALUATION AND REVIE TECHNIQUE)
(PROGRAM EVALUATION AND REVIE TECHNIQUE)(PROGRAM EVALUATION AND REVIE TECHNIQUE)
(PROGRAM EVALUATION AND REVIE TECHNIQUE)hannahpepino1
 
PROJECT-SCHEDULING-pptx.pptx
PROJECT-SCHEDULING-pptx.pptxPROJECT-SCHEDULING-pptx.pptx
PROJECT-SCHEDULING-pptx.pptxTecnicoItca
 
ch08 (1).pptttttttttttttttþtttttttttttttt
ch08 (1).pptttttttttttttttþttttttttttttttch08 (1).pptttttttttttttttþtttttttttttttt
ch08 (1).pptttttttttttttttþttttttttttttttAbdisalamMohamud5
 
Operations and Supply Chain ManagementMGMT 3306Lecture 02I.docx
Operations and Supply Chain ManagementMGMT 3306Lecture 02I.docxOperations and Supply Chain ManagementMGMT 3306Lecture 02I.docx
Operations and Supply Chain ManagementMGMT 3306Lecture 02I.docxhopeaustin33688
 
Pert cpm SIDDANNA M BALAPGOL
Pert cpm SIDDANNA M BALAPGOLPert cpm SIDDANNA M BALAPGOL
Pert cpm SIDDANNA M BALAPGOLSiddanna Balapgol
 
TID Chapter 6 Introduction To Microsoft Project
TID Chapter 6 Introduction To Microsoft ProjectTID Chapter 6 Introduction To Microsoft Project
TID Chapter 6 Introduction To Microsoft ProjectWanBK Leo
 

Similaire à Program Evaluation And Review Technique (20)

Program Evaluation and Review Technique (PERT)
Program Evaluation and Review Technique (PERT)Program Evaluation and Review Technique (PERT)
Program Evaluation and Review Technique (PERT)
 
Ii. pert cpm
Ii. pert cpmIi. pert cpm
Ii. pert cpm
 
Critical path method(cpm)
Critical path method(cpm)Critical path method(cpm)
Critical path method(cpm)
 
(PROGRAM EVALUATION AND REVIE TECHNIQUE)
(PROGRAM EVALUATION AND REVIE TECHNIQUE)(PROGRAM EVALUATION AND REVIE TECHNIQUE)
(PROGRAM EVALUATION AND REVIE TECHNIQUE)
 
or-pert
or-pertor-pert
or-pert
 
PERT-Overview1.pdf
PERT-Overview1.pdfPERT-Overview1.pdf
PERT-Overview1.pdf
 
PROJECT-SCHEDULING-pptx.pptx
PROJECT-SCHEDULING-pptx.pptxPROJECT-SCHEDULING-pptx.pptx
PROJECT-SCHEDULING-pptx.pptx
 
ch08 (1).pptttttttttttttttþtttttttttttttt
ch08 (1).pptttttttttttttttþttttttttttttttch08 (1).pptttttttttttttttþtttttttttttttt
ch08 (1).pptttttttttttttttþtttttttttttttt
 
S pert cpm
S pert cpmS pert cpm
S pert cpm
 
Cpm pert asgm. prashant
Cpm pert asgm. prashantCpm pert asgm. prashant
Cpm pert asgm. prashant
 
Ch 5.pptx
Ch 5.pptxCh 5.pptx
Ch 5.pptx
 
Operations and Supply Chain ManagementMGMT 3306Lecture 02I.docx
Operations and Supply Chain ManagementMGMT 3306Lecture 02I.docxOperations and Supply Chain ManagementMGMT 3306Lecture 02I.docx
Operations and Supply Chain ManagementMGMT 3306Lecture 02I.docx
 
Pert cpm-22-3-21
Pert cpm-22-3-21Pert cpm-22-3-21
Pert cpm-22-3-21
 
Project management
Project managementProject management
Project management
 
PERT.pptx
PERT.pptxPERT.pptx
PERT.pptx
 
PERT CPM Intro
PERT CPM IntroPERT CPM Intro
PERT CPM Intro
 
02-Key Definitions .pdf
02-Key Definitions .pdf02-Key Definitions .pdf
02-Key Definitions .pdf
 
Pert cpm SIDDANNA M BALAPGOL
Pert cpm SIDDANNA M BALAPGOLPert cpm SIDDANNA M BALAPGOL
Pert cpm SIDDANNA M BALAPGOL
 
TID Chapter 6 Introduction To Microsoft Project
TID Chapter 6 Introduction To Microsoft ProjectTID Chapter 6 Introduction To Microsoft Project
TID Chapter 6 Introduction To Microsoft Project
 
CPM PERT.pptx
CPM PERT.pptxCPM PERT.pptx
CPM PERT.pptx
 

Program Evaluation And Review Technique

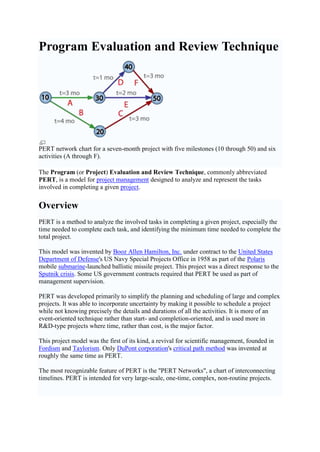
  • 1. Program Evaluation and Review Technique PERT network chart for a seven-month project with five milestones (10 through 50) and six activities (A through F). The Program (or Project) Evaluation and Review Technique, commonly abbreviated PERT, is a model for project management designed to analyze and represent the tasks involved in completing a given project. Overview PERT is a method to analyze the involved tasks in completing a given project, especially the time needed to complete each task, and identifying the minimum time needed to complete the total project. This model was invented by Booz Allen Hamilton, Inc. under contract to the United States Department of Defense's US Navy Special Projects Office in 1958 as part of the Polaris mobile submarine-launched ballistic missile project. This project was a direct response to the Sputnik crisis. Some US government contracts required that PERT be used as part of management supervision. PERT was developed primarily to simplify the planning and scheduling of large and complex projects. It was able to incorporate uncertainty by making it possible to schedule a project while not knowing precisely the details and durations of all the activities. It is more of an event-oriented technique rather than start- and completion-oriented, and is used more in R&D-type projects where time, rather than cost, is the major factor. This project model was the first of its kind, a revival for scientific management, founded in Fordism and Taylorism. Only DuPont corporation's critical path method was invented at roughly the same time as PERT. The most recognizable feature of PERT is the "PERT Networks", a chart of interconnecting timelines. PERT is intended for very large-scale, one-time, complex, non-routine projects.
  • 2. PERT terminology and conventions Conventions  A PERT chart is a tool that facilitates decision making; The first draft of a PERT chart will number its events sequentially in 10s (10, 20, 30, etc.) to allow the later insertion of additional events.  Two consecutive events in a PERT chart are linked by activities, which are conventionally represented as arrows in the diagram above.  The events are presented in a logical sequence and no activity can commence until its immediately preceding event is completed.  The planner decides which milestones should be PERT events and also decides their ―proper‖ sequence.  A PERT chart may have multiple pages with many sub-tasks. Pert is valuable to manage where multiple task are going simultaneously to reduce the redundancy Terminology  A PERT event: is a point that marks the start or completion of one or more tasks. It consumes no time, and uses no resources. It marks the completion of one or more tasks, and is not ―reached‖ until all of the activities leading to that event have been completed.  A predecessor event: an event (or events) that immediately precedes some other event without any other events intervening. It may be the consequence of more than one activity.  A successor event: an event (or events) that immediately follows some other event without any other events intervening. It may be the consequence of more than one activity.  A PERT activity: is the actual performance of a task. It consumes time, it requires resources (such as labour, materials, space, machinery), and it can be understood as representing the time, effort, and resources required to move from one event to another. A PERT activity cannot be completed until the event preceding it has occurred.  Optimistic time (BC): the minimum possible time required to accomplish a task, assuming everything proceeds better than is normally expected  Pessimistic time (WC): the maximum possible time required to accomplish a task, assuming everything goes wrong (but excluding major catastrophes).  Most likely time (ML): the best estimate of the time required to accomplish a task, assuming everything proceeds as normal.  Expected time (TE): the best estimate of the time required to accomplish a task, assuming everything proceeds as normal (the implication being that the expected time is the average time the task would require if the task were repeated on a number of occasions over an extended period of time). TE = (BC + 4ML + WC) ÷ 6
  • 3.  Critical Path: the longest possible continuous pathway taken from the initial event to the terminal event. It determines the total calendar time required for the project; and, therefore, any time delays along the critical path will delay the reaching of the terminal event by at least the same amount.  Critical Activity: An activity that has total float equal to zero. Activity with zero float does not mean it is on critical path.  Lead time (rhymes with "feed", not "fed"): the time by which a predecessor event must be completed in order to allow sufficient time for the activities that must elapse before a specific PERT event is reached to be completed.  Lag time: the earliest time by which a successor event can follow a specific PERT event.  Slack: the slack of an event is a measure of the excess time and resources available in achieving this event. Positive slack(+) would indicate ahead of schedule; negative slack would indicate behind schedule; and zero slack would indicate on schedule.  Fast tracking: performing more critical activities in parallel  Crashing critical path: Shortening duration of critical activities  Float or Slack is the amount of time that a task in a project network can be delayed without causing a delay - Subsequent tasks – (free float) or Project Completion – (total float) Implementing PERT The first step to scheduling the project is to determine the tasks that the project requires and the order in which they must be completed. The order may be easy to record for some tasks (e.g. When building a house, the land must be graded before the foundation can be laid) while difficult for others (There are two areas that need to be graded, but there are only enough bulldozers to do one). Additionally, the time estimates usually reflect the normal, non-rushed time. Many times, the time required to execute the task can be reduced for an additional cost or a reduction in the quality. In the following example there are seven tasks, labeled A through G. Some tasks can be done concurrently (A and B) while others cannot be done until their predecessor task is complete (C cannot begin until A is complete). Additionally, each task has three time estimates: the optimistic time estimate (BC), the most likely or normal time estimate (ML), and the pessimistic time estimate (WC). The expected time (TE) is computed using the formula (BC + 4ML + WC)/6. Activity Predecessor Time estimates Expected time Opt. (BC) Normal (ML) Pess. (WC) A — 2 4 6 4.00 B — 3 5 9 5.33
  • 4. C A 4 5 7 5.17 D A 4 6 10 6.33 E B, C 4 5 7 5.17 F D 3 4 8 4.50 G E 3 5 8 5.17 Once this step is complete, one can draw a Gantt chart or a network diagram. A Gantt chart created using Microsoft Project (MSP). Note (1) the critical path is in red, (2) the slack is the black lines connected to non-critical activities, (3) since Saturday and Sunday are not work days and are thus excluded from the schedule, some bars on the Gantt chart are longer if they cut through a weekend. A Gantt chart created using OmniPlan. Note (1) the critical path is highlighted, (2) the slack is not specifically indicated on task 5 (d), though it can be observed on tasks 3 and 7 (b and f), (3) since weekends are indicated by a thin vertical line, and take up no additional space on the work calendar, bars on the Gantt chart are not longer or shorter when they do or don't carry over a weekend.
  • 5. A network diagram can be created by hand or by using diagram software. There are two types of network diagrams, activity on arrow (AOA) and activity on node (AON). Activity on node diagrams are generally easier to create and interpret. To create an AON diagram, it is recommended (but not required) to start with a node named start. This "activity" has a duration of zero (0). Then you draw each activity that does not have a predecessor activity (a and b in this example) and connect them with an arrow from start to each node. Next, since both c and d list a as a predecessor activity, their nodes are drawn with arrows coming from a. Activity e is listed with b and c as predecessor activities, so node e is drawn with arrows coming from both b and c, signifying that e cannot begin until both b and c have been completed. Activity f has d as a predecessor activity, so an arrow is drawn connecting the activities. Likewise, an arrow is drawn from e to g. Since there are no activities that come after f or g, it is recommended (but again not required) to connect them to a node labeled finish. A network diagram created using Microsoft Project (MSP). Note the critical path is in red. A node like this one (from Microsoft Visio) can be used to display the activity name, duration, ES, EF, LS, LF, and slack. By itself, the network diagram pictured above does not give much more information than a Gantt chart; however, it can be expanded to display more information. The most common information shown is: 1. The activity name 2. The normal duration time 3. The early start time (ES) 4. The early finish time (EF) 5. The late start time (LS) 6. The late finish time (LF) 7. The slack In order to determine this information it is assumed that the activities and normal duration times are given. The first step is to determine the ES and EF. The ES is defined as the maximum EF of all predecessor activities, unless the activity in question is the first activity, for which the ES is zero (0). The EF is the ES plus the task duration (EF = ES + duration).
  • 6.  The ES for start is zero since it is the first activity. Since the duration is zero, the EF is also zero. This EF is used as the ES for a and b.  The ES for a is zero. The duration (4 work days) is added to the ES to get an EF of four. This EF is used as the ES for c and d.  The ES for b is zero. The duration (5.33 work days) is added to the ES to get an EF of 5.33.  The ES for c is four. The duration (5.17 work days) is added to the ES to get an EF of 9.17.  The ES for d is four. The duration (6.33 work days) is added to the ES to get an EF of 10.33. This EF is used as the ES for f.  The ES for e is the greatest EF of its predecessor activities (b and c). Since b has an EF of 5.33 and c has an EF of 9.17, the ES of e is 9.17. The duration (5.17 work days) is added to the ES to get an EF of 14.34. This EF is used as the ES for g.  The ES for f is 10.33. The duration (4.5 work days) is added to the ES to get an EF of 14.83.  The ES for g is 14.34. The duration (5.17 work days) is added to the ES to get an EF of 19.51.  The ES for finish is the greatest EF of its predecessor activities (f and g). Since f has an EF of 14.83 and g has an EF of 19.51, the ES of finish is 19.51. Finish is a milestone (and therefore has a duration of zero), so the EF is also 19.51. Barring any unforeseen events, the project should take 19.51 work days to complete. The next step is to determine the late start (LS) and late finish (LF) of each activity. This will eventually show if there are activities that have slack. The LF is defined as the minimum LS of all successor activities, unless the activity is the last activity, for which the LF equals the EF. The LS is the LF minus the task duration (LS = LF - duration).  The LF for finish is equal to the EF (19.51 work days) since it is the last activity in the project. Since the duration is zero, the LS is also 19.51 work days. This will be used as the LF for f and g.  The LF for g is 19.51 work days. The duration (5.17 work days) is subtracted from the LF to get an LS of 14.34 work days. This will be used as the LF for e.  The LF for f is 19.51 work days. The duration (4.5 work days) is subtracted from the LF to get an LS of 15.01 work days. This will be used as the LF for d.  The LF for e is 14.34 work days. The duration (5.17 work days) is subtracted from the LF to get an LS of 9.17 work days. This will be used as the LF for b and c.  The LF for d is 15.01 work days. The duration (6.33 work days) is subtracted from the LF to get an LS of 8.68 work days.  The LF for c is 9.17 work days. The duration (5.17 work days) is subtracted from the LF to get an LS of 4 work days.  The LF for b is 9.17 work days. The duration (5.33 work days) is subtracted from the LF to get an LS of 3.84 work days.  The LF for a is the minimum LS of its successor activities. Since c has an LS of 4 work days and d has an LS of 8.68 work days, the LF for a is 4 work days. The duration (4 work days) is subtracted from the LF to get an LS of 0 work days.  The LF for start is the minimum LS of its successor activities. Since a has an LS of 0 work days and b has an LS of 3.84 work days, the LS is 0 work days. The next step is to determine the critical path and if any activities have slack. The critical path is the path that takes the longest to complete. To determine the path times, add the task
  • 7. durations for all available paths. Activities that have slack can be delayed without changing the overall time of the project. Slack is computed in one of two ways, slack = LF - EF or slack = LS - ES. Activities that are on the critical path have a slack of zero (0).  The duration of path adf is 14.83 work days.  The duration of path aceg is 19.51 work days.  The duration of path beg is 15.67 work days. The critical path is aceg and the critical time is 19.51 work days. It is important to note that there can be more than one critical path (in a project more complex than this example) or that the critical path can change. For example, let's say that activities d and f take their pessimistic (b) times to complete instead of their expected (TE) times. The critical path is now adf and the critical time is 22 work days. On the other hand, if activity c can be crashed to one work day, the path time for aceg is reduced to 15.34 work days, which is slightly less than the time of the new critical path, beg (15.67 work days). Assuming these scenarios do not happen, the slack for each activity can now be determined.  Start and finish are milestones and by definition have no duration, therefore they can have no slack (0 work days).  The activities on the critical path by definition have a slack of zero; however, it is always a good idea to check the math anyway when drawing by hand. o LFa - EFa = 4 - 4 = 0 o LFc - EFc = 9.17 - 9.17 = 0 o LFe - EFe = 14.34 - 14.34 = 0 o LFg - EFg = 19.51 - 19.51 = 0  Activity b has an LF of 9.17 and an EF of 5.33, so the slack is 3.84 work days.  Activity d has an LF of 15.01 and an EF of 10.33, so the slack is 4.68 work days.  Activity f has an LF of 19.51 and an EF of 14.83, so the slack is 4.68 work days. Therefore, activity b can be delayed almost 4 work days without delaying the project. Likewise, activity d or activity f can be delayed 4.68 work days without delaying the project (alternatively, d and f can be delayed 2.34 work days each).
  • 8. A completed network diagram created using Microsoft Visio. Note the critical path is in red. Note: This is information publically available through Wikipedia on the Internet and is thus freely provided as part of the additional information provided on Project Management courses by Robertson Consulting Ltd. Contact Simon@robertsonconsulting.co.uk or Tel: +44 (0) 7967 300344