Marketing KPI Dashboard Showing Lead Funnel Traffic Sources Key Metrics
•
1 j'aime•142 vues

"You can download this product from SlideTeam.net" Presenting this set of slides with name - Marketing Kpi Dashboard Showing Lead Funnel Traffic Sources Key Metrics. This is a three stage process. The stages in this process are Marketing, Branding, Promoting. https://bit.ly/3ntEkwX
Signaler
Partager
Signaler
Partager
Télécharger pour lire hors ligne

Recommandé
Recommandé
Contenu connexe
Tendances
Tendances (20)
Digital Business Transformation Ppt Summary Structure
Digital Business Transformation Ppt Summary Structure
Steps Approach Showing Person At The First Level Going Upstairs
Steps Approach Showing Person At The First Level Going Upstairs
Project Dashboard With KPI Status Risks Project Area Issues
Project Dashboard With KPI Status Risks Project Area Issues
Hr Dashboard Number Of Employees Employee Structure
Hr Dashboard Number Of Employees Employee Structure
Project Progress Showing Project Name Project Status Complete Percentage
Project Progress Showing Project Name Project Status Complete Percentage
Digital Business Transformation Powerpoint Templates
Digital Business Transformation Powerpoint Templates
Project Management Metrics Dashboard Including Budget
Project Management Metrics Dashboard Including Budget
Project Status KPI Dashboard Showing Project Timeline And Budget
Project Status KPI Dashboard Showing Project Timeline And Budget
Product Development Roadmap Timeline Dev Milestones Product Releases 4 Quarters
Product Development Roadmap Timeline Dev Milestones Product Releases 4 Quarters
Business Process Management Tools Process Management Tools Process Performanc...
Business Process Management Tools Process Management Tools Process Performanc...
3 Year Transformation Map Product Roadmap Phases Timeline
3 Year Transformation Map Product Roadmap Phases Timeline
Business Objectives Optimize Operations And Infrastructure With Icons
Business Objectives Optimize Operations And Infrastructure With Icons
Similaire à Marketing KPI Dashboard Showing Lead Funnel Traffic Sources Key Metrics
Similaire à Marketing KPI Dashboard Showing Lead Funnel Traffic Sources Key Metrics (20)
business_kpi_dashboard_showing_revenue_and_customer_lifetime_value_wd.pptx
business_kpi_dashboard_showing_revenue_and_customer_lifetime_value_wd.pptx
Financial Performance KPI Dashboard Showing Gross Profit Margin Sales Growth ...
Financial Performance KPI Dashboard Showing Gross Profit Margin Sales Growth ...
Financial Ratio KPI Dashboard Showing Revenue Net Profit Margin And Debt To E...
Financial Ratio KPI Dashboard Showing Revenue Net Profit Margin And Debt To E...
Financial Performance KPI Dashboard Showing Payroll Headcount Ratio Cost Per ...
Financial Performance KPI Dashboard Showing Payroll Headcount Ratio Cost Per ...
Social Media KPI Dashboard Showing Facebook Impression By Demographic Instagr...
Social Media KPI Dashboard Showing Facebook Impression By Demographic Instagr...
Manufacturing KPI Dashboard Showing Production Rate And Lost Units
Manufacturing KPI Dashboard Showing Production Rate And Lost Units
Compliance And Legal KPI Dashboard Showing Compliance Issues And Resolution Time
Compliance And Legal KPI Dashboard Showing Compliance Issues And Resolution Time
Project Status Kpi Dashboard Showing Delivery Roadmap And Resource Allocation
Project Status Kpi Dashboard Showing Delivery Roadmap And Resource Allocation
Information Technology KPI Dashboard Showing Incident Target Summary Trend
Information Technology KPI Dashboard Showing Incident Target Summary Trend
Quality Dashboard With Quality Index By Measures And Quality Index
Quality Dashboard With Quality Index By Measures And Quality Index
Audit KPI Dashboard Showing Audit Status Auditable Entry Risk Rating
Audit KPI Dashboard Showing Audit Status Auditable Entry Risk Rating
Executive Summary Ppt Infographics Example Introduction
Executive Summary Ppt Infographics Example Introduction
Project Name Status Schedule And Management Dashboard
Project Name Status Schedule And Management Dashboard
Supply Chain Management KPI Dashboard Showing Cost Reduction And Procurement Roi
Supply Chain Management KPI Dashboard Showing Cost Reduction And Procurement Roi
Call Center KPI Dashboard Showing Abandon Percentage Total Queue Entries
Call Center KPI Dashboard Showing Abandon Percentage Total Queue Entries
Recruitment Funnel And Application Source Dashboard
Recruitment Funnel And Application Source Dashboard
Plus de SlideTeam
Plus de SlideTeam (20)
Customer Support And Services Guide Powerpoint Presentation Slides
Customer Support And Services Guide Powerpoint Presentation Slides
Word Of Mouth WOM Marketing Strategies To Build Brand Awareness Powerpoint Pr...
Word Of Mouth WOM Marketing Strategies To Build Brand Awareness Powerpoint Pr...
Strategic Staff Engagement Action Plan Powerpoint Presentation Slides
Strategic Staff Engagement Action Plan Powerpoint Presentation Slides
Traditional Marketing Channel Analysis Powerpoint Presentation Slides Mkt Cd
Traditional Marketing Channel Analysis Powerpoint Presentation Slides Mkt Cd
Integrating Asset Tracking System To Enhance Operational Effectiveness Comple...
Integrating Asset Tracking System To Enhance Operational Effectiveness Comple...
Designing And Implementing Brand Leadership Strategy Powerpoint Presentation ...
Designing And Implementing Brand Leadership Strategy Powerpoint Presentation ...
How Amazon Generates Revenues Across Globe Powerpoint Presentation Slides Str...
How Amazon Generates Revenues Across Globe Powerpoint Presentation Slides Str...
Guide For Effective Event Marketing Powerpoint Presentation Slides Mkt Cd
Guide For Effective Event Marketing Powerpoint Presentation Slides Mkt Cd
Managing Business Customers Technology Powerpoint Presentation Slides
Managing Business Customers Technology Powerpoint Presentation Slides
Unearthing Apples Billion Dollar Branding Secret Powerpoint Presentation Slid...
Unearthing Apples Billion Dollar Branding Secret Powerpoint Presentation Slid...
Developing Flexible Working Practices To Improve Employee Engagement Powerpoi...
Developing Flexible Working Practices To Improve Employee Engagement Powerpoi...
Product Corporate And Umbrella Branding Powerpoint Presentation Slides Brandi...
Product Corporate And Umbrella Branding Powerpoint Presentation Slides Brandi...
Communication Channels And Strategies For Shareholder Engagement Powerpoint P...
Communication Channels And Strategies For Shareholder Engagement Powerpoint P...
Responsible Tech Playbook To Leverage Business Ethics Powerpoint Presentation...
Responsible Tech Playbook To Leverage Business Ethics Powerpoint Presentation...
Generating Leads Through Targeted Digital Marketing Campaign Powerpoint Prese...
Generating Leads Through Targeted Digital Marketing Campaign Powerpoint Prese...
Boosting Profits With New And Effective Sales Strategic Plan Powerpoint Prese...
Boosting Profits With New And Effective Sales Strategic Plan Powerpoint Prese...
Methods To Implement Traditional Marketing Powerpoint Presentation Slides Mkt Cd
Methods To Implement Traditional Marketing Powerpoint Presentation Slides Mkt Cd
Comprehensive Guide To Sports Marketing Strategy Powerpoint Presentation Slid...
Comprehensive Guide To Sports Marketing Strategy Powerpoint Presentation Slid...
Global Shift Towards Flexible Working Powerpoint Presentation Slides
Global Shift Towards Flexible Working Powerpoint Presentation Slides
Dernier
Model Call Girl Services in Delhi reach out to us at 🔝 9953056974 🔝✔️✔️
Our agency presents a selection of young, charming call girls available for bookings at Oyo Hotels. Experience high-class escort services at pocket-friendly rates, with our female escorts exuding both beauty and a delightful personality, ready to meet your desires. Whether it's Housewives, College girls, Russian girls, Muslim girls, or any other preference, we offer a diverse range of options to cater to your tastes.
We provide both in-call and out-call services for your convenience. Our in-call location in Delhi ensures cleanliness, hygiene, and 100% safety, while our out-call services offer doorstep delivery for added ease.
We value your time and money, hence we kindly request pic collectors, time-passers, and bargain hunters to refrain from contacting us.
Our services feature various packages at competitive rates:
One shot: ₹2000/in-call, ₹5000/out-call
Two shots with one girl: ₹3500/in-call, ₹6000/out-call
Body to body massage with sex: ₹3000/in-call
Full night for one person: ₹7000/in-call, ₹10000/out-call
Full night for more than 1 person: Contact us at 🔝 9953056974 🔝. for details
Operating 24/7, we serve various locations in Delhi, including Green Park, Lajpat Nagar, Saket, and Hauz Khas near metro stations.
For premium call girl services in Delhi 🔝 9953056974 🔝. Thank you for considering us!call girls in Dakshinpuri (DELHI) 🔝 >༒9953056974 🔝 genuine Escort Service 🔝✔️✔️
call girls in Dakshinpuri (DELHI) 🔝 >༒9953056974 🔝 genuine Escort Service 🔝✔️✔️9953056974 Low Rate Call Girls In Saket, Delhi NCR
Top Rated Pune Call Girls Koregaon Park ⟟ 6297143586 ⟟ Call Me For Genuine Sex Service At Affordable Rate
Booking Contact Details
WhatsApp Chat: +91-6297143586
pune Escort Service includes providing maximum physical satisfaction to their clients as well as engaging conversation that keeps your time enjoyable and entertaining. Plus they look fabulously elegant; making an impressionable.
Independent Escorts pune understands the value of confidentiality and discretion - they will go the extra mile to meet your needs. Simply contact them via text messaging or through their online profiles; they'd be more than delighted to accommodate any request or arrange a romantic date or fun-filled night together.
We provide -
01-may-2024(v.n)
Top Rated Pune Call Girls Koregaon Park ⟟ 6297143586 ⟟ Call Me For Genuine S...
Top Rated Pune Call Girls Koregaon Park ⟟ 6297143586 ⟟ Call Me For Genuine S...Call Girls in Nagpur High Profile
Dernier (20)
Whitefield Call Girls Service: 🍓 7737669865 🍓 High Profile Model Escorts | Ba...
Whitefield Call Girls Service: 🍓 7737669865 🍓 High Profile Model Escorts | Ba...
Abortion pill for sale in Muscat (+918761049707)) Get Cytotec Cash on deliver...
Abortion pill for sale in Muscat (+918761049707)) Get Cytotec Cash on deliver...
Pooja 9892124323, Call girls Services and Mumbai Escort Service Near Hotel Hy...
Pooja 9892124323, Call girls Services and Mumbai Escort Service Near Hotel Hy...
AMBER GRAIN EMBROIDERY | Growing folklore elements | Root-based materials, w...
AMBER GRAIN EMBROIDERY | Growing folklore elements | Root-based materials, w...
👉 Call Girls Service Amritsar 👉📞 6367187148 👉📞 Just📲 Call Ruhi Call Girl Agen...
👉 Call Girls Service Amritsar 👉📞 6367187148 👉📞 Just📲 Call Ruhi Call Girl Agen...
call girls in Vaishali (Ghaziabad) 🔝 >༒8448380779 🔝 genuine Escort Service 🔝✔️✔️
call girls in Vaishali (Ghaziabad) 🔝 >༒8448380779 🔝 genuine Escort Service 🔝✔️✔️
➥🔝 7737669865 🔝▻ jhansi Call-girls in Women Seeking Men 🔝jhansi🔝 Escorts S...
➥🔝 7737669865 🔝▻ jhansi Call-girls in Women Seeking Men 🔝jhansi🔝 Escorts S...
call girls in Kaushambi (Ghaziabad) 🔝 >༒8448380779 🔝 genuine Escort Service 🔝...
call girls in Kaushambi (Ghaziabad) 🔝 >༒8448380779 🔝 genuine Escort Service 🔝...
Call Girls Basavanagudi Just Call 👗 7737669865 👗 Top Class Call Girl Service ...
Call Girls Basavanagudi Just Call 👗 7737669865 👗 Top Class Call Girl Service ...
call girls in Dakshinpuri (DELHI) 🔝 >༒9953056974 🔝 genuine Escort Service 🔝✔️✔️
call girls in Dakshinpuri (DELHI) 🔝 >༒9953056974 🔝 genuine Escort Service 🔝✔️✔️
Top Rated Pune Call Girls Koregaon Park ⟟ 6297143586 ⟟ Call Me For Genuine S...
Top Rated Pune Call Girls Koregaon Park ⟟ 6297143586 ⟟ Call Me For Genuine S...
Hingoli ❤CALL GIRL 8617370543 ❤CALL GIRLS IN Hingoli ESCORT SERVICE❤CALL GIRL
Hingoli ❤CALL GIRL 8617370543 ❤CALL GIRLS IN Hingoli ESCORT SERVICE❤CALL GIRL
UI:UX Design and Empowerment Strategies for Underprivileged Transgender Indiv...
UI:UX Design and Empowerment Strategies for Underprivileged Transgender Indiv...
Sector 105, Noida Call girls :8448380779 Model Escorts | 100% verified
Sector 105, Noida Call girls :8448380779 Model Escorts | 100% verified
FULL ENJOY Call Girls In Mahipalpur Delhi Contact Us 8377877756
FULL ENJOY Call Girls In Mahipalpur Delhi Contact Us 8377877756
Escorts Service Basapura ☎ 7737669865☎ Book Your One night Stand (Bangalore)
Escorts Service Basapura ☎ 7737669865☎ Book Your One night Stand (Bangalore)
Marketing KPI Dashboard Showing Lead Funnel Traffic Sources Key Metrics
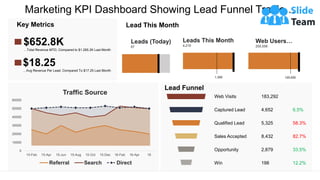
- 1. Marketing KPI Dashboard Showing Lead Funnel Traffic… This graph/chart is linked to excel, and changes automatically based on data. Just left click on it and select “Edit Data”. Key Metrics $652.8K …Total Revenue MTD, Compared to $1.265.2K Last Month $18.25 …Avg Revenue Per Lead, Compared To $17.25 Last Month Lead This Month 120,000 Web Users… 255,558 Leads (Today) 67 1,300 Leads This Month 4,210 Lead Funnel Web Visits Captured Lead Win Qualified Lead Sales Accepted Opportunity 183,292 4,652 198 5,325 8,432 2,879 6.5% 12.2% 58.3% 82.7% 33.5% 0 10000 20000 30000 40000 50000 60000 15-Feb 15-Apr 15-Jun 15-Aug 15-Oct 15-Dec 16-Feb 16-Apr 18 Traffic Source Referral Search Direct
- 2. Instructions To Edit This Slide This slide has been made in PowerPoint using basic PowerPoint shapes, and all graphics are 100% editable in PowerPoint. You can change color, size and orientation of any element to your liking, and add/edit any piece of text anywhere.
- 3. All images are 100% editable in PowerPoint Change color, size and orientation of any icon to your liking”
- 4. 1. Select the Graph and right click -> Select "Edit Data" 2. An excel matrix will automatically show up 3. Enter the values based on your requirements and hit enter 4. The Graph/Chart shape will automatically adjust according to your data, and anytime you can go and change the value again Edit Excel-linked Chart This is a Data Driven Chart/Graph and the shape automatically adjusts according to your data 1 2 3
- 5. Edit Color 1. Select the shape to change the color and Right click the object( click any object which you want to change color) 2. Choose Format Data Series in the dialog box. 3. Choose “Fill” in the Format Shape box then “Solid” or “Gradient” depending on the appearance of the object. Change colour as shown in the picture. 1 2 3
- 6. Select From Thousands Of Editable Icons On Every Topic These icons are available at the Icons section on www.slideteam.net