SlideShare une entreprise Scribd logo
1  sur  19
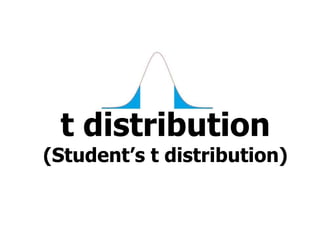
t distribution
(Student’s t distribution)
In the previous discussions, it
was shown that when the
population is normally distributed,
or when the sample size is large
enough, the sampling distribution of
the mean is normally distributed.
And of course, the bell curve is very
handy to use.
However, in many cases
where we can only obtain small
sizes, the normal distribution
does not hold true. Instead, we
use the t distribution which is
the distribution of t-scores.
t = t score
x = sample mean
𝝁 = population mean
𝑺 = sample standard deviation
𝒏 = sample size
EXAMPLE 1
Find the t-score for a sample
size of 16 taken from a population
with mean 10 when the sample
mean is 12 and the sample
standard deviation is 1.5.
Degrees of freedom
- the number of observations in
a data set that are free to change
without changing the mean.
For a single group test
𝑑𝑓 = 𝑁 − 1
For 2-group tests
𝑑𝑓 = 𝑁1 + 𝑁2 − 2
PROPERTIES of a t distribution
1. The distribution has mean 0.
2. The distribution is symmetric
about the mean.
3. The variance is equal to
𝑑𝑓
𝑑𝑓−2
.
4. The variance is always greater
than 1, but approaches 1 when
df gets bigger.
What if n approaches infinity?
The t distribution also
approaches the standard normal
distribution.
Increasing the sample size will….
Increasing the degrees of freedom will…
Increasing the degrees of freedom and
sample size will make the t distribution
approach a normal distribution.
The critical value is the thin line
between rejection and acceptance.
The confidence
interval is actually
the acceptance
region.
The t TABLE
1. The critical region appears at
the top.
2. The degrees of freedom are on
the leftmost section.
3. Confidence interval are at the
bottom.
EXAMPLE 2
Find the t-score below which
we can expect 99% of sample
means will fall if samples of size 16
are taken from a normally
distributed population.
EXAMPLE 2
SOLUTION
1 − 𝛼 = 0.99
𝛼 = 0.01
𝑑𝑓 = 𝑛 − 1
𝑡0.99 = −𝑡0.01
𝑑𝑓 = 15
𝑡0.99 = −𝑡0.01 = −2.602
EXAMPLE 3
If a random sample of size 25
drawn from a normal population
gives a mean of 60 and a standard
deviation of 4, find the range of t-
scores where we can expect to find
the middle 95% of all sample
means.
EXAMPLE 4
Compute the probability that
𝑃 (−𝑡0.05 < 𝑡 < 𝑡0.10).

Contenu connexe

Tendances

Central limit theorem
Central limit theoremCentral limit theorem
Central limit theoremVijeesh Soman
 
STATISTICS: Hypothesis Testing
STATISTICS: Hypothesis TestingSTATISTICS: Hypothesis Testing
STATISTICS: Hypothesis Testingjundumaug1
 
Sampling distribution
Sampling distributionSampling distribution
Sampling distributionswarna dey
 
Discrete and continuous probability distributions ppt @ bec doms
Discrete and continuous probability distributions ppt @ bec domsDiscrete and continuous probability distributions ppt @ bec doms
Discrete and continuous probability distributions ppt @ bec domsBabasab Patil
 
Estimating population mean
Estimating population meanEstimating population mean
Estimating population meanRonaldo Cabardo
 
Central limit theorem
Central limit theoremCentral limit theorem
Central limit theoremNadeem Uddin
 
Chapter 4 part3- Means and Variances of Random Variables
Chapter 4 part3- Means and Variances of Random VariablesChapter 4 part3- Means and Variances of Random Variables
Chapter 4 part3- Means and Variances of Random Variablesnszakir
 
Hypothesis testing: A single sample test
Hypothesis testing: A single sample testHypothesis testing: A single sample test
Hypothesis testing: A single sample testUmme Salma Tuli
 
Normal Distribution
Normal DistributionNormal Distribution
Normal DistributionCIToolkit
 
quartiles,deciles,percentiles.ppt
quartiles,deciles,percentiles.pptquartiles,deciles,percentiles.ppt
quartiles,deciles,percentiles.pptSyedSaifUrRehman3
 
Normal and standard normal distribution
Normal and standard normal distributionNormal and standard normal distribution
Normal and standard normal distributionAvjinder (Avi) Kaler
 

Tendances (20)

VARIANCE
VARIANCEVARIANCE
VARIANCE
 
Test for proportion
Test for proportionTest for proportion
Test for proportion
 
Z test
Z testZ test
Z test
 
Central limit theorem
Central limit theoremCentral limit theorem
Central limit theorem
 
STATISTICS: Hypothesis Testing
STATISTICS: Hypothesis TestingSTATISTICS: Hypothesis Testing
STATISTICS: Hypothesis Testing
 
Hypothesis Testing
Hypothesis TestingHypothesis Testing
Hypothesis Testing
 
T test statistics
T test statisticsT test statistics
T test statistics
 
Sampling distribution
Sampling distributionSampling distribution
Sampling distribution
 
Discrete and continuous probability distributions ppt @ bec doms
Discrete and continuous probability distributions ppt @ bec domsDiscrete and continuous probability distributions ppt @ bec doms
Discrete and continuous probability distributions ppt @ bec doms
 
Estimating population mean
Estimating population meanEstimating population mean
Estimating population mean
 
6. point and interval estimation
6. point and interval estimation6. point and interval estimation
6. point and interval estimation
 
Measures of variability
Measures of variabilityMeasures of variability
Measures of variability
 
Central limit theorem
Central limit theoremCentral limit theorem
Central limit theorem
 
Normal distribution
Normal distributionNormal distribution
Normal distribution
 
Chapter 4 part3- Means and Variances of Random Variables
Chapter 4 part3- Means and Variances of Random VariablesChapter 4 part3- Means and Variances of Random Variables
Chapter 4 part3- Means and Variances of Random Variables
 
Hypothesis testing: A single sample test
Hypothesis testing: A single sample testHypothesis testing: A single sample test
Hypothesis testing: A single sample test
 
Normal Distribution
Normal DistributionNormal Distribution
Normal Distribution
 
Measures of Variability
Measures of VariabilityMeasures of Variability
Measures of Variability
 
quartiles,deciles,percentiles.ppt
quartiles,deciles,percentiles.pptquartiles,deciles,percentiles.ppt
quartiles,deciles,percentiles.ppt
 
Normal and standard normal distribution
Normal and standard normal distributionNormal and standard normal distribution
Normal and standard normal distribution
 

En vedette

Sampling and sampling distributions
Sampling and sampling distributionsSampling and sampling distributions
Sampling and sampling distributionsStephan Jade Navarro
 
CABT SHS Statistics & Probability - The z-scores and Problems involving Norma...
CABT SHS Statistics & Probability - The z-scores and Problems involving Norma...CABT SHS Statistics & Probability - The z-scores and Problems involving Norma...
CABT SHS Statistics & Probability - The z-scores and Problems involving Norma...Gilbert Joseph Abueg
 
STATISTICS AND PROBABILITY (TEACHING GUIDE)
STATISTICS AND PROBABILITY (TEACHING GUIDE)STATISTICS AND PROBABILITY (TEACHING GUIDE)
STATISTICS AND PROBABILITY (TEACHING GUIDE)PRINTDESK by Dan
 
Global prevalence of autism and other pervasive developmental disorders
Global prevalence of autism and other pervasive developmental disordersGlobal prevalence of autism and other pervasive developmental disorders
Global prevalence of autism and other pervasive developmental disordersCristian Sepulveda Zuñiga
 
Word 2 tha mutha.pt.279
Word 2 tha mutha.pt.279Word 2 tha mutha.pt.279
Word 2 tha mutha.pt.279M-Rod
 
Guidocondoripañuni+#inf
Guidocondoripañuni+#infGuidocondoripañuni+#inf
Guidocondoripañuni+#infguido condori
 
USO DO GEOGEBRA 3D PARA O ENSINO DE POLIEDROS
USO DO GEOGEBRA 3D PARA O ENSINO DE POLIEDROSUSO DO GEOGEBRA 3D PARA O ENSINO DE POLIEDROS
USO DO GEOGEBRA 3D PARA O ENSINO DE POLIEDROSWendel Silva
 
Livro - código limpo caps (3,4) (clean code)
Livro - código limpo caps (3,4) (clean code)Livro - código limpo caps (3,4) (clean code)
Livro - código limpo caps (3,4) (clean code)André Justi
 
ARQUITECTURA BÁSICA DE UNA COMPUTADORA
  ARQUITECTURA BÁSICA DE UNA COMPUTADORA  ARQUITECTURA BÁSICA DE UNA COMPUTADORA
ARQUITECTURA BÁSICA DE UNA COMPUTADORArukapreca
 
биотски фактори
биотски факторибиотски фактори
биотски факториFilip Stojkov
 
Four dimensions of multimedia
Four dimensions of multimediaFour dimensions of multimedia
Four dimensions of multimediaChris Clark
 
Chapter 7 – Confidence Intervals And Sample Size
Chapter 7 – Confidence Intervals And Sample SizeChapter 7 – Confidence Intervals And Sample Size
Chapter 7 – Confidence Intervals And Sample SizeRose Jenkins
 
Confidence Intervals And The T Distribution
Confidence Intervals And The T   DistributionConfidence Intervals And The T   Distribution
Confidence Intervals And The T DistributionDarren Barton
 
probability and statistics Chapter 1 (1)
probability and statistics Chapter 1 (1)probability and statistics Chapter 1 (1)
probability and statistics Chapter 1 (1)abfisho
 
multimedia chapter1
multimedia chapter1multimedia chapter1
multimedia chapter1nes
 
CABT SHS Statistics & Probability - Estimation of Parameters (intro)
CABT SHS Statistics & Probability -  Estimation of Parameters (intro)CABT SHS Statistics & Probability -  Estimation of Parameters (intro)
CABT SHS Statistics & Probability - Estimation of Parameters (intro)Gilbert Joseph Abueg
 
Probability and statistics(assign 7 and 8)
Probability and statistics(assign 7 and 8)Probability and statistics(assign 7 and 8)
Probability and statistics(assign 7 and 8)Fatima Bianca Gueco
 

En vedette (20)

Sampling and sampling distributions
Sampling and sampling distributionsSampling and sampling distributions
Sampling and sampling distributions
 
Test for mean
Test for meanTest for mean
Test for mean
 
CABT SHS Statistics & Probability - The z-scores and Problems involving Norma...
CABT SHS Statistics & Probability - The z-scores and Problems involving Norma...CABT SHS Statistics & Probability - The z-scores and Problems involving Norma...
CABT SHS Statistics & Probability - The z-scores and Problems involving Norma...
 
STATISTICS AND PROBABILITY (TEACHING GUIDE)
STATISTICS AND PROBABILITY (TEACHING GUIDE)STATISTICS AND PROBABILITY (TEACHING GUIDE)
STATISTICS AND PROBABILITY (TEACHING GUIDE)
 
Global prevalence of autism and other pervasive developmental disorders
Global prevalence of autism and other pervasive developmental disordersGlobal prevalence of autism and other pervasive developmental disorders
Global prevalence of autism and other pervasive developmental disorders
 
Word 2 tha mutha.pt.279
Word 2 tha mutha.pt.279Word 2 tha mutha.pt.279
Word 2 tha mutha.pt.279
 
Guidocondoripañuni+#inf
Guidocondoripañuni+#infGuidocondoripañuni+#inf
Guidocondoripañuni+#inf
 
USO DO GEOGEBRA 3D PARA O ENSINO DE POLIEDROS
USO DO GEOGEBRA 3D PARA O ENSINO DE POLIEDROSUSO DO GEOGEBRA 3D PARA O ENSINO DE POLIEDROS
USO DO GEOGEBRA 3D PARA O ENSINO DE POLIEDROS
 
Livro - código limpo caps (3,4) (clean code)
Livro - código limpo caps (3,4) (clean code)Livro - código limpo caps (3,4) (clean code)
Livro - código limpo caps (3,4) (clean code)
 
ARQUITECTURA BÁSICA DE UNA COMPUTADORA
  ARQUITECTURA BÁSICA DE UNA COMPUTADORA  ARQUITECTURA BÁSICA DE UNA COMPUTADORA
ARQUITECTURA BÁSICA DE UNA COMPUTADORA
 
биотски фактори
биотски факторибиотски фактори
биотски фактори
 
Four dimensions of multimedia
Four dimensions of multimediaFour dimensions of multimedia
Four dimensions of multimedia
 
Chapter 7 – Confidence Intervals And Sample Size
Chapter 7 – Confidence Intervals And Sample SizeChapter 7 – Confidence Intervals And Sample Size
Chapter 7 – Confidence Intervals And Sample Size
 
Confidence Intervals
Confidence IntervalsConfidence Intervals
Confidence Intervals
 
Confidence Intervals And The T Distribution
Confidence Intervals And The T   DistributionConfidence Intervals And The T   Distribution
Confidence Intervals And The T Distribution
 
probability and statistics Chapter 1 (1)
probability and statistics Chapter 1 (1)probability and statistics Chapter 1 (1)
probability and statistics Chapter 1 (1)
 
multimedia chapter1
multimedia chapter1multimedia chapter1
multimedia chapter1
 
Probability and statistics
Probability and statisticsProbability and statistics
Probability and statistics
 
CABT SHS Statistics & Probability - Estimation of Parameters (intro)
CABT SHS Statistics & Probability -  Estimation of Parameters (intro)CABT SHS Statistics & Probability -  Estimation of Parameters (intro)
CABT SHS Statistics & Probability - Estimation of Parameters (intro)
 
Probability and statistics(assign 7 and 8)
Probability and statistics(assign 7 and 8)Probability and statistics(assign 7 and 8)
Probability and statistics(assign 7 and 8)
 

Similaire à T distribution

Point Estimate, Confidence Interval, Hypotesis tests
Point Estimate, Confidence Interval, Hypotesis testsPoint Estimate, Confidence Interval, Hypotesis tests
Point Estimate, Confidence Interval, Hypotesis testsUniversity of Salerno
 
GROUP_9_T-Distribution and percentile.pdf
GROUP_9_T-Distribution and percentile.pdfGROUP_9_T-Distribution and percentile.pdf
GROUP_9_T-Distribution and percentile.pdfEditorialrangedCarto
 
M.Ed Tcs 2 seminar ppt npc to submit
M.Ed Tcs 2 seminar ppt npc   to submitM.Ed Tcs 2 seminar ppt npc   to submit
M.Ed Tcs 2 seminar ppt npc to submitBINCYKMATHEW
 
1.1 course notes inferential statistics
1.1 course notes inferential statistics1.1 course notes inferential statistics
1.1 course notes inferential statisticsDjamel Bob
 
tps5e_Ch10_2.ppt
tps5e_Ch10_2.ppttps5e_Ch10_2.ppt
tps5e_Ch10_2.pptDunakanshon
 
Introduction-to-Tests based on T-distribution.pptx
Introduction-to-Tests based on T-distribution.pptxIntroduction-to-Tests based on T-distribution.pptx
Introduction-to-Tests based on T-distribution.pptxShriramKargaonkar
 
Modelling process quality
Modelling process qualityModelling process quality
Modelling process qualityZenblade 93
 
ders 3.2 Unit root testing section 2 .pptx
ders 3.2 Unit root testing section 2 .pptxders 3.2 Unit root testing section 2 .pptx
ders 3.2 Unit root testing section 2 .pptxErgin Akalpler
 
Chapter 3 Confidence Interval
Chapter 3 Confidence IntervalChapter 3 Confidence Interval
Chapter 3 Confidence Intervalghalan
 
Z and t_tests
Z and t_testsZ and t_tests
Z and t_testseducation
 
ders 3 Unit root test.pptx
ders 3 Unit root test.pptxders 3 Unit root test.pptx
ders 3 Unit root test.pptxErgin Akalpler
 
Chapter 3 Confidence Interval Revby Rao
Chapter 3 Confidence Interval Revby RaoChapter 3 Confidence Interval Revby Rao
Chapter 3 Confidence Interval Revby RaoSumit Prajapati
 
Introduction to the t Statistic
Introduction to the t StatisticIntroduction to the t Statistic
Introduction to the t Statisticjasondroesch
 

Similaire à T distribution (20)

Point Estimate, Confidence Interval, Hypotesis tests
Point Estimate, Confidence Interval, Hypotesis testsPoint Estimate, Confidence Interval, Hypotesis tests
Point Estimate, Confidence Interval, Hypotesis tests
 
Chapter08
Chapter08Chapter08
Chapter08
 
GROUP_9_T-Distribution and percentile.pdf
GROUP_9_T-Distribution and percentile.pdfGROUP_9_T-Distribution and percentile.pdf
GROUP_9_T-Distribution and percentile.pdf
 
Talk 3
Talk 3Talk 3
Talk 3
 
M.Ed Tcs 2 seminar ppt npc to submit
M.Ed Tcs 2 seminar ppt npc   to submitM.Ed Tcs 2 seminar ppt npc   to submit
M.Ed Tcs 2 seminar ppt npc to submit
 
1.1 course notes inferential statistics
1.1 course notes inferential statistics1.1 course notes inferential statistics
1.1 course notes inferential statistics
 
tps5e_Ch10_2.ppt
tps5e_Ch10_2.ppttps5e_Ch10_2.ppt
tps5e_Ch10_2.ppt
 
estimation
estimationestimation
estimation
 
Estimation
EstimationEstimation
Estimation
 
Introduction-to-Tests based on T-distribution.pptx
Introduction-to-Tests based on T-distribution.pptxIntroduction-to-Tests based on T-distribution.pptx
Introduction-to-Tests based on T-distribution.pptx
 
Modelling process quality
Modelling process qualityModelling process quality
Modelling process quality
 
Inferential statistics-estimation
Inferential statistics-estimationInferential statistics-estimation
Inferential statistics-estimation
 
ders 3.2 Unit root testing section 2 .pptx
ders 3.2 Unit root testing section 2 .pptxders 3.2 Unit root testing section 2 .pptx
ders 3.2 Unit root testing section 2 .pptx
 
lecture8.ppt
lecture8.pptlecture8.ppt
lecture8.ppt
 
Lecture8
Lecture8Lecture8
Lecture8
 
Chapter 3 Confidence Interval
Chapter 3 Confidence IntervalChapter 3 Confidence Interval
Chapter 3 Confidence Interval
 
Z and t_tests
Z and t_testsZ and t_tests
Z and t_tests
 
ders 3 Unit root test.pptx
ders 3 Unit root test.pptxders 3 Unit root test.pptx
ders 3 Unit root test.pptx
 
Chapter 3 Confidence Interval Revby Rao
Chapter 3 Confidence Interval Revby RaoChapter 3 Confidence Interval Revby Rao
Chapter 3 Confidence Interval Revby Rao
 
Introduction to the t Statistic
Introduction to the t StatisticIntroduction to the t Statistic
Introduction to the t Statistic
 

Plus de Stephan Jade Navarro (13)

Water conservation
Water conservationWater conservation
Water conservation
 
Photosynthesis
PhotosynthesisPhotosynthesis
Photosynthesis
 
Four spheres
Four spheresFour spheres
Four spheres
 
Exogenous processes on earth
Exogenous processes on earthExogenous processes on earth
Exogenous processes on earth
 
Evolution of life theories
Evolution of life theoriesEvolution of life theories
Evolution of life theories
 
Energy production
Energy productionEnergy production
Energy production
 
Endogenous processes on earth
Endogenous processes on earthEndogenous processes on earth
Endogenous processes on earth
 
Ecology
EcologyEcology
Ecology
 
Continental drift theory stem
Continental drift theory stemContinental drift theory stem
Continental drift theory stem
 
Chemical properties of minerals
Chemical properties of mineralsChemical properties of minerals
Chemical properties of minerals
 
Bioenergetics
BioenergeticsBioenergetics
Bioenergetics
 
Hypothesis testing
Hypothesis testingHypothesis testing
Hypothesis testing
 
Estimation
EstimationEstimation
Estimation
 

Dernier

Advanced Views - Calendar View in Odoo 17
Advanced Views - Calendar View in Odoo 17Advanced Views - Calendar View in Odoo 17
Advanced Views - Calendar View in Odoo 17Celine George
 
BASLIQ CURRENT LOOKBOOK LOOKBOOK(1) (1).pdf
BASLIQ CURRENT LOOKBOOK  LOOKBOOK(1) (1).pdfBASLIQ CURRENT LOOKBOOK  LOOKBOOK(1) (1).pdf
BASLIQ CURRENT LOOKBOOK LOOKBOOK(1) (1).pdfSoniaTolstoy
 
Paris 2024 Olympic Geographies - an activity
Paris 2024 Olympic Geographies - an activityParis 2024 Olympic Geographies - an activity
Paris 2024 Olympic Geographies - an activityGeoBlogs
 
Student login on Anyboli platform.helpin
Student login on Anyboli platform.helpinStudent login on Anyboli platform.helpin
Student login on Anyboli platform.helpinRaunakKeshri1
 
1029-Danh muc Sach Giao Khoa khoi 6.pdf
1029-Danh muc Sach Giao Khoa khoi  6.pdf1029-Danh muc Sach Giao Khoa khoi  6.pdf
1029-Danh muc Sach Giao Khoa khoi 6.pdfQucHHunhnh
 
Activity 01 - Artificial Culture (1).pdf
Activity 01 - Artificial Culture (1).pdfActivity 01 - Artificial Culture (1).pdf
Activity 01 - Artificial Culture (1).pdfciinovamais
 
Interactive Powerpoint_How to Master effective communication
Interactive Powerpoint_How to Master effective communicationInteractive Powerpoint_How to Master effective communication
Interactive Powerpoint_How to Master effective communicationnomboosow
 
IGNOU MSCCFT and PGDCFT Exam Question Pattern: MCFT003 Counselling and Family...
IGNOU MSCCFT and PGDCFT Exam Question Pattern: MCFT003 Counselling and Family...IGNOU MSCCFT and PGDCFT Exam Question Pattern: MCFT003 Counselling and Family...
IGNOU MSCCFT and PGDCFT Exam Question Pattern: MCFT003 Counselling and Family...PsychoTech Services
 
The Most Excellent Way | 1 Corinthians 13
The Most Excellent Way | 1 Corinthians 13The Most Excellent Way | 1 Corinthians 13
The Most Excellent Way | 1 Corinthians 13Steve Thomason
 
9548086042 for call girls in Indira Nagar with room service
9548086042  for call girls in Indira Nagar  with room service9548086042  for call girls in Indira Nagar  with room service
9548086042 for call girls in Indira Nagar with room servicediscovermytutordmt
 
Measures of Central Tendency: Mean, Median and Mode
Measures of Central Tendency: Mean, Median and ModeMeasures of Central Tendency: Mean, Median and Mode
Measures of Central Tendency: Mean, Median and ModeThiyagu K
 
A Critique of the Proposed National Education Policy Reform
A Critique of the Proposed National Education Policy ReformA Critique of the Proposed National Education Policy Reform
A Critique of the Proposed National Education Policy ReformChameera Dedduwage
 
Software Engineering Methodologies (overview)
Software Engineering Methodologies (overview)Software Engineering Methodologies (overview)
Software Engineering Methodologies (overview)eniolaolutunde
 
fourth grading exam for kindergarten in writing
fourth grading exam for kindergarten in writingfourth grading exam for kindergarten in writing
fourth grading exam for kindergarten in writingTeacherCyreneCayanan
 
General AI for Medical Educators April 2024
General AI for Medical Educators April 2024General AI for Medical Educators April 2024
General AI for Medical Educators April 2024Janet Corral
 
Sanyam Choudhary Chemistry practical.pdf
Sanyam Choudhary Chemistry practical.pdfSanyam Choudhary Chemistry practical.pdf
Sanyam Choudhary Chemistry practical.pdfsanyamsingh5019
 
Sports & Fitness Value Added Course FY..
Sports & Fitness Value Added Course FY..Sports & Fitness Value Added Course FY..
Sports & Fitness Value Added Course FY..Disha Kariya
 
Web & Social Media Analytics Previous Year Question Paper.pdf
Web & Social Media Analytics Previous Year Question Paper.pdfWeb & Social Media Analytics Previous Year Question Paper.pdf
Web & Social Media Analytics Previous Year Question Paper.pdfJayanti Pande
 
Beyond the EU: DORA and NIS 2 Directive's Global Impact
Beyond the EU: DORA and NIS 2 Directive's Global ImpactBeyond the EU: DORA and NIS 2 Directive's Global Impact
Beyond the EU: DORA and NIS 2 Directive's Global ImpactPECB
 

Dernier (20)

Advanced Views - Calendar View in Odoo 17
Advanced Views - Calendar View in Odoo 17Advanced Views - Calendar View in Odoo 17
Advanced Views - Calendar View in Odoo 17
 
BASLIQ CURRENT LOOKBOOK LOOKBOOK(1) (1).pdf
BASLIQ CURRENT LOOKBOOK  LOOKBOOK(1) (1).pdfBASLIQ CURRENT LOOKBOOK  LOOKBOOK(1) (1).pdf
BASLIQ CURRENT LOOKBOOK LOOKBOOK(1) (1).pdf
 
Paris 2024 Olympic Geographies - an activity
Paris 2024 Olympic Geographies - an activityParis 2024 Olympic Geographies - an activity
Paris 2024 Olympic Geographies - an activity
 
Mattingly "AI & Prompt Design: Structured Data, Assistants, & RAG"
Mattingly "AI & Prompt Design: Structured Data, Assistants, & RAG"Mattingly "AI & Prompt Design: Structured Data, Assistants, & RAG"
Mattingly "AI & Prompt Design: Structured Data, Assistants, & RAG"
 
Student login on Anyboli platform.helpin
Student login on Anyboli platform.helpinStudent login on Anyboli platform.helpin
Student login on Anyboli platform.helpin
 
1029-Danh muc Sach Giao Khoa khoi 6.pdf
1029-Danh muc Sach Giao Khoa khoi  6.pdf1029-Danh muc Sach Giao Khoa khoi  6.pdf
1029-Danh muc Sach Giao Khoa khoi 6.pdf
 
Activity 01 - Artificial Culture (1).pdf
Activity 01 - Artificial Culture (1).pdfActivity 01 - Artificial Culture (1).pdf
Activity 01 - Artificial Culture (1).pdf
 
Interactive Powerpoint_How to Master effective communication
Interactive Powerpoint_How to Master effective communicationInteractive Powerpoint_How to Master effective communication
Interactive Powerpoint_How to Master effective communication
 
IGNOU MSCCFT and PGDCFT Exam Question Pattern: MCFT003 Counselling and Family...
IGNOU MSCCFT and PGDCFT Exam Question Pattern: MCFT003 Counselling and Family...IGNOU MSCCFT and PGDCFT Exam Question Pattern: MCFT003 Counselling and Family...
IGNOU MSCCFT and PGDCFT Exam Question Pattern: MCFT003 Counselling and Family...
 
The Most Excellent Way | 1 Corinthians 13
The Most Excellent Way | 1 Corinthians 13The Most Excellent Way | 1 Corinthians 13
The Most Excellent Way | 1 Corinthians 13
 
9548086042 for call girls in Indira Nagar with room service
9548086042  for call girls in Indira Nagar  with room service9548086042  for call girls in Indira Nagar  with room service
9548086042 for call girls in Indira Nagar with room service
 
Measures of Central Tendency: Mean, Median and Mode
Measures of Central Tendency: Mean, Median and ModeMeasures of Central Tendency: Mean, Median and Mode
Measures of Central Tendency: Mean, Median and Mode
 
A Critique of the Proposed National Education Policy Reform
A Critique of the Proposed National Education Policy ReformA Critique of the Proposed National Education Policy Reform
A Critique of the Proposed National Education Policy Reform
 
Software Engineering Methodologies (overview)
Software Engineering Methodologies (overview)Software Engineering Methodologies (overview)
Software Engineering Methodologies (overview)
 
fourth grading exam for kindergarten in writing
fourth grading exam for kindergarten in writingfourth grading exam for kindergarten in writing
fourth grading exam for kindergarten in writing
 
General AI for Medical Educators April 2024
General AI for Medical Educators April 2024General AI for Medical Educators April 2024
General AI for Medical Educators April 2024
 
Sanyam Choudhary Chemistry practical.pdf
Sanyam Choudhary Chemistry practical.pdfSanyam Choudhary Chemistry practical.pdf
Sanyam Choudhary Chemistry practical.pdf
 
Sports & Fitness Value Added Course FY..
Sports & Fitness Value Added Course FY..Sports & Fitness Value Added Course FY..
Sports & Fitness Value Added Course FY..
 
Web & Social Media Analytics Previous Year Question Paper.pdf
Web & Social Media Analytics Previous Year Question Paper.pdfWeb & Social Media Analytics Previous Year Question Paper.pdf
Web & Social Media Analytics Previous Year Question Paper.pdf
 
Beyond the EU: DORA and NIS 2 Directive's Global Impact
Beyond the EU: DORA and NIS 2 Directive's Global ImpactBeyond the EU: DORA and NIS 2 Directive's Global Impact
Beyond the EU: DORA and NIS 2 Directive's Global Impact
 

T distribution

  • 2.
  • 3. In the previous discussions, it was shown that when the population is normally distributed, or when the sample size is large enough, the sampling distribution of the mean is normally distributed. And of course, the bell curve is very handy to use.
  • 4. However, in many cases where we can only obtain small sizes, the normal distribution does not hold true. Instead, we use the t distribution which is the distribution of t-scores.
  • 5. t = t score x = sample mean 𝝁 = population mean 𝑺 = sample standard deviation 𝒏 = sample size
  • 6. EXAMPLE 1 Find the t-score for a sample size of 16 taken from a population with mean 10 when the sample mean is 12 and the sample standard deviation is 1.5.
  • 7. Degrees of freedom - the number of observations in a data set that are free to change without changing the mean. For a single group test 𝑑𝑓 = 𝑁 − 1 For 2-group tests 𝑑𝑓 = 𝑁1 + 𝑁2 − 2
  • 8. PROPERTIES of a t distribution 1. The distribution has mean 0. 2. The distribution is symmetric about the mean. 3. The variance is equal to 𝑑𝑓 𝑑𝑓−2 . 4. The variance is always greater than 1, but approaches 1 when df gets bigger.
  • 9. What if n approaches infinity? The t distribution also approaches the standard normal distribution.
  • 10. Increasing the sample size will….
  • 11. Increasing the degrees of freedom will…
  • 12. Increasing the degrees of freedom and sample size will make the t distribution approach a normal distribution.
  • 13. The critical value is the thin line between rejection and acceptance.
  • 14. The confidence interval is actually the acceptance region.
  • 15. The t TABLE 1. The critical region appears at the top. 2. The degrees of freedom are on the leftmost section. 3. Confidence interval are at the bottom.
  • 16. EXAMPLE 2 Find the t-score below which we can expect 99% of sample means will fall if samples of size 16 are taken from a normally distributed population.
  • 17. EXAMPLE 2 SOLUTION 1 − 𝛼 = 0.99 𝛼 = 0.01 𝑑𝑓 = 𝑛 − 1 𝑡0.99 = −𝑡0.01 𝑑𝑓 = 15 𝑡0.99 = −𝑡0.01 = −2.602
  • 18. EXAMPLE 3 If a random sample of size 25 drawn from a normal population gives a mean of 60 and a standard deviation of 4, find the range of t- scores where we can expect to find the middle 95% of all sample means.
  • 19. EXAMPLE 4 Compute the probability that 𝑃 (−𝑡0.05 < 𝑡 < 𝑡0.10).