SlideShare une entreprise Scribd logo
1  sur  32
MANAGEMENT SUMMARY –
Econometric Models of All Sources, HMA and Export Wagering on the
Woodbine 2011 Thoroughbred Race Product
Stephen I. Koch, Woodbine Entertainment Group, March 26, 2012
This document summarizes results of a multivariate regression analysis of the per-race
factors driving wagering on the Woodbine 2011 Thoroughbred Races. This technique empirically
verifies which variables are, or are not, statistically meaningful to per-race wagering handle.
Simultaneously we isolate the true magnitude of these relationships controlling for the often
interdependent relationships of many of the independent variables.
DATA
In this model we primarily estimate net (All Sources) wagering patterns per race for the
2011 Woodbine Thoroughbred racing product. This project is a continued development of the
foundation laid by a series of Woodbine studies ranging from year 2003 through 2011. While we
foremost concentrate on All Sources handle, we diverge heavily into the behaviours of distinct
components of All Sources handle, specifically Home Market Area wagering (HMA) and Export
sourced wagers (All Sources = HMA + Export).
The analysis population involves 1,515 Thoroughbred races run on the Woodbine one-mile
synthetic (Polytrack) and the 1 ½ mile turf track for the full calendar year 2011. We derive all data
used in the construction of the analysis from the Woodbine Wagering Operations handle reporting
and tracking systems in combination with Race Office data on race conditions. Environment
Canada and the Bank of Canada provide our only external data to create controls for weather
variables and foreign monetary exchange rates. Analysis design and methods are consistent with
and generally build upon the extant academic literature, of which we find there is extremely little
that is particularly organized on a per-race or race to race handle basis.
For the primary model the dependent variable, All Sources wagering handle, averages
$279,302 with a median of $258,935. Splitting All Sources handle into its respective components
gives average home market handle of $75,363 and Export sourced handle averages $203,939.
Independent (explanatory) variables include individual race characteristics such as field size,
quality of field, very specific race conditions and restrictions on eligibility, race scheduling,
seasonality, and competitive market factors.
MODEL RESULTS
For the purposes of this summary document we primarily discuss results of the All Sources
Handle analysis. We will refer occasionally to the HMA or Export sources analyses as key
differences in the model outputs warrant.
Field Size
We illustrate the statistically significant relationship between field size and wagering handle
in Figure 1. The black bars demonstrate the marginal percentage impacts on All Sources handle of
having added one additional betting interest up to that point. For example, adding a seventh runner
to a six horse field will on average increase handle about 9.9%, all else held constant. To add a
seventh plus an eighth horse then the average reward accumulates to 19.1% (9.9% + 9.2%) more
SUMMARY – Econometric Models of Wagering on the Woodbine 2011 Thoroughbred Race Product
S. Koch – March 2012
Page 2 of 7
than handle would have been on the six horse field. Notice that the isolated percentage impacts
decrease as we approach the normal maximum field size of 14.
Figure 1. Field size exhibits a positive impact on All Sources Handle, holding all other
variables constant at their average. Marginal handle gains soften as the field
approaches its maximum size.
Quality of Field
Wagering gains strength in relation to increasing quality of race fields. However, at the
lower claiming ranks (any Claiming up to $32k) we find no statistical handle growth. We do
identify increasing wagering gains as quality of field increases through the Allowance 1, the
Allowance 5 through 2 conditions and then the Stake races. We illustrate these All Sources
wagering rewards to quality fields in Figure 2. The percentage data labels in this figure reflect the
isolated percent wagering increase corresponding to the respective race condition versus having
carded a low-end claiming event. For example, an Allowance 4, on average and all else held
constant, yields an 11.3% increase in wagering over having run a $32,000 or lesser claiming event.
Race Events
Woodbine races executed on holidays or other prime dates benefit All Sources handle. The
opening weekend of the racemeet in 2011 corresponded to a 15% boost over the average racedates
through the rest of the year. Good Friday and July 1st
(Canada Day holiday) lift per-race wagering
24% and 39%, respectively, over average racedates. Races executed on the same card as the year’s
Grade I and three other major races benefit handle 38% per race. Finally, on an all-sources basis we
find no statistically significant relationship between handle and races run on a Breeders’ Cup
Championship or Triple Crown date.
12.4%
11.8%
11.1%
10.5%
9.9%
9.2%
8.6%
7.9%
7.3%
6.7%
6.4%
6.0%
3 4 5 6 7 8 9 10 11 12 13 14
N um ber of Betting Interests
AverageAllSourcesHandle
M arginal benefit to average handle of
having added one additional betting interest
SUMMARY – Econometric Models of Wagering on the Woodbine 2011 Thoroughbred Race Product
S. Koch – March 2012
Page 3 of 7
Subdividing the All Sources into HMA and Export - both customer groups seem to receive
opening weekend with similar enthusiasm as the respective streams boost wagering 13% and 16%.
More sizable percentage variance in customer responses to holidays/events can be found on Good
Friday (42% boost HMA, only 18% for Export), July 1st
(53% HMA, 34% Export) and undercard
races on Woodbine’s Gr I or major racedates (53% HMA, 32% Export). Breeders’ Cup or Triple
Crown dates show a zero response, positive or negative, from Export customers but a 12% positive
response from the HMA. This result seems to bear out that HMA customers are enticed to wager on
Woodbine perhaps as a complementary product on these major industry dates but for the more
removed Export customers Woodbine gets relatively eclipsed thus mitigating any foreign benefits.
Figure 2. Increasing field quality via race conditions brings rewards to All Sources handle,
ceteris paribus. Percentage figures identify All Sources wagering gains relative to
having carded the respective condition rather than a low level claiming field.
Race Condition Restrictions
The details internal to the conditions of a race do not seem to have effects on per-race
wagering. We find the incidence of two-year-old, distance and turf restrictions to have zero
statistical relationship with net handle. The industry needs not therefore overthink these restrictions
as a strategic pursuit to grow wagering. For the results on the Turf variable we recommend that the
positive average handle impacts of turf races is more likely born out by field size as reported in
Figure 1. Filly and mare restricted races do have a 2% relationship with Export sourced handle
growth but this effect gets lost from an All Sources or HMA standpoint.
Off-the-turf races create a 9% disruption to All Sources wagering. The home customer is
slightly more forgiving (-6%) than is the Export customer (-10%). This estimate carries out only
the losses due to the surface switch as if the field size were constant. However, an even greater
0%
192.8%
75.5%
51%
34.1%
21.9%
30.1%
17.7%
11.3%7.2%7.60%6.7%
C
laim
ing
4
C
laim
ing
5A
llow
ance
1A
llow
ance
5A
llow
ance
4A
llow
ance
3A
llow
ance
2
O
vernightStake
Scheduled
Stake
G
rade
III
G
rade
II
G
rade
IorM
ajorR
ace
Race Conditions (Claiming 1, 2, 3 and 5 = 0%)
AverageAllSourcesHandle
SUMMARY – Econometric Models of Wagering on the Woodbine 2011 Thoroughbred Race Product
S. Koch – March 2012
Page 4 of 7
wagering loss from off-the-turf racing of course is contained in the reduction of field size as
illustrated in Figure 1.
Collectively, Woodbine customers trim wagering 5% on Ontario Sired restricted races after
having controlled for other important factors such as field size or race conditions. Export customers
seem the harsher critics as they pull back 6% compared to the HMA customer’s more lenient 3%
pullback.
Foreign Exchange
As the U.S. dollar increases in its ability to purchase Canadian dollars so too does handle
increase. This result does not so much suggest that U.S. wagering increases but that the value of
U.S. wagering in Canadian pools increases. Not surprisingly the foreign exchange rate is
statistically insignificant to HMA wagering. Its entire effect is felt in the Export base. We estimate
that a 1 penny increase in the exchange value of the U.S. dollar relates to a 1.3% increase in Export
sources per-race wagering value.
Weather
A ten degrees Celsius gain at Woodbine pushes up All Sources wagering by 4%. It is
interesting that on a percentage basis the Export customer base is more responsive to temperature,
5% per each ten degrees, than is the HMA customer at 3% per ten degrees. HMA wagering loses
1% for each 10 km/hr increase in the day’s high windgusts. Finally, a day’s total precipitation
returns no statistical relationship to wagering.
Scheduling of Races
In Figure 3 we map the flow of wagering as the average racecard progresses. Each bar
represents the wagering increase isolated to that race as compared to race 1 being the ‘zero’
observation. We observe relatively rapid wagering growth through the early part of the average
card and reaching a high plateau at races five, six and seven. Race eight presents a previously
unseen scenario where wagering in each of the streams tumbles. However the late races seem to
quickly regain their strength. We propose that the wagering strength shown at races four through
seven reflect gains inherited from Woodbine’s full-year marketing push on the much favoured
‘early Pick-4’ betting pool. Races six and seven also positively benefit from their position as the
most common races for the ‘Early Pick-4’ and the ‘Late Pick-4’ to overlap each other thereby
increasing, for example, All Sources average handle 6.2% per incidence (note ‘**’ in Figure 3). We
note that this representation of ‘average’ racecard is limiting in its usefulness to management as
different times of day (afternoon or evening cards), parts of the week (weekday, weekend) and
variations in number of races per card may alternatively impact wagering flows.
Figure 4 illustrates the isolated benefits and losses to average wagering for each day of the
week and per wagering source. In the first series, on the left of Figure 4, we view the All Sources
model output with clear wagering maximums for Saturday followed not so closely by Sundays,
Friday and Mondays. We notice that on an All Sources basis that Wednesdays are not different
than Thursdays in their wagering strength. The HMA customers, located in the middle series of
Figure 4, show a greater appreciation for Wednesday cards by wagering 22% stronger than on a
Thursday. Saturdays and Sundays are 40% and 41% better than Thursdays for the HMA. And it is
logical that Mondays receive highest regards from the HMA as these relatively unusual racedates
coincide with Canadian statutory holidays. Export customers, grouped on the right side of Figure 4,
actually seem to prefer Thursday afternoon cards over the Wednesday evening cards by a handle
SUMMARY – Econometric Models of Wagering on the Woodbine 2011 Thoroughbred Race Product
S. Koch – March 2012
Page 5 of 7
margin of 11%. Export wagering is strongest on Saturdays followed distantly by Fridays and then
Sundays. Note that Mondays, coinciding with a holiday for Canadians but not necessarily for
Americans, show zero handle benefits relative to Thursdays for the Export bettors.
Having identified that the HMA and Export customers exhibit opposing preferences for
Wednesdays versus Thursdays we investigate which date earns best revenues for Woodbine. We
apply typical after-purses wagering commission rates to the respective underlying model parameter
estimates to determine that Wednesdays out-earned Thursdays in 2011 by $653 per race.
Continuing this course, we rank the days of the week based upon estimated sum of HMA and
Export commissions to find that Saturday commissions outperform Sundays by 30%, followed by
Friday, Wednesday and then Thursdays. Mondays rank behind Sundays, ahead of Fridays, being
mostly advantaged by HMA holiday effects.
Figure 3. Wagering from each source strengthens through race 7 (exhibiting some
relationships with Pick-4 pool factors) falters at race 8 but rallies through the last
race of the average card, ceteris paribus.
The next variable series of independent variables tests for seasonal business trends across
the months of the racing year. In general we find that April, being the ‘zero’ month by analysis
design, was indeed a relatively weak wagering month. The graph in Figure 5 exhibits that handle
generally gained strength through the summer but the fall months of October and November
presented substantial declines. While HMA and Export wagering followed the same pattern of rise
and fall we notice that HMA led Export into the fall trough and that Export recovered into
December earlier than did HMA. Also, on a percentage basis, the summer into fall slowdown of
wagering for HMA far exceeded the Export slowdown.
1 2* 3 4 5 6** 7** 8 9 10 11 to 13
Race Number (Race1 = 0)
AverageHandle
All Sources Export HMA
SUMMARY – Econometric Models of Wagering on the Woodbine 2011 Thoroughbred Race Product
S. Koch – March 2012
Page 6 of 7
Figure 4. Wagering gains and stalls across the different days of the week. Thursdays serve as
the basement observation by which we compare all other dates on a percentage basis.
Figure 5. Wagering, ceteris paribus, trended strongest through the summer months but hit a
trough in October and November. HMA wagering declines in the fall were relatively
substantial.
-15%
-5%
5%
15%
25%
35%
April May June July August September October November December
PercentageAverageHandleGains/Losses
relativetoApril=0
All Sources Export HMA
0%
22%
15%
13%
15%
31%
40%
28%
19%
41%
12%
14%
49%
0%-11%
ALL SOURCES HMA EXPORT
PercentageAverageHandleGains
relativetoThurdays=0
Wed Fri Sat Sun Mon
SUMMARY – Econometric Models of Wagering on the Woodbine 2011 Thoroughbred Race Product
S. Koch – March 2012
Page 7 of 7
Overlapping posttimes with New York brings harm to the Woodbine wagering. We can
visualize in Figure 6 that the losses in Export wagering due to overlapping posttimes outrun the
HMA losses on a percentage basis. The worst posttime placement for Woodbine is immediately
within the same minute, plus or minus, as a New York race (NYzero) where handle losses
compared to average come to 34% All Sources (or 28% HMA, 36% Export). After NYzero we find
that the Woodbine races fare better if slightly after a New York race (NYminus…) rather than
immediately before its New York counterpart (NYplus…). In summation, Woodbine races most
thrive when timed to run well clear of their larger market share competitor.
Figure 6. Overlapping posttime with New York proves detrimental to wagering on Woodbine
races. Woodbine races that run on top of (NYzero) or just before a New York race
(NYplus) fare worse than their counterparts that run just after a New York race
(NYminus).
CONTACT THE AUTHOR:
Stephen Koch
Vice President – Thoroughbred Racing
Woodbine Entertainment Group
SKoch@WoodbineEntertainment.com
888-675-7223 ext. 2652
-35%
-25%
-15%
-5%
N
Y
m
inus5
N
Ym
inus4
N
Y
m
inus3
N
Y
m
inus2
N
Y
m
inus1
N
yzero
N
Yplus1
N
Y
plus2
N
Y
plus3
N
Yplus4
N
Y
plus5
PercentageAverageHandleLosses
All Sources Export HMA
Econometric Models of All Sources, HMA and Export Wagering on the
Woodbine 2011 Thoroughbred Race Product
Stephen I. Koch, Woodbine Entertainment Group, March 26, 2012
Industry heuristics, rules of thumb and conventional wisdom holds that wagering handle
increases and decreases in relationship to quality of racing. Bettors want full fields of competitive
horses. While obvious on the surface, what lies beneath? That is, what does observed handle tell us
about bettors’ response to varying race conditions, quality of horses, field size, restricted racing, and
seasonality? The simplest attack on these matters is the first order approach; average handle is less
or more on this kind of race compared to this other kind of race. But don’t we know that bettors’
behaviours are more nuanced than this? Given that bettors seem to overwhelmingly prefer larger
fields, why then will a short field stake race on the best business day perhaps out-handle a full field
of claimers on an average racecard? Racing handle evidently rises and falls in response to a more
complex interaction of independent race variables. We implement multivariate regression analysis
to isolate the independent effects of race variables on handle. This technique empirically verifies
which variables are, or are not, meaningful to wagering handle, to what magnitude, while
controlling for the often interdependent relationships of many of the independent variables.
DATA
In this model we primarily estimate net (All Sources) wagering patterns for the 2011
Woodbine Thoroughbred racing product. This model is a continued development of the foundation
laid by a series of Woodbine studies ranging from year 2003 through 2011. While we foremost
concentrate on All Sources handle, we will diverge heavily into the behaviours of distinct sub-
components of All Sources handle – Home Market Area wagering (HMA) and Export sourced
wagers.
All Sources handle is the sum of the pools, generated from all sites located around the globe
wagering on Woodbine events and into Woodbine pools. HMA handle streams plus Export streams
sum to 100% of All Sources handle (HMA+Export=All Sources). HMA wagering generally is
generated by the track’s most direct customer base. These customers are either on-track or betting
from home/internet/otb bases within defined geographic areas surrounding the track’s physical
location. Export wagering sources derive from foreign markets and geographic locations around the
globe, beyond the easy reach of the host track. The variance in revenues back to the host track
from each dollar wagered between these distinct markets is substantial. Home market handle
generates very generally about 8% commissions (after purse payments) on a stream that comprises
27% of total handle. Export handle comprises 73% of All Sources handle but at a generally lesser
commissions rate of 3% (after purses).
The analysis population involves1,515 Thoroughbred races run on the Woodbine one-mile
synthetic (Polytrack) and the 1 ½ mile turf track for the full calendar year 2011. We derive all data
used in the construction of the analysis from the Woodbine Wagering Operations daily handle
reporting and tracking systems in combination with Race Office data on race conditions.
Environment Canada and the Bank of Canada provide our only external data to create controls for
weather variables and foreign monetary exchange rates. Analysis design and methods are
consistent with and generally build upon the extant academic literature, of which we find there is
extremely little that is particularly organized on a per-race or race to race handle basis.
This analysis does not target bettors’ preferences between races at different racetracks and
across different pools other than for an accounting of market-timing. We are working with only the
Econometric Models of Wagering on the Woodbine 2011 Thoroughbred Race Product
S. Koch – March 2012
Page 2 of 25
data for Woodbine races and pools. For the purpose at hand we concern ourselves with the
‘captured’ customer – the customer that has already made the decision that he is to bet Woodbine
rather than competing products.
For the primary model the dependent variable, All Sources wagering handle, averages
$279,302 with a median of $258,935. Splitting All Sources handle into its respective components
gives average home market handle of $75,363 and Export sourced handle averages $203,939.
Independent (explanatory) variables include individual race characteristics such as field size,
quality of field, very specific race conditions and restrictions on eligibility, race scheduling,
seasonality and competitive market factors. For quick reference Table 1 offers brief definitions for
the respective variables. Table 2 provides summary statistics for each variable.
Table 1. Definitions of Analysis Variables
Variable Definition
HandleAll Per race, All Sources wagering handle. Includes all pools, multi-race pools
(P4,P3,DD) divided evenly across relevant race observations.
HandleExport Foreign and non-HMA sourced per-race wagering. Includes all pools, multi-race
pools (P4,P3,DD) divided evenly across relevant race observations.
HandleHMA Home market area sourced per-race wagering. Includes all pools, multi-race pools
(P4,P3,DD) divided evenly across relevant race observations.
Starters Number of horses available as betting interests in the race.
Starters2 =Starters*Starters, quadratic specification of Starters.
RaceQPorIntl =1 if race is the Queen’s Plate or Canadian International, 0 otherwise
CondCL1 =1 if race conditions fit CL1, 0 otherwise.
CondCL2 =1 if race conditions fit CL2 , 0 otherwise.
CondCL3 =1 if race conditions fit CL3, 0 otherwise.
CondCL4 =1 if race conditions fit CL4, 0 otherwise.
CondCL5 =1 if race conditions fit CL5, 0 otherwise.
CondAL1 =1 if race conditions fit AL1, 0 otherwise.
CondAL5 =1 if race conditions fit AL5, 0 otherwise.
CondAL4 =1 if race conditions fit AL4, 0 otherwise.
CondAL3 =1 if race conditions fit AL3, 0 otherwise.
CondAL2 =1 if race conditions fit AL2, 0 otherwise.
StkOvernight =1 if overnight stake, 0 otherwise
StkScheduled =1 if scheduled stake and not graded, 0 otherwise.
StkGr3 =1 if Grade III stake race, 0 otherwise.
StkGr2 =1 if Grade II stake race, 0 otherwise.
StkG1orMajor =1 if Grade I stake races or other major race (Queen’s Plate, Oaks, Breeders’
Stakes), 0 otherwise.
Purse Listed purse available for payout to respective race’s earners.
DayOpening =1 if race is on April 2nd
or April 3rd
(first weekend of 2011 racemeet), 0 otherwise.
DayGoodFri =1 if race is on Good Friday holiday, 0 otherwise.
Econometric Models of Wagering on the Woodbine 2011 Thoroughbred Race Product
S. Koch – March 2012
Page 3 of 25
Table 1 continued.
Variable Definition
DayJuly1 =1 if race is on July 1st
holiday, 0 otherwise.
BCTC =1 if race is same day as Breeders’ Cup or Triple Crown races, 0 otherwise.
DayBigRace =1 if race is on card with a Grade I or other major race event, 0 otherwise.
Age2yo =1 if race restricted to two-year-olds, 0 otherwise.
Furlongs distance of race in furlongs.
Maidens =1 if race restricted to maidens (Allowance, Claiming), 0 otherwise.
Turf =1 if race run on Turf, 0 otherwise.
TurfOff =1 if race originally carded for turf but instead run on polytrack, 0 otherwise.
ONSired =1 if Ontario Sired restricted race, 0 otherwise.
ForEx previous business day’s closing Canada/U.S. monetary exchange rate.
WeatherTemp day’s high temperature in degrees Celsius.
WeatherPrecip day’s total precipitation in millimeters.
WeatherWind day’s maximum wind gust, gusts less than 31km/hr made zero.
Race1 =1 if first race on card, 0 otherwise.
Race2 =1 if second race on card, 0 otherwise.
Race3 =1 if third race on card, 0 otherwise.
Race4 =1 if fourth race on card, 0 otherwise.
Race5 =1 if fifth race on card, 0 otherwise.
Race6 =1 if sixth race on card, 0 otherwise.
Race7 =1 if seventh race on card, 0 otherwise.
Race8 =1 if eighth race on card, 0 otherwise.
Race9 =1 if ninth race on card, 0 otherwise.
Race10 =1 if tenth race on card, 0 otherwise.
Race11to13 =1 if eleventh, twelfth or thirteenth race on card, 0 otherwise.
Wednesday =1 if race on a Wednesday, 0 otherwise.
Thursday =1 if race on a Thursday, 0 otherwise.
Friday =1 if race on a Friday, 0 otherwise.
Saturday =1 if race on a Saturday, 0 otherwise.
Sunday =1 if race on a Sunday, 0 otherwise.
Monday =1 if race on a Monday, 0 otherwise.
April =1 if race is in April, 0 otherwise.
May =1 if race is in May, 0 otherwise.
June =1 if race is in June, 0 otherwise.
July =1 if race is in July, 0 otherwise.
August =1 if race is in August, 0 otherwise.
September =1 if race is in September, 0 otherwise.
October =1 if race is in October, 0 otherwise.
November =1 if race is in November, 0 otherwise.
December =1 if race is in December, 0 otherwise.
NYminus5 =1 if race off-time is 5 minutes after a New York race, 0 otherwise.
NYminus4 =1 if race off-time is 4 minutes after a New York race, 0 otherwise.
NYminus3 =1 if race off-time is 3 minutes after a New York race, 0 otherwise.
NYminus2 =1 if race off-time is 2 minutes after a New York race, 0 otherwise.
Econometric Models of Wagering on the Woodbine 2011 Thoroughbred Race Product
S. Koch – March 2012
Page 4 of 25
Table 1 continued.
Variable Definition
NYminus1 =1 if race off-time is 1 minute after a New York race, 0 otherwise.
NYzero =1 if race off-time is same minute as a New York race, 0 otherwise.
NYplus1 =1 if race off-time is 1 minute before a New York race, 0 otherwise.
NYplus2 =1 if race off-time is 2 minutes before a New York race, 0 otherwise.
NYplus3 =1 if race off-time is 3 minutes before a New York race, 0 otherwise.
NYplus4 =1 if race off-time is 4 minutes before a New York race, 0 otherwise.
NYplus5 =1 if race off-time is 5 minutes before a New York race, 0 otherwise.
Table 2. Summary statistics of Analysis variables (n = 1,515)
Variable Mean Std. Dev. Median Sum Maximum Minimum
HandleAll 279,302 138,813 258,935 423,142,004 3,020,076 45,993
HandleExport 203,939 103,792 187,068 308,967,211 2,050,883 26,676
HandleHMA 75,363 39,434 70,510 114,174,794 969,194 15,617
Starters 8.49 2.22 8.00 12,863 17.00 3.00
RaceQPorIntl 0.001 0.04 0.00 2 1.00 0.00
CondCL1 0.26 0.44 0.00 396 1.00 0.00
CondCL2 0.10 0.30 0.00 149 1.00 0.00
CondCL3 0.09 0.29 0.00 139 1.00 0.00
CondCL4 0.09 0.29 0.00 137 1.00 0.00
CondCL5 0.003 0.06 0.00 5 1.00 0.00
CondAL1 0.19 0.39 0.00 284 1.00 0.00
CondAL5 0.11 0.31 0.00 166 1.00 0.00
CondAL4 0.07 0.25 0.00 103 1.00 0.00
CondAL3 0.01 0.85 0.00 11 1.00 0.00
CondAL2 0.005 0.07 0.00 7 1.00 0.00
StkOvernight 0.01 0.10 0.00 16 1.00 0.00
StkScheduled 0.04 0.20 0.00 66 1.00 0.00
StkGr3 0.01 0.11 0.00 18 1.00 0.00
StkGr2 0.01 0.08 0.00 10 1.00 0.00
StkGr1orMajor0.01 0.07 0.00 8 1.00 0.00
Purse 55,739 70,872 47,800 84,444,500 1,500,000 16,100
DayOpening 0.01 0.11 0.00 20 1.00 0.00
DayGoodFri 0.01 0.08 0.00 10 1.00 0.00
DayJuly1 0.01 0.08 0.00 9 1.00 0.00
BCTC 0.04 0.19 0.00 54 1.00 0.00
DayBigRace 0.03 0.17 0.00 45 1.00 0.00
Filly 0.47 0.50 0.00 706 1.00 0.00
Age2yo 0.16 0.37 0.00 245 1.00 0.00
Furlongs 6.99 0.37 7.00 10,584 15.00 4.50
Maidens 0.41 0.49 0.00 626 1.00 0.00
Turf 0.11 0.32 0.00 171 1.00 0.00
Econometric Models of Wagering on the Woodbine 2011 Thoroughbred Race Product
S. Koch – March 2012
Page 5 of 25
Table 2 continued.
Variable Mean Std. Dev. Median Sum Maximum Minimum
TurfOff 0.04 0.20 0.00 61 1.00 0.00
ONSired 0.22 0.43 0.00 336 1.00 0.00
ForEx 0.988 0.03 0.980 1497 1.055 0.943
WeatherTemp 19.93 7.86 20.90 30190 35.80 3.70
WeatherPrecip2.70 5.92 0.00 4083 34.20 0.00
WeatherWind 26.79 24.76 33.00 40,580 82.00 0.00
Race1 0.11 0.31 0.00 165 1.00 0.00
Race2 0.11 0.31 0.00 165 1.00 0.00
Race3 0.11 0.31 0.00 165 1.00 0.00
Race4 0.11 0.31 0.00 165 1.00 0.00
Race5 0.11 0.31 0.00 164 1.00 0.00
Race6 0.11 0.31 0.00 164 1.00 0.00
Race7 0.11 0.31 0.00 164 1.00 0.00
Race8 0.11 0.31 0.00 164 1.00 0.00
Race9 0.07 0.26 0.00 107 1.00 0.00
Race10 0.05 0.22 0.00 77 1.00 0.00
Race11to13 0.01 0.10 0.00 15 1.00 0.00
Wednesday 0.17 0.37 0.00 253 1.00 0.00
Thursday 0.12 0.33 0.00 185 1.00 0.00
Friday 0.20 0.40 0.00 305 1.00 0.00
Saturday 0.24 0.43 0.00 363 1.00 0.00
Sunday 0.24 0.43 0.00 369 1.00 0.00
Monday 0.03 0.16 0.00 40 1.00 0.00
April 0.09 0.28 0.00 135 1.00 0.00
May 0.11 0.32 0.00 170 1.00 0.00
June 0.13 0.34 0.00 200 1.00 0.00
July 0.13 0.33 0.00 192 1.00 0.00
August 0.13 0.33 0.00 191 1.00 0.00
September 0.13 0.33 0.00 198 1.00 0.00
October 0.13 0.33 0.00 193 1.00 0.00
November 0.13 0.33 0.00 193 1.00 0.00
December 0.03 0.17 0.00 43 1.00 0.00
NYminus5 0.01 0.11 0.00 18 1.00 0.00
NYminus4 0.01 0.08 0.00 9 1.00 0.00
NYminus3 0.01 0.10 0.00 14 1.00 0.00
NYminus2 0.003 0.06 0.00 5 1.00 0.00
NYminus1 0.01 0.09 0.00 12 1.00 0.00
NYzero 0.02 0.14 0.00 30 1.00 0.00
NYplus1 0.02 0.13 0.00 28 1.00 0.00
NYplus2 0.01 0.11 0.00 18 1.00 0.00
NYplus3 0.02 0.13 0.00 27 1.00 0.00
NYplus4 0.02 0.14 0.00 30 1.00 0.00
NYplus5 0.03 0.16 0.00 41 1.00 0.00
Econometric Models of Wagering on the Woodbine 2011 Thoroughbred Race Product
S. Koch – March 2012
Page 6 of 25
Field Size
There pre-exists overwhelming evidence, both empirical and anecdotal, that field size serves
as the single most important per-race handle determinant. That is, how many individual runners are
there in a given race available to place wagers on or against. More betting interests increases the
competitiveness of the race and spreads the wagered dollars across more choices and more
combinations of choices allowing for larger odds and better payoffs for the winning wagers. We
will re-test this notion with the variable Starters, defined as the number of runners as separate
betting interests in each respective race. Earlier Woodbine studies have shown that a quadratic, or
curved, relationship exists where there are positive yet decreasing rewards to handle for each
additional horse in a race. For example, we expect to again show that the bet generally increases
more in response to adding a fifth horse to a four horse field than it will increase to add a tenth
horse to a nine horse field. We test for this concave relationship with the variable Starters2
(Starter2=Starters*Starters). Two specific races in the 2011 data pose outlier complications to the
Starters test. The Queen’s Plate and the Canadian International fielded oversized groups of 17 and
16 horses, respectively. Maximum field size for every other race through the year is capped at 14.
Added to this, these marquee races produce disproportionately large wagering. We include a
dichotomous binary (dummy) variable named RaceQPorIntl in order to control for this combined
outlier effect.
Quality of Field
Increasing the average quality of the runners in any given race should be desirable to the
customers. Customers anecdotally prefer stakes caliber horses which would seem to be more
formful and interesting wagering propositions compared to less talented horses such as in the lower
claiming ranks. The Racing Secretary defines each race’s eligibility conditions such that only a
certain quality of horse is eligible for that event. Thus competitive fields are ensured rather than
short-odds runaway winner type races that would be relatively less bet according to a series of
University of Arizona studies by Margaret Ray. Previous studies have approached this quality of
field variable via two differing methods. Either case may not necessarily be the best approach as
each has an advantage and a disadvantage. Rather, previous specifications seem to have been
chosen due to constraints in the data. This analysis enjoys the luxury of complete data to test either
specification and we therefore execute both.
The first approach to quantifying field quality implements a series of dummy variables
reflecting various race condition types. The quality steps of the Woodbine Thoroughbred races can
be distilled down to three major stratifications – Claiming, Allowance and Stakes. We then further
compartmentalize these three major groups into five claiming classes, five allowance classes and
five designations for stake races (see Table 3). Each class is treated as a dummy variable equaling 1
if the respective race fits this class and 0 otherwise.
CondCL1 is the lowest quality ranks – claiming runners – horses running for the smallest
purses where we expect the least wagering, holding all other variables constant. CondCL2 is a step
up in talent from CondCL1 with a likewise increase in purses and we thus expect an increase in the
wagering on these events. CondCL3, CondCL4 and CondCL5 continue this pattern of increasing
field quality for increasing purses through to the highest of the lowest strata of horses.
For the allowance race conditions, the middle quality group, CondAL2 should grow handle
compared to CondAL3, CondAL4 and then CondAL5. The entry level allowance races with the
lowest average allowance purses, known as maiden allowance, form the group CondAL1. We
number the CondAL variables consistent with Race Office practice where these races are often
Econometric Models of Wagering on the Woodbine 2011 Thoroughbred Race Product
S. Koch – March 2012
Page 7 of 25
short-formed as, for example, ‘allowance 2’ or ‘allowance 5’. It is a historical oddity of Race
Office practices as to why the progression would illogically proceed 1,5,4,3,2 as we climb in quality
but we shall remain true to this form herein (again, see Table 3).
Table 3. Definitions for Race Condition Variables with Average Purses
Race Condition Definition Average 2011 Purse
Claiming and Maiden Claiming
CL1 ‘bottoms’ through $16,000 claiming price $21,512
CL2 $20,000 claiming price $27,862
CL3 $25,000 through $32,000 claiming price $37,825
CL4 $40,000 through $50,000 claiming price $46,018
CL5 $62,500, $80,000, $100,000 claiming price $48,600
Allowance
AL1 Maiden Allowance, Allowance ‘B’ $60,276
AL5 Non-winners OMC/Non-winners 2 $64,873
AL4 Non-winners 2 OMC/Non-winners 3 $68,975
AL3 Non-winners 4 OMC and $79,700
Non-winners 3 OMC
AL2 Open Allowance $89,400
Stakes
Overnight Stakes $100,000
Scheduled Stakes $150,379
Grade III $169,444
Grade II $240,000
Grade I or Major Races $812,500
The highest performing horses eventually find their way to the stakes races. These high
quality race fields battle for the biggest, sometimes windfall, purses. Overnight stakes form the
entry-level ranks where solid-performing allowance horses can take a step up for a relatively light
stakes purse. Overnight stakes acquire their name from the fact that they can be carded or not
carded ‘overnight’ rather than being locked into a calendar date far in advance. In turn, scheduled
stakes are planned for months in advance as are the graded stakes. Graded stakes form the peak of
racing competition where Grade III (StkGr3) is outclassed by Grade II (StkGr2) which is in turn
outclassed by Grade I races. Woodbine uniquely offers 3 non-graded stake races at purses
competitive with Grade 1 events anywhere: the Woodbine Oaks $500,000, Queen’s Plate
$1,000,000 and the Breeders’ Stakes $500,000. For this analysis we include these three non-graded
races with the Grade I’s thus forming the variable StkG1or Major.
In all cases for the various claiming, allowance and stakes designations we expect that
wagering handle increases along with the quality of the field as we hold constant for all other
variable factors.
The alternate quality of field specification implements race purses as a proxy for increasing
competition levels. The amount of money available as payment to the winners of a race generally
increases as the conditions of the race calls for tougher competitors (Table 3). A stake race offers a
Econometric Models of Wagering on the Woodbine 2011 Thoroughbred Race Product
S. Koch – March 2012
Page 8 of 25
bigger purse than an allowance race, which is more valuable than a maiden allowance which in turn
is more valued than the respective claiming ranks. The Purse variable we would expect therefore to
exhibit a positive relationship with wagering handle. We do not make the error of assuming that
purses, while a fine proxy for field quality, hold any particular correlating value to the punter who
himself dictates race handle. That is, the punter doesn’t care what does the horse stand to earn from
the race but he does care that the entrants have been controlled for relatively high, medium or low
quality levels of competition.
Race Events
Through the racing year Woodbine benefits from certain special racing events contributing
to wagering boosts. We control for these positive business dates with a series of dummy variables
where observations equal 1 for races on the respective date and 0 otherwise. The dates controlled
for in this manner are the two days of opening weekend for the racemeet in April (DayOpening),
Good Friday (DayGoodFri) and July 1st
Canada Day (DayJuly1). Major wagering events at other
racetracks can also be drivers of handle for the Woodbine live races. We control for the
coincidence of Triple Crown and the Breeders’ Cup Championship racedates with the dummy
variable name BCTC. Finally, marquee race events at Woodbine certainly benefit the wagering on
undercard races run that same day. We control for this phenomenon with the dummy variable
DayBigRace.
Race Condition Restrictions
There are more than just quality of field restrictions written into the race conditions. The
Racing Secretary will further segregate races by sex, age. racing surface (turf versus synthetic) and
distance. Or, he will often introduce more artificial restrictions such as to honour breed
development programs.
Typically fillies and mares will not mingle in competition with colts and geldings. While
this is generally held to for competitiveness reasons, what do the customers think? Do filly-
restricted races get bet less or more than open races? We test this with another dummy variable,
Filly, where filly and mare restricted races equal 1 and all other races are assigned 0.
Similar to the segregation by sex the races will often exclude horses of certain ages. Very
young horses will always be at a maturity and competitiveness disadvantage to older racing
veterans. In 2011 there were 245 races at Woodbine restricted to the youngest runners, two-year-
olds. Two-year-olds generally have very few or no previous races from which customers may
gauge competitiveness. On one hand this information shortage can be a disadvantage to handle but
it can be likewise an advantage for customers that feel they have other informational advantages.
The dummy variable where we assign 1 for two-year-old races and 0 to all other races should
identify what are effects of two-year-old racing on handle.
The highly varied distances of thoroughbred racecards is a distinguishing factor from other
breeds of racing. Thoroughbreds at Woodbine will race anywhere from 4.5 furlongs to a mile (8
furlongs) or even further to 1 7/8ths miles. We test for the wagering effects of longer or shorter
racing distances with the continuous variable titled Furlongs. Furlongs equals the number of
furlongs assigned as the distance of the respective race.
A horse that has never won a race is referred to as a maiden. The Race Office routinely
cards races for these non-winners where horses with winning form are specifically excluded.
Maiden races can be at various claiming level as well as the entry allowance level, allowance 1. We
Econometric Models of Wagering on the Woodbine 2011 Thoroughbred Race Product
S. Koch – March 2012
Page 9 of 25
create the dummy variable Maidens to identify if fields of non-winners serve detriment to wagering
volume.
Woodbine racetrack is very proud of it expansive 1 ½ mile turf course. The turf, in
complement with the 1 mile synthetic surface (Polytrack), provides a broad variety of racing
opportunities for horses that prefer different racing surfaces. In 2011 the high quality turf available
at Woodbine consistently attracted above average sized fields (9.49 starters per turf race, 8.36 per
synthetic race) and high quality runners from other foreign racetracks. We test for a relationship
between turf racing and customer preferences, via their wagering dollars, with the variable named
Turf where turf races equal 1 and synthetic track races equal 0. A common misconception regards
the relationship of turf racing to handle. Turf racing itself likely is not the immediate driver of
handle that some would tout. This analysis proposes that the increased average handle on turf races
over main track races primarily is driven by other turf-related factors such as, more likely, increased
average field size per turf race relative to main track races.
Occasionally races originally carded for the turf course will instead be run on the synthetic
surface due to wet conditions that would present dangerous turf conditions to the horses or more
often compromise the maintenance and longevity of the turf course. These late changes in surface
are problematic to betting customers as sometimes horses will scratch from the race or runners can
show different form on a surface that they were not originally intended for. We organize the
TurfOff variable to test for negative wagering aspects of turf to synthetic surface switches.
The final race conditions restriction we test regards the Ontario Sired events. This breed
development program allows for locally bred horses, direct progeny of stallions registered as
standing in Ontario, to compete against their own rather than facing open company. Ontario Sired
restrictions applied to some maiden claiming $25,000, allowance 1, allowance 5 and even some
stake conditions in 2011. This concept is designed as an economic spur for Ontario produced
horses and in turn as a rural/agricultural economic development program. Every rose has its thorn
however. In this case – what is the response to restricted racing from customers distributed across
the globe (immensely outnumbering Ontario/local customers), in highly saturated simulcast
markets? For precedence we turn to DeGennaro’s 1989 study titled “Determinants of Wagering
Behavior”. DeGennaro concluded that restricted races with added purses offer no benefit to handle.
Our expectations go further than DeGennaro’s results in that Ontario Sired restrictions likely serve
actual detriment to handle. In the years since the 1989 study the international distribution model of
horseracing has matured, competition continually sharpens and the marketplace is as cluttered with
product as ever. Regional events such as Sire restrictions simply lack appeal relative to more open
events with known and/or perceived higher quality runners. In short, customers find it very easy to
turn the page on races they do not prefer. To test for this behaviour we construct ONSired as a
dummy variable where Ontario Sired restricted races equal 1 and open races equal 0.
Foreign Exchange
The Woodbine product enjoys broad distribution across numerous international markets.
Foreign monetary exchange rates certainly provide a considerable force towards increasing or
restraining wagering totals. In particular, the U.S./Canadian exchange rate is most influential as the
overwhelming majority of Woodbine’s international distribution is throughout the U.S. A strong
Canadian dollar implies that U.S. dollars bet into Canadian pools translate to a relatively smaller
sum than in periods where the Canadian dollar is relatively weaker than its U.S. cousin. The
continuous variable ForEx assigns the previous business day’s closing US/Canada exchange rate
(U.S. purchasing Canadian dollars) to each respective race observation. We expect that as this rate
Econometric Models of Wagering on the Woodbine 2011 Thoroughbred Race Product
S. Koch – March 2012
Page 10 of 25
increases then the wagering effect will be negative, particularly in a model constrained to only
Export sourced wagering. We expect HMA wagering to be less susceptible to foreign exchange
rates.
Weather
On-track weather conditions perhaps have conflicting roles in driving wagering. On one
hand one expects that enjoyable weather would improve on-track attendance and its related
wagering figures. Alternatively, most of horserace wagering is consumed off-track via television
monitor and internet connections in far-flung geographies so that enjoyable weather might be not
relevant. Separate from this, certain weather conditions can impact the outcome of races as
different horses may benefit from varied weather conditions. We test for weather impacts with
three continuous variables reflecting the day’s high temperature (WeatherTemp), total precipitation
for the day (WeatherPrecip) and maximum winds for the respective date (WeatherWind). We pull
this data from Environment Canada as it is collected at Pearson Airport located immediately next
door to the Woodbine racetrack. Unfortunately for the wind variable Environment Canada does not
report days’ maximum wind gusts if they are less than 31 km/hr. We assign a zero to these low
wind observations to reflect that perhaps this threshold of low wind gusts has no handle impacts.
Certainly the WeatherTemp variable carries some seasonal aspects with it as is evidenced by
relatively high cross correlations with certain spring and fall month variables (presented later under
‘Scheduling of Races’). May and September show quite low correlations with the temperature
variable but the other months range from +/- 0.20 to +/- 0.48. But the temperature’s relevance from
day to day is certainly substantive and we retain this variable for exactly that explanatory power.
Scheduling of Races
There is reason and evidence, including historical analyses, suggesting that the flow of a
day’s racecard impacts wagering. In a strictly on-track environment it seems reasonable that the
later races would be bet more than earlier races as the late arriving crowd invests at the mutuel
windows. It further seems that the very late races (particularly for a night product such as is the
Wednesday night cards) may experience diminishing handle as the crowd gets tired and goes home.
Or, have recent marketing pushes on the ‘Early Pick-4’ wager (races 4, 5, 6 and 7) impacted the
flow of wagering through the raceday? In the modern simulcasting environment though this pattern
could be mitigated as handle is less tied to the host racetrack. Do bettors in different time zones
being saturated with multiple products on different schedules collectively react less to racecard
scheduling? We test these various questions with a series of dummy variables where Race1 equals
1 if a race is the first race of its respective card, 0 otherwise and Race2 equals 1 if the second race
on a card and 0 otherwise and so forth through the last race of the card. Generally, Wednesday and
Thursday cards in 2011 were 8 races, Friday most often offered 9 races and a full card on Saturdays
and Sundays included 10 races. Very rarely a major racedate card offered 11, 12 or 13 races which
we combine into the dummy variable Race11to13 (15 observations total). We expect to find that
each later race increases handle relative to the first race on the card.
Seasonal and weekly business patterns emerge for many businesses. Pari-mutuel wagering
is not exempt. Certain days of the week, such as weekends, will consistently be stronger business
days than weekdays. Or within the week Wednesdays or Thursdays might, on average, perform
stronger than their counterpart due to differences in the simulcast market. Not unlike days of the
week, months of the year can reflect seasonal rise and falls in business as well as reflect industry
business trends. Through the year one might expect wagering activity to increase in good weather
Econometric Models of Wagering on the Woodbine 2011 Thoroughbred Race Product
S. Koch – March 2012
Page 11 of 25
(summer) and decline in the winter. Or longer term downward and upward economic trends may
override seasonal trends as the year progresses. To test the business patterns within the week we
construct a series of dummy variables where 1 equals the respective day of the week and 0 for the
other days for Wednesday, Thursday, Friday, Saturday, Sunday and Monday. We likewise
construct dummy variables for each calendar month, April through December, where observations
for the respective month equal 1 and 0 otherwise.
Now that we have organized the analysis for race number, day of the week and month –
what is the relevance of a minute? Woodbine extends considerable effort timing its race off-times
to the perfect moment within the broader simulcast market. The Woodbine Live Thoroughbred
product has long suffered a market disadvantage to competing, larger market share products. The
diversity and simultaneity of products at international simulcast venues requires that our customers
must either split their attention thinly between races or altogether ignore their second choice
content. Our simulcast directors and Race Office have long scheduled races specifically to dodge
these circumstances and our customers vote accordingly with their dollars.
We can perhaps demonstrate this phenomenon with a series of dummy variables indicating
races that are run within a critical few minutes of North America’s leading market share competitor
– New York. The NYminus5 variable equals 1 for Woodbine races run 5 minutes after a New York
race. Similarly, NYminus4, NYminus3, NYminus2 and NYminus1 are constructed to equal 1 for
races run at the respective number of minutes after a New York race and 0 for all others. NYzero
equals 1 for races run within the same minute, plus or minus, of a New York race. The NYplus1,
NYplus2, NYplus3, NYplus4 and NYplus5 variables equal 1 for races run the respective number of
minutes before a New York race. Woodbine’s long experience indicates that races run just after a
New York race fare better than their counterparts run immediately prior to the New York race.
Going forward in this document we will often refer to the NYminus, NYzero and NYplus series of
variable as New York minutes. As a tribute to Woodbine’s savvy in dodging New York races the
number of 2011 Woodbine race observations fitting these New York minutes definitions is very
small – only 232. More than half (52%) of these 232 are first race and second race incidences
where Woodbine frequently sacrifices lesser bet early races in order to ensure that more valuable
later races absolutely are not on schedule to conflict with New York.
THE MODELS
We present two All Sources Handle functions as set forth in the preceding ‘Data’
explanations. Recall that the opposing methods controlling for Quality of Field (claiming,
allowance and stake race conditions dummy variables versus a continuous Purses specification) call
for dual model specifications. The Race Conditions model will be tested first on an All Sources
handle basis consistent with the Purses model. But we subsequently subdivide the All Sources
analysis into its component streams of HMA and Export so that there totals four econometric
models for presentation and discussion.
Purses Model:
Handle = f(Starters, Starters2, RaceQPorIntl, Purses, DayOpening, DayGoodFri, DayJuly1,
BCTC, Filly, Age2yo, Furlongs, Maidens, Turf, TurfOff, ONSired, ForEx, WeatherTemp,
WeatherPrecip, WeatherWind, Race2, Race3, Race4, Race5, Race6, Race7, Race8, Race9,
Race10, Race11to13, Wednesday, Friday, Saturday, Sunday, Monday, May, June, July,
Econometric Models of Wagering on the Woodbine 2011 Thoroughbred Race Product
S. Koch – March 2012
Page 12 of 25
August, September, October, November, December, NYminus5, NYminus4, NYminus3,
NYminus2, NYminus1, NYzero, NYplus1, NYplus2, NYplus3, NYplus4, NYplus5)
Race Conditions Model:
Handle = f(Starters, Starters2, RaceQPorIntl, CondCL2, CondCL3, CondCL4, CondCL5,
CondAL1, CondAL5, CondAL4, CondAL3, CondAL2, StkOvernight, StkScheduled,
StkGr3, StkGr2, StkGr1orMajor, DayOpening, DayGoodFri, DayJuly1, BCTC, Filly,
Age2yo, Furlongs, Maidens, Turf, TurfOff, ONSired, ForEx, WeatherTemp, WeatherPrecip,
WeatherWind, Race2, Race3, Race4, Race5, Race6, Race7, Race8, Race9, Race10,
Race11to13, Wednesday, Friday, Saturday, Sunday, Monday, May, June, July, August,
September, October, November, December, NYminus5, NYminus4, NYminus3, NYminus2,
NYminus1, NYzero, NYplus1, NYplus2, NYplus3, NYplus4, NYplus5)
Notice that we remove the variables Race1, Thursday and April from both functions and we
remove CondCL1 from the Race Conditions function. To include a dummy variable across every
observation leads us to a singular matrix and in turn defeats the attempt at OLS regression. We
choose these particular dummy variables to drop as they represent the bottom level or first level of
their respective variable groups. They become then the ‘zero’ or basis of comparison for their
relative variables’ parameter estimates. For example, we designed the day of week variables such
that Thursdays set a foundation (Thursday parameter estimate is 0) where the remaining days of the
week are marginally more or less valuable to handle according to their respective parameter
estimates. The other variable groups designed in this fashion explain the progression of the
racecard (Race1 parameter estimate is 0) changes in race condition (CondCL1 parameter estimate is
0) and the calendar months (April parameter estimate is 0).
RESULTS
All four models implement linear specifications. We encounter heteroskedasticity due to the
variance of the dependent Handle variables as well as the independent variable Purse. To preempt
the heteroskedastic effects but maintain the simplicity of a linear model output (as opposed to a
logarithmic specification of Handle and Purse) we implement White’s approach towards
heteroskedasticity corrected standard errors as facilitated by our statistical software (E-Views 7.0).
The data, being from every race for a year, is somewhat time-series in its organization. For
example, today’s handle may be related to yesterday’s handle and may in turn relate to tomorrow’s
handle. And, even within the individual racecards we acknowledge this relationship with the
Race2, Race3,…, Race11to13 dummy variables. It is understood that time-series data is prone to
autocorrelation and its pitfalls. Future studies into this matter wrestle with the notion of ‘stacked’
autocorrelation but for now we sideline the matter as beyond the scope of the current project. To
circumvent this in the data and to treat each race as its own event we re-order the observations on a
random basis prior to modeling and regression. The respective regression outputs have a Durbin-
Watson test value of 2.12 and 2.08, respectively, implying that auto-correlation has been mitigated
for the purposes of this current project.
The All Sources models explain (coefficient of variation, r-squared) 80 percent and 81
percent, respectively, of the variation in defined handle. For ease of comparison we outline the
complete results for both econometric models in Table 4. The left-most column identifies the
various independent variables. The right-side series of columns identify the parameter estimates for
Econometric Models of Wagering on the Woodbine 2011 Thoroughbred Race Product
S. Koch – March 2012
Page 13 of 25
the respective independent variables. We present side by side the output for the All Sources Purses
Model and the All Sources Race Conditions model. Similarly we present the subdivision models
(HMA sources Race Conditions Model and Export sources Race Conditions Model where HMA +
Export = All Sources) contiguous to the All Source Race Conditions Model for simplicity of
comparisons. The grey columns in the three Race Conditions Models present the parameter
estimates as a percentage of the respective wagering stream’s average handle.
In Table 4 each parameter estimate identifies the average, ceteris paribus (all other variables
held constant at their sample means) marginal impacts on wagering handle per incidence or increase
of the associated variable. Statistical significance of an estimate is notated with “*”. Statistically
insignificant estimates (no *’s) may be interpreted as being not different than zero in their
relationship to the dependent handle variable. Purse or Race Conditions variables purposely
omitted from a respective model are denoted as ‘na’.
The two competing specifications allow an additional benefit to the analysis in that we can
demonstrate some robustness of analysis results. Parameter estimates seem consistent across the
models with only some minor variations. As a benefit of the robust models we will concentrate
hereafter on results of the All Sources Handle Race Conditions Model (presented as bold type in
Table 4). We will refer back to the Purses Model and the HMA or Export sources Race Conditions
Models as key differences in the model outputs warrant.
Field Size
We illustrate the statistically significant quadratic relationship between field size (Starters
and Starters2) and wagering handle in Figure 1. The black bars demonstrate the marginal
percentage impacts on All Sources handle of having added one additional betting interest up to that
point. For example, adding a seventh runner to a six horse field will on average increase handle
about 9.9%, all else held constant. To add a seventh plus an eighth horse then the average reward
accumulates to 19.1% (9.9% + 9.2%) more than handle would have been on the six horse field.
Notice that the isolated percentage impacts decrease as we approach the normal maximum field size
of 14.
The dummy variable controlling for the extraordinary field size and outlier wagering
experience of the Queen’s Plate and the International (RaceQPorIntl) shows that wagering lifted
$1,302,258 after having controlled for other input factors. Obviously these marquee events bring
positive reputation effects for the track along with related one-time handle windfalls. Interestingly,
the Purses model returns a statistically insignificant result on RaceQPorIntl. We interpret that
within this alternative model the extraordinary purses on these races mitigates the impacts of their
respective outlier field sizes.
Quality of Field
The Race Conditions model outputs statistically significant and positive estimates for
increasing field quality. Using the bottom level (CondCL1) races as our base of comparison we
identify that CondCL2, CondCL3 and CondCL5 are not different than CondCL1 in their
relationship to driving All Sources handle. Although, CondCL2 and CondCL3 do show statistical
significance in the HMA model signifying that there exist rewards specifically from the home
market customers for increasing quality of claiming fields. It seems an oddity in the data that
CondCL4 would outperform CondCL5 though we note after the fact that CondCL5 holds only 5
observations for the year. More importantly, in all models we easily identify increasing wagering
gains as quality of field increases through the Allowance and Stake races. We illustrate these
Econometric Models of Wagering on the Woodbine 2011 Thoroughbred Race Product
S. Koch – March 2012
Page 14 of 25
rewards to quality fields in Figure 2. The percentage data labels in this figure reflect the isolated
percent wagering increase corresponding to the respective race condition versus having carded a
low-end claiming event. For example, from an All Sources standpoint an Allowance 4 on average
and all else held constant yields an 11.3% increase in wagering over having run a ConCL3 or lesser
claiming event. Notice also the trendline added into Figure 2 acknowledging the positive
relationship between race conditions and purses as a proxy for quality of field.
The estimated increases between the race conditions parameter estimates, particularly at the
Allowance and Stake levels, in the first model suggests that the alternate model implementing
purses as proxy for quality of field is relevant. At the statistically significant Purse parameter
estimate of 0.72 we calculate that for each $25,000 purse jump there comes a related All Sources
wagering boosts of $18,000 or 6.4% of average handle. Purses seem to be a logical proxy for
quality of field for future analyses concentrated within a single racetrack’s purse structure. We note
that this approach may go astray though if applied to data reaching across varied purse structures
such as from multiple racetracks or multiple years where like race conditions may have offered
differing purse levels.
Table 4. Summary of statistically significant parameter estimates for the Purses Model and
the Race Conditions Models. Dependent variable is All Sources, HMA and Export
sourced wagering handle. Percent figures reflect parameter estimates’ percentage
relevance to respective handle sources. Statistical significance denoted with *’s.
Independent
Variables
Starters 35,705 * 39,119 * 9,833 * 29,286 *
Starters2 -723 *** -892 * -228 ** -664 **
RaceQPorIntl 948,102 1,302,258 * 466% 403,656 ** 536% 898,602 * 441%
CondCL2 na 7,247 2,945 * 4% 4,302
CondCL3 na 7,557 2,460 ** 3% 5,097
CondCL4 na 18,689 * 7% 5,065 * 7% 13,625 * 7%
CondCL5 na -5,268 3,065 -8,333
CondAL1 na 21,322 * 8% 7,417 * 10% 13,905 * 7%
CondAL5 na 20,088 * 7% 6,935 * 9% 13,153 ** 6%
CondAL4 na 31,547 * 11% 7,669 * 10% 23,888 * 12%
CondAL3 na 49,340 * 18% 11,566 ** 15% 37,774 * 19%
CondAL2 na 84,110 * 30% 13,617 * 18% 70,493 * 35%
StkOvernight na 61,212 * 22% 15,512 * 21% 45,701 ** 22%
StkScheduled na 95,349 * 34% 20,200 * 27% 75,149 * 37%
StkGr3 na 142,312 * 51% 28,519 * 38% 113,793 * 56%
StkGr2 na 210,967 * 76% 48,077 * 64% 162,890 * 80%
StkGr1orMajor na 538,592 * 193% 136,367 * 181% 402,225 * 197%
Purse 0.72 * na na na
DayOpening 40,268 * 41,564 * 15% 9,862 * 13% 31,702 * 16%
DayGoodFri 68,899 * 67,733 * 24% 31,525 * 42% 36,207 * 18%
DayJuly1 110,659 * 110,079 * 39% 39,723 * 53% 70,355 * 34%
BCTC -1,547 1,308 9,034 * 12% -7,726
PURSES MODEL RACE CONDITIONS MODELS
(R²=80) (R²=81) (R²=86) (R²=76)
All Sources HMA Export
Avg Handle = $279,302 Avg Handle = $75,363 Avg Handle = $203,939
*statistical significance at better than 0.01 (99%) level, **statistical significance at better than 0.05 (95%) level,
***statistical significance at better than 0.10 (90%) level
Econometric Models of Wagering on the Woodbine 2011 Thoroughbred Race Product
S. Koch – March 2012
Page 15 of 25
Table 4 continued.
Independent
Variables
DayBigRace 111,281 * 105,795 * 38% 40,254 * 53% 65,541 * 32%
Filly 2,283 3,665 -800 4,465 *** 2%
Age2yo -3,415 -273 -639 365
Furlongs -1,454 -1624 -439 -1185
Maidens -690 -755 -1,274 519
Turf 1,315 682 -1,567 2,250
TurfOff -28,037 * -24,829 * -9% -4,152 ** -6% -20,678 * -10%
ONSired -14,852 * -14,827 * -5% -2,531 * -3% -12,296 * -6%
ForEx -226,119 -242,485 *** -87% -30,833 -273,317 ** -134%
WeatherTemp -1,202 * -1,240 * -0.4% -235 * -0.3% -1,006 * -0.5%
WeatherPrecip 222 187 24 163
WeatherWind -96 -81 -53 ** -0.1% -28
Race2 16,085 * 17,381 * 6% 4,433 * 6% 12,948 * 6%
Race3 32,412 * 33,567 * 12% 8,406 * 11% 25,161 * 12%
Race4 54,208 * 52,252 * 19% 13,781 * 18% 38,471 * 19%
Race5 67,492 * 64,709 * 23% 18,721 * 25% 45,988 * 23%
Race6 70,420 * 67,586 * 24% 19,366 * 26% 48,220 * 24%
Race7 66,266 * 66,699 * 24% 21,141 * 28% 45,557 * 22%
Race8 46,703 * 41,649 * 15% 13,979 * 19% 27,670 * 14%
Race9 62,018 * 58,835 * 21% 17,962 * 24% 40,873 * 20%
Race10 69,749 * 72,547 * 26% 22,583 * 30% 49,964 * 24%
Race11to13 92,871 * 96,118 * 34% 26,911 * 36% 69,208 * 34%
Wednesday -4,788 -5,286 16,223 * 22% -21,509 * -11%
Friday 39,687 * 40,647 * 15% 9,710 * 13% 30,937 * 15%
Saturday 86,976 * 86,944 * 31% 29,769 * 40% 57,174 * 28%
Sunday 54,039 * 54,337 * 19% 30,815 * 41% 23,522 * 12%
Monday 41,483 * 39,708 * 14% 37,052 * 49% 2,656
May 43,254 * 43,233 * 15% 5,054 * 7% 38,179 * 19%
June 72,975 * 72,179 * 26% 13,211 * 18% 58,968 * 29%
July 82,115 * 83,846 * 30% 12,803 * 17% 71,043 * 35%
August 86,201 * 85,619 * 31% 9,117 * 12% 76,502 * 38%
September 76,684 * 77,557 * 28% 3,051 74,506 * 37%
October 26,451 *** 28,841 ** 10% -8,974 * -12% 37,815 * 19%
November 44,695 * 42,547 * 15% -9,562 * -13% 52,109 * 26%
December 56,043 * 55,984 * 20% -4,793 60,776 * 30%
NYminus5 -7,988 -12,526 79 -12,605
NYminus4 -49,707 * -50,454 * -18% -11,283 * -15% -39,172 * -19%
NYminus3 -19,006 *** -18,647 *** -7% -905 -17,742 ** -9%
NYminus2 -23,611 -25,573 -2,502 -23,071
NYminus1 -56,763 * -56,839 * -20% -8,609 *** -11% -48,230 * -24%
NYzero -100,725 * -95,395 * -34% -21,281 * -28% -74,114 * -36%
NYplus1 -60,736 * -68,004 * -24% -10,387 * -14% -57,617 * -28%
NYplus2 -40,439 * -37,848 * -14% -5,224 ** -7% -32,624 * -16%
NYplus3 -29,900 * -27,282 * -10% -4,846 *** -6% -22,436 * -11%
NYplus4 -4,258 -8,134 5,210 -13,344
NYplus5 -31,455 * -32,850 * -12% -2,668 -30,183 * -15%
PURSES MODEL RACE CONDITIONS MODELS
All Sources HMA Export
*statistical significance at better than 0.01 (99%) level, **statistical significance at better than 0.05 (95%) level,
***statistical significance at better than 0.10 (90%) level
Econometric Models of Wagering on the Woodbine 2011 Thoroughbred Race Product
S. Koch – March 2012
Page 16 of 25
Figure 1. Field size exhibits a positive impact on All Sources Handle, holding all other
variables constant at their average (ceteris paribus). Marginal handle gains soften as
the field approaches its maximum size.
Figure 2. Increasing field quality via race conditions brings rewards to All Sources handle,
ceteris paribus. Percentage figures identify All Sources wagering gains relative to
having carded the respective condition rather than a low level claiming field.
6.0%
6.4%
6.7%
7.3%
7.9%
8.6%
9.2%
9.9%
10.5%
11.1%
11.8%
12.4%
3 4 5 6 7 8 9 10 11 12 13 14
N um ber of Betting Interests
AverageAllSourcesHandle
M arginal b enefit to averag e handle of
having ad ded one ad ditional betting interest
0%
192.8%
75.5%
51%
34.1%
21.9%
30.1%
17.7%
11.3%7.2%7.60%6.7%
C
laim
ing
4
C
laim
ing
5A
llow
ance
1A
llow
ance
5A
llow
ance
4A
llow
ance
3A
llow
ance
2
O
vernightStake
Scheduled
Stake
G
rade
III
G
rade
II
G
rade
IorM
ajorR
ace
Race Conditions (Claiming 1, 2, 3 and 5 = 0%)
AverageAllSourcesHandle
Econometric Models of Wagering on the Woodbine 2011 Thoroughbred Race Product
S. Koch – March 2012
Page 17 of 25
Race Events
Woodbine races executed on holidays or other prime dates benefit All Sources handle,
ceteris paribus. The opening weekend of the racemeet in 2011 corresponded to a $41,564 (15%)
boost over the average racedates through the rest of the year. Good Friday and July 1st
(Canada Day
holiday) lift wagering $67,733 (24%) and $110,079 (39%), respectively, over average racedates.
Races executed on the same card as the year’s Grade I and three other major races benefit handle
$105,795 (38%) per race. Finally, on an all-sources basis we find no statistically significant
relationship between handle and races run on a Breeders’ Cup Championship or Triple Crown date.
In our alternate analyses of the HMA and Export handle streams it is remarkable to observe
the differing response to the holiday or special racedates. HMA and Export customers seem to
receive opening weekend with similar enthusiasm as the respective streams boost wagering 13%
and 16%. More sizable percentage variance in customer responses to holidays/events can be found
on Good Friday (42% boost HMA, only 18% for Export), July 1st
(53% HMA, 34% Export) and
undercard races on Woodbine’s Gr I or major racedates (53% HMA, 32% Export). Breeders’ Cup
or Triple Crown dates show a zero response, positive or negative, from Export customers but a 12%
positive response from the HMA. This result seems to bear out that HMA customers are enticed to
wager on Woodbine perhaps as a complementary product on these major industry dates but for the
more removed Export customers Woodbine gets relatively eclipsed thus mitigating any foreign
benefits.
Race Condition Restrictions
The details internal to the conditions of a race that do not necessarily define quality but
rather are just that, conditions of the event, do not seem to have effects on wagering. For all of the
models presented in Table 4 we find the variables Age2yo, Furlongs, Maidens and Turf statistically
insignificant in their isolated relationships with handle. That is, the influence of two-year-old
restricted races, the increasing or decreasing distance of a race and the incidence of events run on
the turf course all are not different than zero in their influences on wagering totals. It seems that
either these variables are non-factors to total wagering decisions or that for each individual
customer’s preference for or against these particulars there is a corresponding customer with a
counter-preference. The filly and mare race restriction returns a likewise statistically insignificant
result for the All Sources and HMA models but is statistically significant in the Export model. We
find that filly and mare restricted races benefit Export handle 2.2%. For the results on the Turf
variable we recommend that the positive average handle impacts of turf races is more likely born
out by the field size control variable as suggested earlier in the ‘Data’ section of this document.
Races originally programmed for the turf course but then removed to the main track due to
track conditions or other factors indeed create a 9% disruption, or $24,829 loss, to All Sources
wagering, ceteris paribus. The home customer (-6%) is slightly more forgiving than is the Export
customer (-10%). This estimate carries out only the losses due to the surface switch as if the field
size were constant. However, an even greater wagering loss from off-the-turf racing of course is
contained in the reduction of field size as illustrated in Figure 1.
All models, consistent with expectations, produce a statistically significant and negative
estimate for the ONSired variable. Collectively, Woodbine customers trim wagering 5% on Ontario
Sired restricted races after having controlled for other important factors. Export customers seem the
harsher critics as they pull back 6% compared to the HMA customer’s more lenient 3% pullback.
Econometric Models of Wagering on the Woodbine 2011 Thoroughbred Race Product
S. Koch – March 2012
Page 18 of 25
Foreign Exchange
The U.S./Canada foreign monetary exchange rate proves relevant to the value of wagering
on the Woodbine races. This variable presents a statistically significant and positive relationship
with All Sources handle. That is, as the U.S. dollar increases in its ability to purchase Canadian
dollars so too does handle increase. This result does not so much suggest that U.S. wagering
increases but that the value of U.S. wagering in Canadian pools increases. Not surprisingly the
foreign exchange rate is statistically insignificant to HMA wagering. Its entire effect is felt in the
Export econometric wagering model. Note that the parameter estimate, due to the construction of
the variable, misleads by a factor of 100. The parameter estimate and the related percentage
relationship should be divided by 100 to reflect the impact of a penny movement in foreign
exchange rather than the implausible $1.00 relationship seen in Table 4. Hence, we determine that a
one-cent increase in the exchange value of the U.S. dollar relates to a 1.3% or $2,733 increase in
Export sources wagering value.
Weather
Ceteris paribus, we find that temperature through the year plays the leading role amongst the
weather variables for increasing wagering. A one degree Celsius gain in temperature relates to a
0.4% improvement in All Sources wagering. Or, we can say that a ten degrees Celsius gain at the
host track pushes up All Sources wagering by 4% or $12,400. It is interesting that on a percentage
basis the Export customer base is more responsive to temperature, 5% per each ten degrees, than is
the HMA customer at 3% per ten degrees. Perhaps an unaccounted for market or seasonal factor
attempts to expose itself herein. The WeatherWind variable shows a zero relationship with handle
in the All Sources and Export models but a HMA wagering loss of 1% for each 10 km/hr increase in
the day’s high windgusts. Finally, a day’s total precipitation, WeatherPrecip, returns statistically
insignificant for all models.
Scheduling of Races
In Figure 3 we map each of the Race# dummy variables for all three wagering streams
across the horizontal with the vertical axis reflecting wagering growth. Race one, being our basis of
comparison, equals a zero impact on growing average wagering. We observe relatively rapid
wagering growth through the early part of the card and reaching a high plateau at races five, six and
seven. Race eight presents a previously unseen scenario where wagering in each of the streams
tumbles. However the late races seem to quickly regain their strength. The show of late race
wagering strength is consistent with racetrack management experience and earlier econometric
analyses. We must note here that our representation of ‘average’ racecard is limiting in its
usefulness to management as different times of day (afternoon or evening scheduled cards), parts of
the week (weekday, weekend) and variations in number of races per card may alternatively impact
wagering flows.
What seems new in our results over previous studies is the weakness at race eight or, viewed
alternately, the relative strength of races four through seven. We propose that the latter mentioned
alternate view is the more correct. Races four through seven have perhaps inherited stature from
Woodbine’s full-year marketing push on the much favoured ‘Early Pick-4’ betting pool. We
additionally identify that races six and seven positively benefit from their position as the most
common races for the ‘Early Pick-4’ and the ‘Late Pick-4’ (always the last 4 races on a card, only
offered when card contains nine or more races) to overlap. This overlap creates a pool doubling
effect on these observations directly boosting the per-race handle for that observation. For example,
Econometric Models of Wagering on the Woodbine 2011 Thoroughbred Race Product
S. Koch – March 2012
Page 19 of 25
we find in the data that the average All Sources ‘Early Pick-4’ pool per race is $21,579 while the
‘Late Pick-4’ averages $13,262 per race so that we can value the average incidence of this pool
doubling at $17,421 (($21,579 + $13,262)/2) or 6.2% of total All Sources handle. The obvious
modeling solution would be a binary variable that equals 1 for observations with overlapping Pick-4
pools and 0 otherwise. However we find this variable to have a very high correlation with the
Race7 (0.63) and less so on Race6 (0.12) race order variables therefore collectively threatening
multicollinearity. We omit the ‘overlap’ variable and instead make a notation in Figure 3 (notice
the ‘**’ on race number six and seven) to indicate the average overlapping Pick-4 pool structural
affect on race six and race seven handle observations.
Finally, in Figure 3 we acknowledge that the incidence of the rolling Pick-3 pools offers a
very small altering effect on the econometric model results for Race2 (notice the ‘*’ on race number
two). Woodbine offers rolling Pick-3’s throughout the card. Referring back to our ‘Data’ section,
we defined Handle as sum of all single-leg pools plus an equal share of any multi-leg pools that
included the respective race. So by this definition there is a modeled disadvantage to the Race2
variable of 2% ($5,472) all sources (or 1.3%, $2,574 for Export and 3.8%, $2,898 HMA) for the
absence of an earlier Pick-3 pool. Referring back to Table 4 we identify that this 2% (or 1.3%
Export and 3.8% HMA) improves the absolute value of Race2. We have therefore mechanically
added this theoretical missing average Pick-3 pool into the Race2 variable as graphed in Figure 3.
Figure 3. Wagering from each source strengthens through race seven (perhaps showing some
relationship to ‘Early Pick-4’ promotion factors) falters at race eight but rallies
through the last race of the average card, ceteris paribus. *Race number two is
corrected for the Pick-3 structural disadvantage. **The rectangle over races six and
seven indicates the possible All Sources range of structural increases due to
overlapping Pick-4 effects.
1 2* 3 4 5 6** 7** 8 9 10 11 to 13
Race Number
AverageHandle
All Sources Export HMA
Econometric Models of Wagering on the Woodbine 2011 Thoroughbred Race Product
S. Koch – March 2012
Page 20 of 25
Handle behaves differently across the various bases of customers on different days of the
week, all else held constant. In Figure 4 we exhibit the isolated benefits and losses to average
wagering for each day of the week and per wagering source. In the first series, on the left of Figure
4, we view All Sources model output with clear wagering maximums for Saturday followed not so
closely by Sundays, Friday and Mondays. We notice that on an All Sources basis that Wednesdays
are not different than Thursdays in their wagering strength.
The HMA customers, analyzed separately in the middle series of Figure 4, show a greater
appreciation for Wednesday cards by wagering 22% stronger than on a Thursday. Saturdays and
Sundays are 40% and 41% better than Thursdays for the HMA. And it is logical that Mondays
receive highest regards from the HMA as these relatively unusual racedates coincide with Canadian
statutory holidays.
The Export customers exhibit less but still statistically significant reaction to the changing
days of the week as we can see in the right-side series of Figure 4. Export customers actually seem
to prefer Thursday afternoon cards over the Wednesday evening cards by a handle margin of 11%.
Export wagering is strongest on Saturdays followed distantly by Fridays and then Sundays. It is
notable that Mondays, coinciding with a holiday for Canadians but not necessarily for Americans or
other nations, shows zero handle benefits relative to Thursdays for the Export bettors.
Having identified that the HMA and Export customers exhibit conflicting preferences for
Wednesdays versus Thursdays we investigate which day earns greater revenues for Woodbine. We
apply after-purse wagering commissions as discussed in the ‘Data’ section of this article (8% HMA
and 3% Export) to the respective Table 4 parameter estimates for Wednesday and Thursday. We
determine that Wednesdays out-earned Thursdays in 2011 by $653 per race: (8% * $16,223 =
$1,298) + (3% * -$21,509 = -$645) = $653. Continuing this course, we rank the days of the week
based upon estimated sum of HMA and Export commissions to find that Saturdays outperform
Sundays by 30%, followed by Fridays, Wednesdays and then Thursdays. Mondays rank behind
Sundays, ahead of Fridays, being mostly advantaged by HMA holiday effects.
The next series of independent variables tests for seasonal business trends across the months
of the racing year. In general we find that April, being the ‘zero’ month by analysis design, was
indeed a relatively weak wagering month. The graph in Figure 5 shows that wagering generally
gained strength through the summer but the fall months of October and November presented
substantial declines. While HMA and Export wagering followed the same pattern of rise and fall
we notice that HMA led Export into the fall trough and that Export recovered into December earlier
than did HMA.
The model output for the New York minutes series of dummy variables confirms our
expectations that, as a group, customers forced to choose will favour New York over the nearby
Woodbine race, all else held constant. We can visualize in Figure 6 that the losses in Export
wagering due to overlapping posttimes outrun the HMA losses on a percentage basis. Next we find
that the worst posttime placement for Woodbine is immediately within the same minute, plus or
minus, as a New York race (NYzero) where handle losses compared to average come to 34% for
All Sources (or 28% HMA, 36% Export). After NYzero we find that the Woodbine races fare
better if slightly after a New York race (NYminus…) rather than immediately before its New York
counterpart (NYplus…). This result is consistent with previous studies executed by Woodbine
management albeit with slightly messier results. For example, we find the output on NYminus4,
NYminus2 and NYplus5 variables do contrast with a priori expectations of improved wagering as
races move away from posttime competitors. We suspect a hidden structural element within the NY
minutes observations is at play but we do not speculate herein what this hidden element might be.
Econometric Models of Wagering on the Woodbine 2011 Thoroughbred Race Product
S. Koch – March 2012
Page 21 of 25
Figure 4. Wagering gains and stalls across the different days of the week. Thursdays serve as
the basement observation by which we compare all other dates on a percentage basis.
Figure 5. Wagering, ceteris paribus, trended strongest through the summer months but hit a
trough in October and November. HMA wagering declines in the fall were relatively
substantial.
-15%
-5%
5%
15%
25%
35%
April May June July August September October November December
PercentageAverageHandleGains/Losses
relativetoApril=0
All Sources Export HMA
0%
22%
15%
13%
15%
31%
40%
28%
19%
41%
12%
14%
49%
0%-11%
ALL SOURCES HMA EXPORT
PercentageAverageHandleGains
relativetoThurdays=0
Wed Fri Sat Sun Mon
Econometric Models of Wagering on the Woodbine 2011 Thoroughbred Race Product
S. Koch – March 2012
Page 22 of 25
Figure 6. Overlapping posttime with New York proves detrimental to wagering on Woodbine
races. Woodbine races that run on top of (NYzero) or just before a New York race
(NYplus) fare worse than their counterparts that run just after a New York race
(NYminus).
CONCLUSIONS
Bettors’ collective preferences drive per-race handle. The more that a race’s numerous
characteristics are collectively appealing then the more will the customers invest. The racetrack
manager must understand these preferences as a requirement to maximize revenue per race and
through the racing season. This unique analysis provides empirical evidence of what per-race
variables play key to the wagering decision, and in what magnitudes, all while isolating the various
impacts from co-mingling factors. Important predictors of All Sources, HMA and Export handle
include field size, quality of field, certain race conditions restrictions, international foreign
exchange factors, weather, and race scheduling decisions ranging from monthly down to the minute.
Field size is not the single most overwhelming predictor of handle amongst this broad
analysis. But within any single racedate, lacking major race events and where dates are inflexible
then field size has again been empirically identified as a primary handle driver. We have also
empirically confirmed that there are decreasing rewards to add horses to a growing field. The
Racing Secretary, adds more value to ‘hustle’ a sixth horse for the five horse field than to exercise
same hustle for an eleventh horse to a ten horse field. That said, adding to either field is a positive
exercise.
-35%
-25%
-15%
-5%
N
Y
m
inus5
N
Ym
inus4
N
Y
m
inus3
N
Y
m
inus2
N
Y
m
inus1
N
yzero
N
Yplus1
N
Y
plus2
N
Y
plus3
N
Yplus4
N
Y
plus5
PercentageAverageHandleLosses
All Sources Export HMA
Econometric Models of Wagering on the Woodbine 2011 Thoroughbred Race Product
S. Koch – March 2012
Page 23 of 25
There are clear disadvantages to handle from carding low quality race class conditions.
Alternatively, the racetrack that can maximize the average quality of its fields will benefit, perhaps
substantially. We prefer the model specification where we distill actual race conditions into a series
of dummy variables. This model provides a more detailed picture with which to communicate to
the horseracing industry the relationships of race conditions and wagering. Future analyses may
consider a more extensive approach to this same design. The Purses specification, on the other
hand, proves to correlate nicely with race conditions and seems a relevant proxy for race conditions
for future analysts lacking specific race conditions data. We must repeat our earlier warning though
– the purses approach may go awry if misapplied to data ranging across racetracks or years where
like race conditions can run for differing purses or ranges of purse.
Holidays and other known prime racedates serve on average as an opportunity for increased
handle and should be welcomed in any racedates planning exercise. Opening weekend, Good
Friday, and July 1st
all relate to handle boosts for all wagering streams. There is a similar effect on
Monday (statutory holiday) racecards as discussed in the Race Scheduling section of this article.
We find that industry events such as Breeders’ Cup Championship and Triple Crown racedates do
spur HMA customers’ wagering but exhibits a zero effect from our Export markets. Finally, we
find that undercard races on Woodbine’s five major race event dates provide a substantial handle
generating opportunity. This unsurprising result does imply that these opportunities should be
maximized by the racetrack.
Our model outputs show that several restrictions internal to the conditions of a race show no
statistical, isolated relationship with wagering. The industry needs not therefore overthink two-
year-old, maidens and the incidence of turf as a strategic pursuit to maximize wagering. These
variables imprint on wagering ultimately through field size as they, at their root, exist for the Racing
Secretary to maximize horse supply as a racecard input. Once carded, however, turf races later
removed to the main track indeed diminish handle. This off-the-turf relationship with wagering
likely relates to the customer ‘disservice’ aspects of the late change. Filly and mare restrictions
have a curious positive relationship with Export wagering but this relationship gets lost from an All
Sources and HMA perspective.
Ontario-sired race restrictions exhibit 5% wagering pool losses. This economic
development project likely provides useful benefits to the supply side of the industry but negatively
relates to product demand, particularly for Export wagering customers.
Foreign exchange rates inflict gains/losses on the value of Export wagering in the Woodbine
pools. The incidence of strong Canadian dollars actually serves detriment on Export revenues to the
racetrack.
Weather provides a most uncontrollable impact on handle. The positive relationship
between handle and temperature perhaps bears some seasonal relationships but there remains intra-
day relevance to this factor as well. Days exhibiting high wind gusts bring 10% wagering losses per
each 10 km/hr to the home market customers but those gusts are not felt by the Export customers.
Careful scheduling of races can profit the diligent racetrack. Within a racecard we find that
wagering increases from the early races and through the ‘Early Pick-4’ (races four through seven)
but slows at race eight. After the eighth race wagering returns to earlier strength and gains through
the end of the card. We recommend that the eighth race slowdown likely relates more to strength in
the ‘Early Pick-4’ due to related marketing initiatives. We do not confuse the significant wagering
uptick at races 11 to 13 to completely reflect a last race upsurge. Rather the rare incidences of races
11 to 13 tend to complement major race event dates which may bias the estimate on this variable. A
downfall to this analysis lies in the equal treatment of each day of the week. Future projects include
Econometric Models of Wagering on the Woodbine 2011 Thoroughbred Race Product
S. Koch – March 2012
Page 24 of 25
limiting the data to individual days of the week to test for differences in racecard progression on
Wednesday night cards or maybe Thursday/Friday late-afternoon cards versus other days’ 1pm
cards.
Across the days of the week we find differences in wagering strength depending on the
market source of the handle. Weekend racing clearly offers the maximum opportunities for
Woodbine across all handle streams. HMA customers prefer Wednesdays over Thursdays while the
Export punishes Wednesdays relative to Thursdays. We apply racetrack commission rates to the
respective parameter estimates to identify that Saturdays are the strongest revenues earning
racecards followed by Sundays, Friday, Wednesdays and then Thursdays. Monday racecards rank
behind Sundays, ahead of Fridays, being mostly advantaged by HMA holiday effects.
The general business gains and declines observed throughout year 2011 are born out in the
analysis through the series of months’ dummy variables. The market showed built up relative
strength by July through September and receded in October and November. On a percentage basis
we find the fall-time wagering recession for Export to have been slower and less dramatic than the
HMA experience. Based upon this single year analysis we do not conclude optimal racing months
for future planning purposes. Applying this analysis to race observations across several years
would abet this sort of decision-making.
Woodbine’s longtime obsession with avoiding posttime overlaps with competing racing
products, New York in particular, proves relevant in the NY minutes series of variables. Recent
years have seen Woodbine reach high success with this complicated initiative thus limiting the
regular incidence of observations for this test. We suspect this limitation of incidence has
introduced some structural oddities to the data thus inviting the awkward results on the NYminus4
and NYplus5. Nonetheless, the pattern holds throughout that Woodbine is correct to avoid
posttimes overlap and should prefer to run its race just after rather than just before a competing
product.
REFERENCES
Chezum, B. and B. Wimmer. “Evidence of Adverse Selection from Thoroughbred Wagering.”
Southern Economic Journal. 66 (2000, 3):700-714.
DeGennaro, R. (1989) The Determinants of Wagering Behavior, Managerial and Decision
Economics, 10, 221-28.
Koch, Stephen I., “Estimating Bettors’ Demands and Preferences for the Woodbine Racing
Product.” Woodbine Entertainment Group. 21, August, 2003.
Koch, Stephen I., “Estimating Bettors Preferences for the Woodbine Thoroughbred Product: An
Alternative Specification (in brief).” Woodbine Entertainment Group. 10, September, 2003.
Econometric Models of Wagering on the Woodbine 2011 Thoroughbred Race Product
S. Koch – March 2012
Page 25 of 25
Koch, Stephen I. , “Separate Estimations of WEG and Non-WEG Off-Track Wagering Patterns On
the Woodbine Thoroughbred Product (brief).” Woodbine Entertainment Group. 23, September,
2003.
Koch, Stephen I., “Woodbine Live Standardbred Product – Hedonic Handle Model.” Woodbine
Entertainment Group. 29, October, 2003.
Koch, Stephen I., “Estimating Wagering Patterns For the 2003 Woodbine Thoroughbred Product
(summary)” Woodbine Entertainment Group. 21, November, 2003.
Koch, Stephen I., “A Hedonic Model of All-Sources, Single-Leg Wagering on the Woodbine 2009
Standardbred Races.” Woodbine Entertainment Group. 11, July, 2010.
Koch, Stephen I., “Wednesday night posttimes.” Woodbine Entertainment Group, internal memo.
27, August, 2011.
Koch, Stephen I., “Woodbine Live Thoroughbred – Race Scheduling vs NYRA”. Woodbine
Entertainment Group, internal memo. 5, September, 2011.
Ray, Margaret., “An Economic Analysis of Pari-mutuel Race Competitiveness.” University of
Arizona, Racetrack Industry Program. http://www.ua-
rtip.org/industry/research/economic_analysis_pari.pdf
Ray, Margaret. “Determinants of Simulcast Wagering: The Demand for Harness and Thoroughbred
Horse Races.” University of Arizona, Racetrack Industry Program. http://www.ua-
rtip.org/industry/research/simulcast_wagering.pdf
Ray, Margaret. “Taking Handle into Account: An Economic Analysis of Account Betting.”
University of Arizona, Racetrack Industry Program. http://www.ua-
rtip.org/industry/research/economic_analysis_account.pdf
Ray, Margaret., “What Are the Odds You’ll Bet On a Race? Determinants of wagering demand at a
Thoroughbred Racetrack.” University of Arizona, Racetrack Industry Program. http://www.ua-
rtip.org/industry/research/odds.pdf
CONTACT THE AUTHOR:
Stephen Koch
Vice President – Thoroughbred Racing
Woodbine Entertainment Group
SKoch@WoodbineEntertainment.com
888-675-7223 ext. 2652

Contenu connexe

En vedette

En vedette (11)

Econometric Models of All Sources, HMA and Export Wagering on the Woodbine 2...
Econometric Models of All Sources, HMA and Export Wagering on the  Woodbine 2...Econometric Models of All Sources, HMA and Export Wagering on the  Woodbine 2...
Econometric Models of All Sources, HMA and Export Wagering on the Woodbine 2...
 
Panelist at 2015 Global Symposium on Racing & Gaming : "45 Ideas in 45 Minutes"
Panelist at 2015 Global Symposium on Racing & Gaming : "45 Ideas in 45 Minutes"Panelist at 2015 Global Symposium on Racing & Gaming : "45 Ideas in 45 Minutes"
Panelist at 2015 Global Symposium on Racing & Gaming : "45 Ideas in 45 Minutes"
 
Call For Cooperation As Summit Opens
Call For Cooperation As Summit OpensCall For Cooperation As Summit Opens
Call For Cooperation As Summit Opens
 
Safety & Integrity Alliance at West Virginia Racing Commission - August 17 2016
Safety & Integrity Alliance at West Virginia Racing Commission - August 17 2016Safety & Integrity Alliance at West Virginia Racing Commission - August 17 2016
Safety & Integrity Alliance at West Virginia Racing Commission - August 17 2016
 
S. Koch presentation endorsing NTRA Safety & Integrity Alliance at December 2...
S. Koch presentation endorsing NTRA Safety & Integrity Alliance at December 2...S. Koch presentation endorsing NTRA Safety & Integrity Alliance at December 2...
S. Koch presentation endorsing NTRA Safety & Integrity Alliance at December 2...
 
Woodbine Thoroughbred Main Track - Dirt versus Synthetic Surface Decision Ana...
Woodbine Thoroughbred Main Track - Dirt versus Synthetic Surface Decision Ana...Woodbine Thoroughbred Main Track - Dirt versus Synthetic Surface Decision Ana...
Woodbine Thoroughbred Main Track - Dirt versus Synthetic Surface Decision Ana...
 
NTRA Safety & Integrity Alliance Updates Code Of Standards
NTRA Safety & Integrity Alliance Updates Code Of StandardsNTRA Safety & Integrity Alliance Updates Code Of Standards
NTRA Safety & Integrity Alliance Updates Code Of Standards
 
2016 Racetrack Superintendents Conference - Reviewing the Woodbine Business C...
2016 Racetrack Superintendents Conference - Reviewing the Woodbine Business C...2016 Racetrack Superintendents Conference - Reviewing the Woodbine Business C...
2016 Racetrack Superintendents Conference - Reviewing the Woodbine Business C...
 
Steve Koch - U of Arizona Global Symposium on Racing & Gaming - field size - ...
Steve Koch - U of Arizona Global Symposium on Racing & Gaming - field size - ...Steve Koch - U of Arizona Global Symposium on Racing & Gaming - field size - ...
Steve Koch - U of Arizona Global Symposium on Racing & Gaming - field size - ...
 
36 HOURS WITH THE NTRA SAFETY & INTEGRITY ALLIANCE
36 HOURS WITH THE NTRA SAFETY & INTEGRITY ALLIANCE36 HOURS WITH THE NTRA SAFETY & INTEGRITY ALLIANCE
36 HOURS WITH THE NTRA SAFETY & INTEGRITY ALLIANCE
 
Selecting an Official Testing Laboratory: Value is Not the Low-Cost Option
Selecting an Official Testing Laboratory: Value is Not the Low-Cost OptionSelecting an Official Testing Laboratory: Value is Not the Low-Cost Option
Selecting an Official Testing Laboratory: Value is Not the Low-Cost Option
 

Similaire à Econometric Models of All Sources, HMA and Export Wagering on the Woodbine 2011 Thoroughbred Race Product

Marginal Efficiency Of Investment(Mei) Revised Feb 2011
Marginal Efficiency Of Investment(Mei) Revised Feb 2011Marginal Efficiency Of Investment(Mei) Revised Feb 2011
Marginal Efficiency Of Investment(Mei) Revised Feb 2011
Gary Crosbie
 
Budget Analysis UOAD
Budget Analysis UOADBudget Analysis UOAD
Budget Analysis UOAD
Scott Morlan
 
1. Nicks Enchiladas Incorporated has preferred stock outstand.docx
1. Nicks Enchiladas Incorporated has preferred stock outstand.docx1. Nicks Enchiladas Incorporated has preferred stock outstand.docx
1. Nicks Enchiladas Incorporated has preferred stock outstand.docx
jackiewalcutt
 
Oasis Petroleum Inc. Wenjun Wu
Oasis Petroleum Inc. Wenjun WuOasis Petroleum Inc. Wenjun Wu
Oasis Petroleum Inc. Wenjun Wu
Wu Wenjun
 
Jazz-Pharmaceuticals-Investment-Banking-Pitch-Book.pptx
Jazz-Pharmaceuticals-Investment-Banking-Pitch-Book.pptxJazz-Pharmaceuticals-Investment-Banking-Pitch-Book.pptx
Jazz-Pharmaceuticals-Investment-Banking-Pitch-Book.pptx
ssuser31ae74
 

Similaire à Econometric Models of All Sources, HMA and Export Wagering on the Woodbine 2011 Thoroughbred Race Product (20)

Weekender - Commodity Play.pdf
Weekender - Commodity Play.pdfWeekender - Commodity Play.pdf
Weekender - Commodity Play.pdf
 
Marginal Efficiency Of Investment(Mei) Revised Feb 2011
Marginal Efficiency Of Investment(Mei) Revised Feb 2011Marginal Efficiency Of Investment(Mei) Revised Feb 2011
Marginal Efficiency Of Investment(Mei) Revised Feb 2011
 
20171103 sauc q3 2017 teleconference slides final
20171103 sauc q3 2017 teleconference slides final20171103 sauc q3 2017 teleconference slides final
20171103 sauc q3 2017 teleconference slides final
 
BT Funds Management - bigger, better, bolder BT - 20130501
BT Funds Management - bigger, better, bolder BT - 20130501BT Funds Management - bigger, better, bolder BT - 20130501
BT Funds Management - bigger, better, bolder BT - 20130501
 
BTT - bigger better bolder BT - 20130501
BTT -  bigger better bolder BT - 20130501BTT -  bigger better bolder BT - 20130501
BTT - bigger better bolder BT - 20130501
 
Budget Analysis UOAD
Budget Analysis UOADBudget Analysis UOAD
Budget Analysis UOAD
 
Choosing the right multiple
Choosing the right multiple Choosing the right multiple
Choosing the right multiple
 
6. risk and return
6. risk and return6. risk and return
6. risk and return
 
Game Theory & Logistic Regression: Monetizing Trust in Contracts Through Bina...
Game Theory & Logistic Regression: Monetizing Trust in Contracts Through Bina...Game Theory & Logistic Regression: Monetizing Trust in Contracts Through Bina...
Game Theory & Logistic Regression: Monetizing Trust in Contracts Through Bina...
 
Stock Pitch For Mailing Shipping Services PowerPoint Presentation PPT Slide T...
Stock Pitch For Mailing Shipping Services PowerPoint Presentation PPT Slide T...Stock Pitch For Mailing Shipping Services PowerPoint Presentation PPT Slide T...
Stock Pitch For Mailing Shipping Services PowerPoint Presentation PPT Slide T...
 
1. Nicks Enchiladas Incorporated has preferred stock outstand.docx
1. Nicks Enchiladas Incorporated has preferred stock outstand.docx1. Nicks Enchiladas Incorporated has preferred stock outstand.docx
1. Nicks Enchiladas Incorporated has preferred stock outstand.docx
 
Hybrid car sales (Ford case )
Hybrid car sales (Ford case )Hybrid car sales (Ford case )
Hybrid car sales (Ford case )
 
Dividends
DividendsDividends
Dividends
 
Tutorial 8 Solutions.docx
Tutorial 8 Solutions.docxTutorial 8 Solutions.docx
Tutorial 8 Solutions.docx
 
Oasis Petroleum Inc. Wenjun Wu
Oasis Petroleum Inc. Wenjun WuOasis Petroleum Inc. Wenjun Wu
Oasis Petroleum Inc. Wenjun Wu
 
Accenture Spend Trends Report Q3 2014
Accenture Spend Trends Report Q3 2014Accenture Spend Trends Report Q3 2014
Accenture Spend Trends Report Q3 2014
 
402 project 1
402 project 1 402 project 1
402 project 1
 
Tricumen / Capital markets revenues and banks valuations 210714
Tricumen / Capital markets revenues and banks valuations 210714Tricumen / Capital markets revenues and banks valuations 210714
Tricumen / Capital markets revenues and banks valuations 210714
 
Jazz-Pharmaceuticals-Investment-Banking-Pitch-Book.pptx
Jazz-Pharmaceuticals-Investment-Banking-Pitch-Book.pptxJazz-Pharmaceuticals-Investment-Banking-Pitch-Book.pptx
Jazz-Pharmaceuticals-Investment-Banking-Pitch-Book.pptx
 
the Walt Disney
the Walt Disneythe Walt Disney
the Walt Disney
 

Plus de Stephen Koch

Plus de Stephen Koch (9)

Modeling the Determinants of Standardbred Handle: Standardbred Racing at Wood...
Modeling the Determinants of Standardbred Handle: Standardbred Racing at Wood...Modeling the Determinants of Standardbred Handle: Standardbred Racing at Wood...
Modeling the Determinants of Standardbred Handle: Standardbred Racing at Wood...
 
Steve Koch, Equestricon 2018
Steve Koch, Equestricon 2018Steve Koch, Equestricon 2018
Steve Koch, Equestricon 2018
 
Modeling the Determinants of Handle: An Analysis of Woodbine Thoroughbred Rac...
Modeling the Determinants of Handle: An Analysis of Woodbine Thoroughbred Rac...Modeling the Determinants of Handle: An Analysis of Woodbine Thoroughbred Rac...
Modeling the Determinants of Handle: An Analysis of Woodbine Thoroughbred Rac...
 
Test Barn Chain of Custody and Procedures: Considerations and Recommendations
Test Barn Chain of Custody and Procedures: Considerations and RecommendationsTest Barn Chain of Custody and Procedures: Considerations and Recommendations
Test Barn Chain of Custody and Procedures: Considerations and Recommendations
 
Kentucky Thoroughbred Farm Managers Club (www.ktfmc.org) May 25 2016
Kentucky Thoroughbred Farm Managers Club (www.ktfmc.org) May 25 2016Kentucky Thoroughbred Farm Managers Club (www.ktfmc.org) May 25 2016
Kentucky Thoroughbred Farm Managers Club (www.ktfmc.org) May 25 2016
 
Symposium: Panel Gives 45 Ideas in 45 Minutes
Symposium: Panel Gives 45 Ideas in 45 MinutesSymposium: Panel Gives 45 Ideas in 45 Minutes
Symposium: Panel Gives 45 Ideas in 45 Minutes
 
The real story behind Woodbine's switch to Tapeta
The real story behind Woodbine's switch to TapetaThe real story behind Woodbine's switch to Tapeta
The real story behind Woodbine's switch to Tapeta
 
By the numbers - Woodbine wagering analysis shows there's value in data
By the numbers - Woodbine wagering analysis shows there's value in dataBy the numbers - Woodbine wagering analysis shows there's value in data
By the numbers - Woodbine wagering analysis shows there's value in data
 
The North American track setting a safety example
The North American track setting a safety exampleThe North American track setting a safety example
The North American track setting a safety example
 

Dernier

Abortion pills in Doha Qatar (+966572737505 ! Get Cytotec
Abortion pills in Doha Qatar (+966572737505 ! Get CytotecAbortion pills in Doha Qatar (+966572737505 ! Get Cytotec
Abortion pills in Doha Qatar (+966572737505 ! Get Cytotec
Abortion pills in Riyadh +966572737505 get cytotec
 
Escorts Service Kumaraswamy Layout ☎ 7737669865☎ Book Your One night Stand (B...
Escorts Service Kumaraswamy Layout ☎ 7737669865☎ Book Your One night Stand (B...Escorts Service Kumaraswamy Layout ☎ 7737669865☎ Book Your One night Stand (B...
Escorts Service Kumaraswamy Layout ☎ 7737669865☎ Book Your One night Stand (B...
amitlee9823
 
Call Girls Begur Just Call 👗 7737669865 👗 Top Class Call Girl Service Bangalore
Call Girls Begur Just Call 👗 7737669865 👗 Top Class Call Girl Service BangaloreCall Girls Begur Just Call 👗 7737669865 👗 Top Class Call Girl Service Bangalore
Call Girls Begur Just Call 👗 7737669865 👗 Top Class Call Girl Service Bangalore
amitlee9823
 
Probability Grade 10 Third Quarter Lessons
Probability Grade 10 Third Quarter LessonsProbability Grade 10 Third Quarter Lessons
Probability Grade 10 Third Quarter Lessons
JoseMangaJr1
 
Call Girls Hsr Layout Just Call 👗 7737669865 👗 Top Class Call Girl Service Ba...
Call Girls Hsr Layout Just Call 👗 7737669865 👗 Top Class Call Girl Service Ba...Call Girls Hsr Layout Just Call 👗 7737669865 👗 Top Class Call Girl Service Ba...
Call Girls Hsr Layout Just Call 👗 7737669865 👗 Top Class Call Girl Service Ba...
amitlee9823
 
Vip Mumbai Call Girls Marol Naka Call On 9920725232 With Body to body massage...
Vip Mumbai Call Girls Marol Naka Call On 9920725232 With Body to body massage...Vip Mumbai Call Girls Marol Naka Call On 9920725232 With Body to body massage...
Vip Mumbai Call Girls Marol Naka Call On 9920725232 With Body to body massage...
amitlee9823
 
Call Girls Indiranagar Just Call 👗 7737669865 👗 Top Class Call Girl Service B...
Call Girls Indiranagar Just Call 👗 7737669865 👗 Top Class Call Girl Service B...Call Girls Indiranagar Just Call 👗 7737669865 👗 Top Class Call Girl Service B...
Call Girls Indiranagar Just Call 👗 7737669865 👗 Top Class Call Girl Service B...
amitlee9823
 
Call Girls Jalahalli Just Call 👗 7737669865 👗 Top Class Call Girl Service Ban...
Call Girls Jalahalli Just Call 👗 7737669865 👗 Top Class Call Girl Service Ban...Call Girls Jalahalli Just Call 👗 7737669865 👗 Top Class Call Girl Service Ban...
Call Girls Jalahalli Just Call 👗 7737669865 👗 Top Class Call Girl Service Ban...
amitlee9823
 

Dernier (20)

Mature dropshipping via API with DroFx.pptx
Mature dropshipping via API with DroFx.pptxMature dropshipping via API with DroFx.pptx
Mature dropshipping via API with DroFx.pptx
 
Abortion pills in Doha Qatar (+966572737505 ! Get Cytotec
Abortion pills in Doha Qatar (+966572737505 ! Get CytotecAbortion pills in Doha Qatar (+966572737505 ! Get Cytotec
Abortion pills in Doha Qatar (+966572737505 ! Get Cytotec
 
Escorts Service Kumaraswamy Layout ☎ 7737669865☎ Book Your One night Stand (B...
Escorts Service Kumaraswamy Layout ☎ 7737669865☎ Book Your One night Stand (B...Escorts Service Kumaraswamy Layout ☎ 7737669865☎ Book Your One night Stand (B...
Escorts Service Kumaraswamy Layout ☎ 7737669865☎ Book Your One night Stand (B...
 
Carero dropshipping via API with DroFx.pptx
Carero dropshipping via API with DroFx.pptxCarero dropshipping via API with DroFx.pptx
Carero dropshipping via API with DroFx.pptx
 
Call Girls Begur Just Call 👗 7737669865 👗 Top Class Call Girl Service Bangalore
Call Girls Begur Just Call 👗 7737669865 👗 Top Class Call Girl Service BangaloreCall Girls Begur Just Call 👗 7737669865 👗 Top Class Call Girl Service Bangalore
Call Girls Begur Just Call 👗 7737669865 👗 Top Class Call Girl Service Bangalore
 
Probability Grade 10 Third Quarter Lessons
Probability Grade 10 Third Quarter LessonsProbability Grade 10 Third Quarter Lessons
Probability Grade 10 Third Quarter Lessons
 
Call Girls Hsr Layout Just Call 👗 7737669865 👗 Top Class Call Girl Service Ba...
Call Girls Hsr Layout Just Call 👗 7737669865 👗 Top Class Call Girl Service Ba...Call Girls Hsr Layout Just Call 👗 7737669865 👗 Top Class Call Girl Service Ba...
Call Girls Hsr Layout Just Call 👗 7737669865 👗 Top Class Call Girl Service Ba...
 
Ravak dropshipping via API with DroFx.pptx
Ravak dropshipping via API with DroFx.pptxRavak dropshipping via API with DroFx.pptx
Ravak dropshipping via API with DroFx.pptx
 
BabyOno dropshipping via API with DroFx.pptx
BabyOno dropshipping via API with DroFx.pptxBabyOno dropshipping via API with DroFx.pptx
BabyOno dropshipping via API with DroFx.pptx
 
Edukaciniai dropshipping via API with DroFx
Edukaciniai dropshipping via API with DroFxEdukaciniai dropshipping via API with DroFx
Edukaciniai dropshipping via API with DroFx
 
Anomaly detection and data imputation within time series
Anomaly detection and data imputation within time seriesAnomaly detection and data imputation within time series
Anomaly detection and data imputation within time series
 
Predicting Loan Approval: A Data Science Project
Predicting Loan Approval: A Data Science ProjectPredicting Loan Approval: A Data Science Project
Predicting Loan Approval: A Data Science Project
 
CebaBaby dropshipping via API with DroFX.pptx
CebaBaby dropshipping via API with DroFX.pptxCebaBaby dropshipping via API with DroFX.pptx
CebaBaby dropshipping via API with DroFX.pptx
 
Vip Mumbai Call Girls Marol Naka Call On 9920725232 With Body to body massage...
Vip Mumbai Call Girls Marol Naka Call On 9920725232 With Body to body massage...Vip Mumbai Call Girls Marol Naka Call On 9920725232 With Body to body massage...
Vip Mumbai Call Girls Marol Naka Call On 9920725232 With Body to body massage...
 
BigBuy dropshipping via API with DroFx.pptx
BigBuy dropshipping via API with DroFx.pptxBigBuy dropshipping via API with DroFx.pptx
BigBuy dropshipping via API with DroFx.pptx
 
Call Girls Indiranagar Just Call 👗 7737669865 👗 Top Class Call Girl Service B...
Call Girls Indiranagar Just Call 👗 7737669865 👗 Top Class Call Girl Service B...Call Girls Indiranagar Just Call 👗 7737669865 👗 Top Class Call Girl Service B...
Call Girls Indiranagar Just Call 👗 7737669865 👗 Top Class Call Girl Service B...
 
(NEHA) Call Girls Katra Call Now 8617697112 Katra Escorts 24x7
(NEHA) Call Girls Katra Call Now 8617697112 Katra Escorts 24x7(NEHA) Call Girls Katra Call Now 8617697112 Katra Escorts 24x7
(NEHA) Call Girls Katra Call Now 8617697112 Katra Escorts 24x7
 
BDSM⚡Call Girls in Mandawali Delhi >༒8448380779 Escort Service
BDSM⚡Call Girls in Mandawali Delhi >༒8448380779 Escort ServiceBDSM⚡Call Girls in Mandawali Delhi >༒8448380779 Escort Service
BDSM⚡Call Girls in Mandawali Delhi >༒8448380779 Escort Service
 
Call Girls Jalahalli Just Call 👗 7737669865 👗 Top Class Call Girl Service Ban...
Call Girls Jalahalli Just Call 👗 7737669865 👗 Top Class Call Girl Service Ban...Call Girls Jalahalli Just Call 👗 7737669865 👗 Top Class Call Girl Service Ban...
Call Girls Jalahalli Just Call 👗 7737669865 👗 Top Class Call Girl Service Ban...
 
Invezz.com - Grow your wealth with trading signals
Invezz.com - Grow your wealth with trading signalsInvezz.com - Grow your wealth with trading signals
Invezz.com - Grow your wealth with trading signals
 

Econometric Models of All Sources, HMA and Export Wagering on the Woodbine 2011 Thoroughbred Race Product

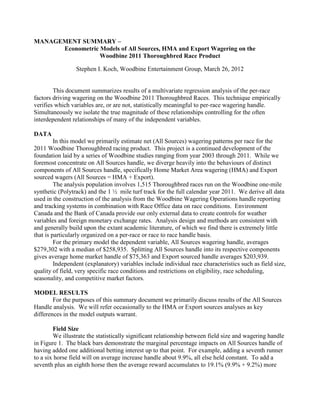
  • 1. MANAGEMENT SUMMARY – Econometric Models of All Sources, HMA and Export Wagering on the Woodbine 2011 Thoroughbred Race Product Stephen I. Koch, Woodbine Entertainment Group, March 26, 2012 This document summarizes results of a multivariate regression analysis of the per-race factors driving wagering on the Woodbine 2011 Thoroughbred Races. This technique empirically verifies which variables are, or are not, statistically meaningful to per-race wagering handle. Simultaneously we isolate the true magnitude of these relationships controlling for the often interdependent relationships of many of the independent variables. DATA In this model we primarily estimate net (All Sources) wagering patterns per race for the 2011 Woodbine Thoroughbred racing product. This project is a continued development of the foundation laid by a series of Woodbine studies ranging from year 2003 through 2011. While we foremost concentrate on All Sources handle, we diverge heavily into the behaviours of distinct components of All Sources handle, specifically Home Market Area wagering (HMA) and Export sourced wagers (All Sources = HMA + Export). The analysis population involves 1,515 Thoroughbred races run on the Woodbine one-mile synthetic (Polytrack) and the 1 ½ mile turf track for the full calendar year 2011. We derive all data used in the construction of the analysis from the Woodbine Wagering Operations handle reporting and tracking systems in combination with Race Office data on race conditions. Environment Canada and the Bank of Canada provide our only external data to create controls for weather variables and foreign monetary exchange rates. Analysis design and methods are consistent with and generally build upon the extant academic literature, of which we find there is extremely little that is particularly organized on a per-race or race to race handle basis. For the primary model the dependent variable, All Sources wagering handle, averages $279,302 with a median of $258,935. Splitting All Sources handle into its respective components gives average home market handle of $75,363 and Export sourced handle averages $203,939. Independent (explanatory) variables include individual race characteristics such as field size, quality of field, very specific race conditions and restrictions on eligibility, race scheduling, seasonality, and competitive market factors. MODEL RESULTS For the purposes of this summary document we primarily discuss results of the All Sources Handle analysis. We will refer occasionally to the HMA or Export sources analyses as key differences in the model outputs warrant. Field Size We illustrate the statistically significant relationship between field size and wagering handle in Figure 1. The black bars demonstrate the marginal percentage impacts on All Sources handle of having added one additional betting interest up to that point. For example, adding a seventh runner to a six horse field will on average increase handle about 9.9%, all else held constant. To add a seventh plus an eighth horse then the average reward accumulates to 19.1% (9.9% + 9.2%) more
  • 2. SUMMARY – Econometric Models of Wagering on the Woodbine 2011 Thoroughbred Race Product S. Koch – March 2012 Page 2 of 7 than handle would have been on the six horse field. Notice that the isolated percentage impacts decrease as we approach the normal maximum field size of 14. Figure 1. Field size exhibits a positive impact on All Sources Handle, holding all other variables constant at their average. Marginal handle gains soften as the field approaches its maximum size. Quality of Field Wagering gains strength in relation to increasing quality of race fields. However, at the lower claiming ranks (any Claiming up to $32k) we find no statistical handle growth. We do identify increasing wagering gains as quality of field increases through the Allowance 1, the Allowance 5 through 2 conditions and then the Stake races. We illustrate these All Sources wagering rewards to quality fields in Figure 2. The percentage data labels in this figure reflect the isolated percent wagering increase corresponding to the respective race condition versus having carded a low-end claiming event. For example, an Allowance 4, on average and all else held constant, yields an 11.3% increase in wagering over having run a $32,000 or lesser claiming event. Race Events Woodbine races executed on holidays or other prime dates benefit All Sources handle. The opening weekend of the racemeet in 2011 corresponded to a 15% boost over the average racedates through the rest of the year. Good Friday and July 1st (Canada Day holiday) lift per-race wagering 24% and 39%, respectively, over average racedates. Races executed on the same card as the year’s Grade I and three other major races benefit handle 38% per race. Finally, on an all-sources basis we find no statistically significant relationship between handle and races run on a Breeders’ Cup Championship or Triple Crown date. 12.4% 11.8% 11.1% 10.5% 9.9% 9.2% 8.6% 7.9% 7.3% 6.7% 6.4% 6.0% 3 4 5 6 7 8 9 10 11 12 13 14 N um ber of Betting Interests AverageAllSourcesHandle M arginal benefit to average handle of having added one additional betting interest
  • 3. SUMMARY – Econometric Models of Wagering on the Woodbine 2011 Thoroughbred Race Product S. Koch – March 2012 Page 3 of 7 Subdividing the All Sources into HMA and Export - both customer groups seem to receive opening weekend with similar enthusiasm as the respective streams boost wagering 13% and 16%. More sizable percentage variance in customer responses to holidays/events can be found on Good Friday (42% boost HMA, only 18% for Export), July 1st (53% HMA, 34% Export) and undercard races on Woodbine’s Gr I or major racedates (53% HMA, 32% Export). Breeders’ Cup or Triple Crown dates show a zero response, positive or negative, from Export customers but a 12% positive response from the HMA. This result seems to bear out that HMA customers are enticed to wager on Woodbine perhaps as a complementary product on these major industry dates but for the more removed Export customers Woodbine gets relatively eclipsed thus mitigating any foreign benefits. Figure 2. Increasing field quality via race conditions brings rewards to All Sources handle, ceteris paribus. Percentage figures identify All Sources wagering gains relative to having carded the respective condition rather than a low level claiming field. Race Condition Restrictions The details internal to the conditions of a race do not seem to have effects on per-race wagering. We find the incidence of two-year-old, distance and turf restrictions to have zero statistical relationship with net handle. The industry needs not therefore overthink these restrictions as a strategic pursuit to grow wagering. For the results on the Turf variable we recommend that the positive average handle impacts of turf races is more likely born out by field size as reported in Figure 1. Filly and mare restricted races do have a 2% relationship with Export sourced handle growth but this effect gets lost from an All Sources or HMA standpoint. Off-the-turf races create a 9% disruption to All Sources wagering. The home customer is slightly more forgiving (-6%) than is the Export customer (-10%). This estimate carries out only the losses due to the surface switch as if the field size were constant. However, an even greater 0% 192.8% 75.5% 51% 34.1% 21.9% 30.1% 17.7% 11.3%7.2%7.60%6.7% C laim ing 4 C laim ing 5A llow ance 1A llow ance 5A llow ance 4A llow ance 3A llow ance 2 O vernightStake Scheduled Stake G rade III G rade II G rade IorM ajorR ace Race Conditions (Claiming 1, 2, 3 and 5 = 0%) AverageAllSourcesHandle
  • 4. SUMMARY – Econometric Models of Wagering on the Woodbine 2011 Thoroughbred Race Product S. Koch – March 2012 Page 4 of 7 wagering loss from off-the-turf racing of course is contained in the reduction of field size as illustrated in Figure 1. Collectively, Woodbine customers trim wagering 5% on Ontario Sired restricted races after having controlled for other important factors such as field size or race conditions. Export customers seem the harsher critics as they pull back 6% compared to the HMA customer’s more lenient 3% pullback. Foreign Exchange As the U.S. dollar increases in its ability to purchase Canadian dollars so too does handle increase. This result does not so much suggest that U.S. wagering increases but that the value of U.S. wagering in Canadian pools increases. Not surprisingly the foreign exchange rate is statistically insignificant to HMA wagering. Its entire effect is felt in the Export base. We estimate that a 1 penny increase in the exchange value of the U.S. dollar relates to a 1.3% increase in Export sources per-race wagering value. Weather A ten degrees Celsius gain at Woodbine pushes up All Sources wagering by 4%. It is interesting that on a percentage basis the Export customer base is more responsive to temperature, 5% per each ten degrees, than is the HMA customer at 3% per ten degrees. HMA wagering loses 1% for each 10 km/hr increase in the day’s high windgusts. Finally, a day’s total precipitation returns no statistical relationship to wagering. Scheduling of Races In Figure 3 we map the flow of wagering as the average racecard progresses. Each bar represents the wagering increase isolated to that race as compared to race 1 being the ‘zero’ observation. We observe relatively rapid wagering growth through the early part of the average card and reaching a high plateau at races five, six and seven. Race eight presents a previously unseen scenario where wagering in each of the streams tumbles. However the late races seem to quickly regain their strength. We propose that the wagering strength shown at races four through seven reflect gains inherited from Woodbine’s full-year marketing push on the much favoured ‘early Pick-4’ betting pool. Races six and seven also positively benefit from their position as the most common races for the ‘Early Pick-4’ and the ‘Late Pick-4’ to overlap each other thereby increasing, for example, All Sources average handle 6.2% per incidence (note ‘**’ in Figure 3). We note that this representation of ‘average’ racecard is limiting in its usefulness to management as different times of day (afternoon or evening cards), parts of the week (weekday, weekend) and variations in number of races per card may alternatively impact wagering flows. Figure 4 illustrates the isolated benefits and losses to average wagering for each day of the week and per wagering source. In the first series, on the left of Figure 4, we view the All Sources model output with clear wagering maximums for Saturday followed not so closely by Sundays, Friday and Mondays. We notice that on an All Sources basis that Wednesdays are not different than Thursdays in their wagering strength. The HMA customers, located in the middle series of Figure 4, show a greater appreciation for Wednesday cards by wagering 22% stronger than on a Thursday. Saturdays and Sundays are 40% and 41% better than Thursdays for the HMA. And it is logical that Mondays receive highest regards from the HMA as these relatively unusual racedates coincide with Canadian statutory holidays. Export customers, grouped on the right side of Figure 4, actually seem to prefer Thursday afternoon cards over the Wednesday evening cards by a handle
  • 5. SUMMARY – Econometric Models of Wagering on the Woodbine 2011 Thoroughbred Race Product S. Koch – March 2012 Page 5 of 7 margin of 11%. Export wagering is strongest on Saturdays followed distantly by Fridays and then Sundays. Note that Mondays, coinciding with a holiday for Canadians but not necessarily for Americans, show zero handle benefits relative to Thursdays for the Export bettors. Having identified that the HMA and Export customers exhibit opposing preferences for Wednesdays versus Thursdays we investigate which date earns best revenues for Woodbine. We apply typical after-purses wagering commission rates to the respective underlying model parameter estimates to determine that Wednesdays out-earned Thursdays in 2011 by $653 per race. Continuing this course, we rank the days of the week based upon estimated sum of HMA and Export commissions to find that Saturday commissions outperform Sundays by 30%, followed by Friday, Wednesday and then Thursdays. Mondays rank behind Sundays, ahead of Fridays, being mostly advantaged by HMA holiday effects. Figure 3. Wagering from each source strengthens through race 7 (exhibiting some relationships with Pick-4 pool factors) falters at race 8 but rallies through the last race of the average card, ceteris paribus. The next variable series of independent variables tests for seasonal business trends across the months of the racing year. In general we find that April, being the ‘zero’ month by analysis design, was indeed a relatively weak wagering month. The graph in Figure 5 exhibits that handle generally gained strength through the summer but the fall months of October and November presented substantial declines. While HMA and Export wagering followed the same pattern of rise and fall we notice that HMA led Export into the fall trough and that Export recovered into December earlier than did HMA. Also, on a percentage basis, the summer into fall slowdown of wagering for HMA far exceeded the Export slowdown. 1 2* 3 4 5 6** 7** 8 9 10 11 to 13 Race Number (Race1 = 0) AverageHandle All Sources Export HMA
  • 6. SUMMARY – Econometric Models of Wagering on the Woodbine 2011 Thoroughbred Race Product S. Koch – March 2012 Page 6 of 7 Figure 4. Wagering gains and stalls across the different days of the week. Thursdays serve as the basement observation by which we compare all other dates on a percentage basis. Figure 5. Wagering, ceteris paribus, trended strongest through the summer months but hit a trough in October and November. HMA wagering declines in the fall were relatively substantial. -15% -5% 5% 15% 25% 35% April May June July August September October November December PercentageAverageHandleGains/Losses relativetoApril=0 All Sources Export HMA 0% 22% 15% 13% 15% 31% 40% 28% 19% 41% 12% 14% 49% 0%-11% ALL SOURCES HMA EXPORT PercentageAverageHandleGains relativetoThurdays=0 Wed Fri Sat Sun Mon
  • 7. SUMMARY – Econometric Models of Wagering on the Woodbine 2011 Thoroughbred Race Product S. Koch – March 2012 Page 7 of 7 Overlapping posttimes with New York brings harm to the Woodbine wagering. We can visualize in Figure 6 that the losses in Export wagering due to overlapping posttimes outrun the HMA losses on a percentage basis. The worst posttime placement for Woodbine is immediately within the same minute, plus or minus, as a New York race (NYzero) where handle losses compared to average come to 34% All Sources (or 28% HMA, 36% Export). After NYzero we find that the Woodbine races fare better if slightly after a New York race (NYminus…) rather than immediately before its New York counterpart (NYplus…). In summation, Woodbine races most thrive when timed to run well clear of their larger market share competitor. Figure 6. Overlapping posttime with New York proves detrimental to wagering on Woodbine races. Woodbine races that run on top of (NYzero) or just before a New York race (NYplus) fare worse than their counterparts that run just after a New York race (NYminus). CONTACT THE AUTHOR: Stephen Koch Vice President – Thoroughbred Racing Woodbine Entertainment Group SKoch@WoodbineEntertainment.com 888-675-7223 ext. 2652 -35% -25% -15% -5% N Y m inus5 N Ym inus4 N Y m inus3 N Y m inus2 N Y m inus1 N yzero N Yplus1 N Y plus2 N Y plus3 N Yplus4 N Y plus5 PercentageAverageHandleLosses All Sources Export HMA
  • 8. Econometric Models of All Sources, HMA and Export Wagering on the Woodbine 2011 Thoroughbred Race Product Stephen I. Koch, Woodbine Entertainment Group, March 26, 2012 Industry heuristics, rules of thumb and conventional wisdom holds that wagering handle increases and decreases in relationship to quality of racing. Bettors want full fields of competitive horses. While obvious on the surface, what lies beneath? That is, what does observed handle tell us about bettors’ response to varying race conditions, quality of horses, field size, restricted racing, and seasonality? The simplest attack on these matters is the first order approach; average handle is less or more on this kind of race compared to this other kind of race. But don’t we know that bettors’ behaviours are more nuanced than this? Given that bettors seem to overwhelmingly prefer larger fields, why then will a short field stake race on the best business day perhaps out-handle a full field of claimers on an average racecard? Racing handle evidently rises and falls in response to a more complex interaction of independent race variables. We implement multivariate regression analysis to isolate the independent effects of race variables on handle. This technique empirically verifies which variables are, or are not, meaningful to wagering handle, to what magnitude, while controlling for the often interdependent relationships of many of the independent variables. DATA In this model we primarily estimate net (All Sources) wagering patterns for the 2011 Woodbine Thoroughbred racing product. This model is a continued development of the foundation laid by a series of Woodbine studies ranging from year 2003 through 2011. While we foremost concentrate on All Sources handle, we will diverge heavily into the behaviours of distinct sub- components of All Sources handle – Home Market Area wagering (HMA) and Export sourced wagers. All Sources handle is the sum of the pools, generated from all sites located around the globe wagering on Woodbine events and into Woodbine pools. HMA handle streams plus Export streams sum to 100% of All Sources handle (HMA+Export=All Sources). HMA wagering generally is generated by the track’s most direct customer base. These customers are either on-track or betting from home/internet/otb bases within defined geographic areas surrounding the track’s physical location. Export wagering sources derive from foreign markets and geographic locations around the globe, beyond the easy reach of the host track. The variance in revenues back to the host track from each dollar wagered between these distinct markets is substantial. Home market handle generates very generally about 8% commissions (after purse payments) on a stream that comprises 27% of total handle. Export handle comprises 73% of All Sources handle but at a generally lesser commissions rate of 3% (after purses). The analysis population involves1,515 Thoroughbred races run on the Woodbine one-mile synthetic (Polytrack) and the 1 ½ mile turf track for the full calendar year 2011. We derive all data used in the construction of the analysis from the Woodbine Wagering Operations daily handle reporting and tracking systems in combination with Race Office data on race conditions. Environment Canada and the Bank of Canada provide our only external data to create controls for weather variables and foreign monetary exchange rates. Analysis design and methods are consistent with and generally build upon the extant academic literature, of which we find there is extremely little that is particularly organized on a per-race or race to race handle basis. This analysis does not target bettors’ preferences between races at different racetracks and across different pools other than for an accounting of market-timing. We are working with only the
  • 9. Econometric Models of Wagering on the Woodbine 2011 Thoroughbred Race Product S. Koch – March 2012 Page 2 of 25 data for Woodbine races and pools. For the purpose at hand we concern ourselves with the ‘captured’ customer – the customer that has already made the decision that he is to bet Woodbine rather than competing products. For the primary model the dependent variable, All Sources wagering handle, averages $279,302 with a median of $258,935. Splitting All Sources handle into its respective components gives average home market handle of $75,363 and Export sourced handle averages $203,939. Independent (explanatory) variables include individual race characteristics such as field size, quality of field, very specific race conditions and restrictions on eligibility, race scheduling, seasonality and competitive market factors. For quick reference Table 1 offers brief definitions for the respective variables. Table 2 provides summary statistics for each variable. Table 1. Definitions of Analysis Variables Variable Definition HandleAll Per race, All Sources wagering handle. Includes all pools, multi-race pools (P4,P3,DD) divided evenly across relevant race observations. HandleExport Foreign and non-HMA sourced per-race wagering. Includes all pools, multi-race pools (P4,P3,DD) divided evenly across relevant race observations. HandleHMA Home market area sourced per-race wagering. Includes all pools, multi-race pools (P4,P3,DD) divided evenly across relevant race observations. Starters Number of horses available as betting interests in the race. Starters2 =Starters*Starters, quadratic specification of Starters. RaceQPorIntl =1 if race is the Queen’s Plate or Canadian International, 0 otherwise CondCL1 =1 if race conditions fit CL1, 0 otherwise. CondCL2 =1 if race conditions fit CL2 , 0 otherwise. CondCL3 =1 if race conditions fit CL3, 0 otherwise. CondCL4 =1 if race conditions fit CL4, 0 otherwise. CondCL5 =1 if race conditions fit CL5, 0 otherwise. CondAL1 =1 if race conditions fit AL1, 0 otherwise. CondAL5 =1 if race conditions fit AL5, 0 otherwise. CondAL4 =1 if race conditions fit AL4, 0 otherwise. CondAL3 =1 if race conditions fit AL3, 0 otherwise. CondAL2 =1 if race conditions fit AL2, 0 otherwise. StkOvernight =1 if overnight stake, 0 otherwise StkScheduled =1 if scheduled stake and not graded, 0 otherwise. StkGr3 =1 if Grade III stake race, 0 otherwise. StkGr2 =1 if Grade II stake race, 0 otherwise. StkG1orMajor =1 if Grade I stake races or other major race (Queen’s Plate, Oaks, Breeders’ Stakes), 0 otherwise. Purse Listed purse available for payout to respective race’s earners. DayOpening =1 if race is on April 2nd or April 3rd (first weekend of 2011 racemeet), 0 otherwise. DayGoodFri =1 if race is on Good Friday holiday, 0 otherwise.
  • 10. Econometric Models of Wagering on the Woodbine 2011 Thoroughbred Race Product S. Koch – March 2012 Page 3 of 25 Table 1 continued. Variable Definition DayJuly1 =1 if race is on July 1st holiday, 0 otherwise. BCTC =1 if race is same day as Breeders’ Cup or Triple Crown races, 0 otherwise. DayBigRace =1 if race is on card with a Grade I or other major race event, 0 otherwise. Age2yo =1 if race restricted to two-year-olds, 0 otherwise. Furlongs distance of race in furlongs. Maidens =1 if race restricted to maidens (Allowance, Claiming), 0 otherwise. Turf =1 if race run on Turf, 0 otherwise. TurfOff =1 if race originally carded for turf but instead run on polytrack, 0 otherwise. ONSired =1 if Ontario Sired restricted race, 0 otherwise. ForEx previous business day’s closing Canada/U.S. monetary exchange rate. WeatherTemp day’s high temperature in degrees Celsius. WeatherPrecip day’s total precipitation in millimeters. WeatherWind day’s maximum wind gust, gusts less than 31km/hr made zero. Race1 =1 if first race on card, 0 otherwise. Race2 =1 if second race on card, 0 otherwise. Race3 =1 if third race on card, 0 otherwise. Race4 =1 if fourth race on card, 0 otherwise. Race5 =1 if fifth race on card, 0 otherwise. Race6 =1 if sixth race on card, 0 otherwise. Race7 =1 if seventh race on card, 0 otherwise. Race8 =1 if eighth race on card, 0 otherwise. Race9 =1 if ninth race on card, 0 otherwise. Race10 =1 if tenth race on card, 0 otherwise. Race11to13 =1 if eleventh, twelfth or thirteenth race on card, 0 otherwise. Wednesday =1 if race on a Wednesday, 0 otherwise. Thursday =1 if race on a Thursday, 0 otherwise. Friday =1 if race on a Friday, 0 otherwise. Saturday =1 if race on a Saturday, 0 otherwise. Sunday =1 if race on a Sunday, 0 otherwise. Monday =1 if race on a Monday, 0 otherwise. April =1 if race is in April, 0 otherwise. May =1 if race is in May, 0 otherwise. June =1 if race is in June, 0 otherwise. July =1 if race is in July, 0 otherwise. August =1 if race is in August, 0 otherwise. September =1 if race is in September, 0 otherwise. October =1 if race is in October, 0 otherwise. November =1 if race is in November, 0 otherwise. December =1 if race is in December, 0 otherwise. NYminus5 =1 if race off-time is 5 minutes after a New York race, 0 otherwise. NYminus4 =1 if race off-time is 4 minutes after a New York race, 0 otherwise. NYminus3 =1 if race off-time is 3 minutes after a New York race, 0 otherwise. NYminus2 =1 if race off-time is 2 minutes after a New York race, 0 otherwise.
  • 11. Econometric Models of Wagering on the Woodbine 2011 Thoroughbred Race Product S. Koch – March 2012 Page 4 of 25 Table 1 continued. Variable Definition NYminus1 =1 if race off-time is 1 minute after a New York race, 0 otherwise. NYzero =1 if race off-time is same minute as a New York race, 0 otherwise. NYplus1 =1 if race off-time is 1 minute before a New York race, 0 otherwise. NYplus2 =1 if race off-time is 2 minutes before a New York race, 0 otherwise. NYplus3 =1 if race off-time is 3 minutes before a New York race, 0 otherwise. NYplus4 =1 if race off-time is 4 minutes before a New York race, 0 otherwise. NYplus5 =1 if race off-time is 5 minutes before a New York race, 0 otherwise. Table 2. Summary statistics of Analysis variables (n = 1,515) Variable Mean Std. Dev. Median Sum Maximum Minimum HandleAll 279,302 138,813 258,935 423,142,004 3,020,076 45,993 HandleExport 203,939 103,792 187,068 308,967,211 2,050,883 26,676 HandleHMA 75,363 39,434 70,510 114,174,794 969,194 15,617 Starters 8.49 2.22 8.00 12,863 17.00 3.00 RaceQPorIntl 0.001 0.04 0.00 2 1.00 0.00 CondCL1 0.26 0.44 0.00 396 1.00 0.00 CondCL2 0.10 0.30 0.00 149 1.00 0.00 CondCL3 0.09 0.29 0.00 139 1.00 0.00 CondCL4 0.09 0.29 0.00 137 1.00 0.00 CondCL5 0.003 0.06 0.00 5 1.00 0.00 CondAL1 0.19 0.39 0.00 284 1.00 0.00 CondAL5 0.11 0.31 0.00 166 1.00 0.00 CondAL4 0.07 0.25 0.00 103 1.00 0.00 CondAL3 0.01 0.85 0.00 11 1.00 0.00 CondAL2 0.005 0.07 0.00 7 1.00 0.00 StkOvernight 0.01 0.10 0.00 16 1.00 0.00 StkScheduled 0.04 0.20 0.00 66 1.00 0.00 StkGr3 0.01 0.11 0.00 18 1.00 0.00 StkGr2 0.01 0.08 0.00 10 1.00 0.00 StkGr1orMajor0.01 0.07 0.00 8 1.00 0.00 Purse 55,739 70,872 47,800 84,444,500 1,500,000 16,100 DayOpening 0.01 0.11 0.00 20 1.00 0.00 DayGoodFri 0.01 0.08 0.00 10 1.00 0.00 DayJuly1 0.01 0.08 0.00 9 1.00 0.00 BCTC 0.04 0.19 0.00 54 1.00 0.00 DayBigRace 0.03 0.17 0.00 45 1.00 0.00 Filly 0.47 0.50 0.00 706 1.00 0.00 Age2yo 0.16 0.37 0.00 245 1.00 0.00 Furlongs 6.99 0.37 7.00 10,584 15.00 4.50 Maidens 0.41 0.49 0.00 626 1.00 0.00 Turf 0.11 0.32 0.00 171 1.00 0.00
  • 12. Econometric Models of Wagering on the Woodbine 2011 Thoroughbred Race Product S. Koch – March 2012 Page 5 of 25 Table 2 continued. Variable Mean Std. Dev. Median Sum Maximum Minimum TurfOff 0.04 0.20 0.00 61 1.00 0.00 ONSired 0.22 0.43 0.00 336 1.00 0.00 ForEx 0.988 0.03 0.980 1497 1.055 0.943 WeatherTemp 19.93 7.86 20.90 30190 35.80 3.70 WeatherPrecip2.70 5.92 0.00 4083 34.20 0.00 WeatherWind 26.79 24.76 33.00 40,580 82.00 0.00 Race1 0.11 0.31 0.00 165 1.00 0.00 Race2 0.11 0.31 0.00 165 1.00 0.00 Race3 0.11 0.31 0.00 165 1.00 0.00 Race4 0.11 0.31 0.00 165 1.00 0.00 Race5 0.11 0.31 0.00 164 1.00 0.00 Race6 0.11 0.31 0.00 164 1.00 0.00 Race7 0.11 0.31 0.00 164 1.00 0.00 Race8 0.11 0.31 0.00 164 1.00 0.00 Race9 0.07 0.26 0.00 107 1.00 0.00 Race10 0.05 0.22 0.00 77 1.00 0.00 Race11to13 0.01 0.10 0.00 15 1.00 0.00 Wednesday 0.17 0.37 0.00 253 1.00 0.00 Thursday 0.12 0.33 0.00 185 1.00 0.00 Friday 0.20 0.40 0.00 305 1.00 0.00 Saturday 0.24 0.43 0.00 363 1.00 0.00 Sunday 0.24 0.43 0.00 369 1.00 0.00 Monday 0.03 0.16 0.00 40 1.00 0.00 April 0.09 0.28 0.00 135 1.00 0.00 May 0.11 0.32 0.00 170 1.00 0.00 June 0.13 0.34 0.00 200 1.00 0.00 July 0.13 0.33 0.00 192 1.00 0.00 August 0.13 0.33 0.00 191 1.00 0.00 September 0.13 0.33 0.00 198 1.00 0.00 October 0.13 0.33 0.00 193 1.00 0.00 November 0.13 0.33 0.00 193 1.00 0.00 December 0.03 0.17 0.00 43 1.00 0.00 NYminus5 0.01 0.11 0.00 18 1.00 0.00 NYminus4 0.01 0.08 0.00 9 1.00 0.00 NYminus3 0.01 0.10 0.00 14 1.00 0.00 NYminus2 0.003 0.06 0.00 5 1.00 0.00 NYminus1 0.01 0.09 0.00 12 1.00 0.00 NYzero 0.02 0.14 0.00 30 1.00 0.00 NYplus1 0.02 0.13 0.00 28 1.00 0.00 NYplus2 0.01 0.11 0.00 18 1.00 0.00 NYplus3 0.02 0.13 0.00 27 1.00 0.00 NYplus4 0.02 0.14 0.00 30 1.00 0.00 NYplus5 0.03 0.16 0.00 41 1.00 0.00
  • 13. Econometric Models of Wagering on the Woodbine 2011 Thoroughbred Race Product S. Koch – March 2012 Page 6 of 25 Field Size There pre-exists overwhelming evidence, both empirical and anecdotal, that field size serves as the single most important per-race handle determinant. That is, how many individual runners are there in a given race available to place wagers on or against. More betting interests increases the competitiveness of the race and spreads the wagered dollars across more choices and more combinations of choices allowing for larger odds and better payoffs for the winning wagers. We will re-test this notion with the variable Starters, defined as the number of runners as separate betting interests in each respective race. Earlier Woodbine studies have shown that a quadratic, or curved, relationship exists where there are positive yet decreasing rewards to handle for each additional horse in a race. For example, we expect to again show that the bet generally increases more in response to adding a fifth horse to a four horse field than it will increase to add a tenth horse to a nine horse field. We test for this concave relationship with the variable Starters2 (Starter2=Starters*Starters). Two specific races in the 2011 data pose outlier complications to the Starters test. The Queen’s Plate and the Canadian International fielded oversized groups of 17 and 16 horses, respectively. Maximum field size for every other race through the year is capped at 14. Added to this, these marquee races produce disproportionately large wagering. We include a dichotomous binary (dummy) variable named RaceQPorIntl in order to control for this combined outlier effect. Quality of Field Increasing the average quality of the runners in any given race should be desirable to the customers. Customers anecdotally prefer stakes caliber horses which would seem to be more formful and interesting wagering propositions compared to less talented horses such as in the lower claiming ranks. The Racing Secretary defines each race’s eligibility conditions such that only a certain quality of horse is eligible for that event. Thus competitive fields are ensured rather than short-odds runaway winner type races that would be relatively less bet according to a series of University of Arizona studies by Margaret Ray. Previous studies have approached this quality of field variable via two differing methods. Either case may not necessarily be the best approach as each has an advantage and a disadvantage. Rather, previous specifications seem to have been chosen due to constraints in the data. This analysis enjoys the luxury of complete data to test either specification and we therefore execute both. The first approach to quantifying field quality implements a series of dummy variables reflecting various race condition types. The quality steps of the Woodbine Thoroughbred races can be distilled down to three major stratifications – Claiming, Allowance and Stakes. We then further compartmentalize these three major groups into five claiming classes, five allowance classes and five designations for stake races (see Table 3). Each class is treated as a dummy variable equaling 1 if the respective race fits this class and 0 otherwise. CondCL1 is the lowest quality ranks – claiming runners – horses running for the smallest purses where we expect the least wagering, holding all other variables constant. CondCL2 is a step up in talent from CondCL1 with a likewise increase in purses and we thus expect an increase in the wagering on these events. CondCL3, CondCL4 and CondCL5 continue this pattern of increasing field quality for increasing purses through to the highest of the lowest strata of horses. For the allowance race conditions, the middle quality group, CondAL2 should grow handle compared to CondAL3, CondAL4 and then CondAL5. The entry level allowance races with the lowest average allowance purses, known as maiden allowance, form the group CondAL1. We number the CondAL variables consistent with Race Office practice where these races are often
  • 14. Econometric Models of Wagering on the Woodbine 2011 Thoroughbred Race Product S. Koch – March 2012 Page 7 of 25 short-formed as, for example, ‘allowance 2’ or ‘allowance 5’. It is a historical oddity of Race Office practices as to why the progression would illogically proceed 1,5,4,3,2 as we climb in quality but we shall remain true to this form herein (again, see Table 3). Table 3. Definitions for Race Condition Variables with Average Purses Race Condition Definition Average 2011 Purse Claiming and Maiden Claiming CL1 ‘bottoms’ through $16,000 claiming price $21,512 CL2 $20,000 claiming price $27,862 CL3 $25,000 through $32,000 claiming price $37,825 CL4 $40,000 through $50,000 claiming price $46,018 CL5 $62,500, $80,000, $100,000 claiming price $48,600 Allowance AL1 Maiden Allowance, Allowance ‘B’ $60,276 AL5 Non-winners OMC/Non-winners 2 $64,873 AL4 Non-winners 2 OMC/Non-winners 3 $68,975 AL3 Non-winners 4 OMC and $79,700 Non-winners 3 OMC AL2 Open Allowance $89,400 Stakes Overnight Stakes $100,000 Scheduled Stakes $150,379 Grade III $169,444 Grade II $240,000 Grade I or Major Races $812,500 The highest performing horses eventually find their way to the stakes races. These high quality race fields battle for the biggest, sometimes windfall, purses. Overnight stakes form the entry-level ranks where solid-performing allowance horses can take a step up for a relatively light stakes purse. Overnight stakes acquire their name from the fact that they can be carded or not carded ‘overnight’ rather than being locked into a calendar date far in advance. In turn, scheduled stakes are planned for months in advance as are the graded stakes. Graded stakes form the peak of racing competition where Grade III (StkGr3) is outclassed by Grade II (StkGr2) which is in turn outclassed by Grade I races. Woodbine uniquely offers 3 non-graded stake races at purses competitive with Grade 1 events anywhere: the Woodbine Oaks $500,000, Queen’s Plate $1,000,000 and the Breeders’ Stakes $500,000. For this analysis we include these three non-graded races with the Grade I’s thus forming the variable StkG1or Major. In all cases for the various claiming, allowance and stakes designations we expect that wagering handle increases along with the quality of the field as we hold constant for all other variable factors. The alternate quality of field specification implements race purses as a proxy for increasing competition levels. The amount of money available as payment to the winners of a race generally increases as the conditions of the race calls for tougher competitors (Table 3). A stake race offers a
  • 15. Econometric Models of Wagering on the Woodbine 2011 Thoroughbred Race Product S. Koch – March 2012 Page 8 of 25 bigger purse than an allowance race, which is more valuable than a maiden allowance which in turn is more valued than the respective claiming ranks. The Purse variable we would expect therefore to exhibit a positive relationship with wagering handle. We do not make the error of assuming that purses, while a fine proxy for field quality, hold any particular correlating value to the punter who himself dictates race handle. That is, the punter doesn’t care what does the horse stand to earn from the race but he does care that the entrants have been controlled for relatively high, medium or low quality levels of competition. Race Events Through the racing year Woodbine benefits from certain special racing events contributing to wagering boosts. We control for these positive business dates with a series of dummy variables where observations equal 1 for races on the respective date and 0 otherwise. The dates controlled for in this manner are the two days of opening weekend for the racemeet in April (DayOpening), Good Friday (DayGoodFri) and July 1st Canada Day (DayJuly1). Major wagering events at other racetracks can also be drivers of handle for the Woodbine live races. We control for the coincidence of Triple Crown and the Breeders’ Cup Championship racedates with the dummy variable name BCTC. Finally, marquee race events at Woodbine certainly benefit the wagering on undercard races run that same day. We control for this phenomenon with the dummy variable DayBigRace. Race Condition Restrictions There are more than just quality of field restrictions written into the race conditions. The Racing Secretary will further segregate races by sex, age. racing surface (turf versus synthetic) and distance. Or, he will often introduce more artificial restrictions such as to honour breed development programs. Typically fillies and mares will not mingle in competition with colts and geldings. While this is generally held to for competitiveness reasons, what do the customers think? Do filly- restricted races get bet less or more than open races? We test this with another dummy variable, Filly, where filly and mare restricted races equal 1 and all other races are assigned 0. Similar to the segregation by sex the races will often exclude horses of certain ages. Very young horses will always be at a maturity and competitiveness disadvantage to older racing veterans. In 2011 there were 245 races at Woodbine restricted to the youngest runners, two-year- olds. Two-year-olds generally have very few or no previous races from which customers may gauge competitiveness. On one hand this information shortage can be a disadvantage to handle but it can be likewise an advantage for customers that feel they have other informational advantages. The dummy variable where we assign 1 for two-year-old races and 0 to all other races should identify what are effects of two-year-old racing on handle. The highly varied distances of thoroughbred racecards is a distinguishing factor from other breeds of racing. Thoroughbreds at Woodbine will race anywhere from 4.5 furlongs to a mile (8 furlongs) or even further to 1 7/8ths miles. We test for the wagering effects of longer or shorter racing distances with the continuous variable titled Furlongs. Furlongs equals the number of furlongs assigned as the distance of the respective race. A horse that has never won a race is referred to as a maiden. The Race Office routinely cards races for these non-winners where horses with winning form are specifically excluded. Maiden races can be at various claiming level as well as the entry allowance level, allowance 1. We
  • 16. Econometric Models of Wagering on the Woodbine 2011 Thoroughbred Race Product S. Koch – March 2012 Page 9 of 25 create the dummy variable Maidens to identify if fields of non-winners serve detriment to wagering volume. Woodbine racetrack is very proud of it expansive 1 ½ mile turf course. The turf, in complement with the 1 mile synthetic surface (Polytrack), provides a broad variety of racing opportunities for horses that prefer different racing surfaces. In 2011 the high quality turf available at Woodbine consistently attracted above average sized fields (9.49 starters per turf race, 8.36 per synthetic race) and high quality runners from other foreign racetracks. We test for a relationship between turf racing and customer preferences, via their wagering dollars, with the variable named Turf where turf races equal 1 and synthetic track races equal 0. A common misconception regards the relationship of turf racing to handle. Turf racing itself likely is not the immediate driver of handle that some would tout. This analysis proposes that the increased average handle on turf races over main track races primarily is driven by other turf-related factors such as, more likely, increased average field size per turf race relative to main track races. Occasionally races originally carded for the turf course will instead be run on the synthetic surface due to wet conditions that would present dangerous turf conditions to the horses or more often compromise the maintenance and longevity of the turf course. These late changes in surface are problematic to betting customers as sometimes horses will scratch from the race or runners can show different form on a surface that they were not originally intended for. We organize the TurfOff variable to test for negative wagering aspects of turf to synthetic surface switches. The final race conditions restriction we test regards the Ontario Sired events. This breed development program allows for locally bred horses, direct progeny of stallions registered as standing in Ontario, to compete against their own rather than facing open company. Ontario Sired restrictions applied to some maiden claiming $25,000, allowance 1, allowance 5 and even some stake conditions in 2011. This concept is designed as an economic spur for Ontario produced horses and in turn as a rural/agricultural economic development program. Every rose has its thorn however. In this case – what is the response to restricted racing from customers distributed across the globe (immensely outnumbering Ontario/local customers), in highly saturated simulcast markets? For precedence we turn to DeGennaro’s 1989 study titled “Determinants of Wagering Behavior”. DeGennaro concluded that restricted races with added purses offer no benefit to handle. Our expectations go further than DeGennaro’s results in that Ontario Sired restrictions likely serve actual detriment to handle. In the years since the 1989 study the international distribution model of horseracing has matured, competition continually sharpens and the marketplace is as cluttered with product as ever. Regional events such as Sire restrictions simply lack appeal relative to more open events with known and/or perceived higher quality runners. In short, customers find it very easy to turn the page on races they do not prefer. To test for this behaviour we construct ONSired as a dummy variable where Ontario Sired restricted races equal 1 and open races equal 0. Foreign Exchange The Woodbine product enjoys broad distribution across numerous international markets. Foreign monetary exchange rates certainly provide a considerable force towards increasing or restraining wagering totals. In particular, the U.S./Canadian exchange rate is most influential as the overwhelming majority of Woodbine’s international distribution is throughout the U.S. A strong Canadian dollar implies that U.S. dollars bet into Canadian pools translate to a relatively smaller sum than in periods where the Canadian dollar is relatively weaker than its U.S. cousin. The continuous variable ForEx assigns the previous business day’s closing US/Canada exchange rate (U.S. purchasing Canadian dollars) to each respective race observation. We expect that as this rate
  • 17. Econometric Models of Wagering on the Woodbine 2011 Thoroughbred Race Product S. Koch – March 2012 Page 10 of 25 increases then the wagering effect will be negative, particularly in a model constrained to only Export sourced wagering. We expect HMA wagering to be less susceptible to foreign exchange rates. Weather On-track weather conditions perhaps have conflicting roles in driving wagering. On one hand one expects that enjoyable weather would improve on-track attendance and its related wagering figures. Alternatively, most of horserace wagering is consumed off-track via television monitor and internet connections in far-flung geographies so that enjoyable weather might be not relevant. Separate from this, certain weather conditions can impact the outcome of races as different horses may benefit from varied weather conditions. We test for weather impacts with three continuous variables reflecting the day’s high temperature (WeatherTemp), total precipitation for the day (WeatherPrecip) and maximum winds for the respective date (WeatherWind). We pull this data from Environment Canada as it is collected at Pearson Airport located immediately next door to the Woodbine racetrack. Unfortunately for the wind variable Environment Canada does not report days’ maximum wind gusts if they are less than 31 km/hr. We assign a zero to these low wind observations to reflect that perhaps this threshold of low wind gusts has no handle impacts. Certainly the WeatherTemp variable carries some seasonal aspects with it as is evidenced by relatively high cross correlations with certain spring and fall month variables (presented later under ‘Scheduling of Races’). May and September show quite low correlations with the temperature variable but the other months range from +/- 0.20 to +/- 0.48. But the temperature’s relevance from day to day is certainly substantive and we retain this variable for exactly that explanatory power. Scheduling of Races There is reason and evidence, including historical analyses, suggesting that the flow of a day’s racecard impacts wagering. In a strictly on-track environment it seems reasonable that the later races would be bet more than earlier races as the late arriving crowd invests at the mutuel windows. It further seems that the very late races (particularly for a night product such as is the Wednesday night cards) may experience diminishing handle as the crowd gets tired and goes home. Or, have recent marketing pushes on the ‘Early Pick-4’ wager (races 4, 5, 6 and 7) impacted the flow of wagering through the raceday? In the modern simulcasting environment though this pattern could be mitigated as handle is less tied to the host racetrack. Do bettors in different time zones being saturated with multiple products on different schedules collectively react less to racecard scheduling? We test these various questions with a series of dummy variables where Race1 equals 1 if a race is the first race of its respective card, 0 otherwise and Race2 equals 1 if the second race on a card and 0 otherwise and so forth through the last race of the card. Generally, Wednesday and Thursday cards in 2011 were 8 races, Friday most often offered 9 races and a full card on Saturdays and Sundays included 10 races. Very rarely a major racedate card offered 11, 12 or 13 races which we combine into the dummy variable Race11to13 (15 observations total). We expect to find that each later race increases handle relative to the first race on the card. Seasonal and weekly business patterns emerge for many businesses. Pari-mutuel wagering is not exempt. Certain days of the week, such as weekends, will consistently be stronger business days than weekdays. Or within the week Wednesdays or Thursdays might, on average, perform stronger than their counterpart due to differences in the simulcast market. Not unlike days of the week, months of the year can reflect seasonal rise and falls in business as well as reflect industry business trends. Through the year one might expect wagering activity to increase in good weather
  • 18. Econometric Models of Wagering on the Woodbine 2011 Thoroughbred Race Product S. Koch – March 2012 Page 11 of 25 (summer) and decline in the winter. Or longer term downward and upward economic trends may override seasonal trends as the year progresses. To test the business patterns within the week we construct a series of dummy variables where 1 equals the respective day of the week and 0 for the other days for Wednesday, Thursday, Friday, Saturday, Sunday and Monday. We likewise construct dummy variables for each calendar month, April through December, where observations for the respective month equal 1 and 0 otherwise. Now that we have organized the analysis for race number, day of the week and month – what is the relevance of a minute? Woodbine extends considerable effort timing its race off-times to the perfect moment within the broader simulcast market. The Woodbine Live Thoroughbred product has long suffered a market disadvantage to competing, larger market share products. The diversity and simultaneity of products at international simulcast venues requires that our customers must either split their attention thinly between races or altogether ignore their second choice content. Our simulcast directors and Race Office have long scheduled races specifically to dodge these circumstances and our customers vote accordingly with their dollars. We can perhaps demonstrate this phenomenon with a series of dummy variables indicating races that are run within a critical few minutes of North America’s leading market share competitor – New York. The NYminus5 variable equals 1 for Woodbine races run 5 minutes after a New York race. Similarly, NYminus4, NYminus3, NYminus2 and NYminus1 are constructed to equal 1 for races run at the respective number of minutes after a New York race and 0 for all others. NYzero equals 1 for races run within the same minute, plus or minus, of a New York race. The NYplus1, NYplus2, NYplus3, NYplus4 and NYplus5 variables equal 1 for races run the respective number of minutes before a New York race. Woodbine’s long experience indicates that races run just after a New York race fare better than their counterparts run immediately prior to the New York race. Going forward in this document we will often refer to the NYminus, NYzero and NYplus series of variable as New York minutes. As a tribute to Woodbine’s savvy in dodging New York races the number of 2011 Woodbine race observations fitting these New York minutes definitions is very small – only 232. More than half (52%) of these 232 are first race and second race incidences where Woodbine frequently sacrifices lesser bet early races in order to ensure that more valuable later races absolutely are not on schedule to conflict with New York. THE MODELS We present two All Sources Handle functions as set forth in the preceding ‘Data’ explanations. Recall that the opposing methods controlling for Quality of Field (claiming, allowance and stake race conditions dummy variables versus a continuous Purses specification) call for dual model specifications. The Race Conditions model will be tested first on an All Sources handle basis consistent with the Purses model. But we subsequently subdivide the All Sources analysis into its component streams of HMA and Export so that there totals four econometric models for presentation and discussion. Purses Model: Handle = f(Starters, Starters2, RaceQPorIntl, Purses, DayOpening, DayGoodFri, DayJuly1, BCTC, Filly, Age2yo, Furlongs, Maidens, Turf, TurfOff, ONSired, ForEx, WeatherTemp, WeatherPrecip, WeatherWind, Race2, Race3, Race4, Race5, Race6, Race7, Race8, Race9, Race10, Race11to13, Wednesday, Friday, Saturday, Sunday, Monday, May, June, July,
  • 19. Econometric Models of Wagering on the Woodbine 2011 Thoroughbred Race Product S. Koch – March 2012 Page 12 of 25 August, September, October, November, December, NYminus5, NYminus4, NYminus3, NYminus2, NYminus1, NYzero, NYplus1, NYplus2, NYplus3, NYplus4, NYplus5) Race Conditions Model: Handle = f(Starters, Starters2, RaceQPorIntl, CondCL2, CondCL3, CondCL4, CondCL5, CondAL1, CondAL5, CondAL4, CondAL3, CondAL2, StkOvernight, StkScheduled, StkGr3, StkGr2, StkGr1orMajor, DayOpening, DayGoodFri, DayJuly1, BCTC, Filly, Age2yo, Furlongs, Maidens, Turf, TurfOff, ONSired, ForEx, WeatherTemp, WeatherPrecip, WeatherWind, Race2, Race3, Race4, Race5, Race6, Race7, Race8, Race9, Race10, Race11to13, Wednesday, Friday, Saturday, Sunday, Monday, May, June, July, August, September, October, November, December, NYminus5, NYminus4, NYminus3, NYminus2, NYminus1, NYzero, NYplus1, NYplus2, NYplus3, NYplus4, NYplus5) Notice that we remove the variables Race1, Thursday and April from both functions and we remove CondCL1 from the Race Conditions function. To include a dummy variable across every observation leads us to a singular matrix and in turn defeats the attempt at OLS regression. We choose these particular dummy variables to drop as they represent the bottom level or first level of their respective variable groups. They become then the ‘zero’ or basis of comparison for their relative variables’ parameter estimates. For example, we designed the day of week variables such that Thursdays set a foundation (Thursday parameter estimate is 0) where the remaining days of the week are marginally more or less valuable to handle according to their respective parameter estimates. The other variable groups designed in this fashion explain the progression of the racecard (Race1 parameter estimate is 0) changes in race condition (CondCL1 parameter estimate is 0) and the calendar months (April parameter estimate is 0). RESULTS All four models implement linear specifications. We encounter heteroskedasticity due to the variance of the dependent Handle variables as well as the independent variable Purse. To preempt the heteroskedastic effects but maintain the simplicity of a linear model output (as opposed to a logarithmic specification of Handle and Purse) we implement White’s approach towards heteroskedasticity corrected standard errors as facilitated by our statistical software (E-Views 7.0). The data, being from every race for a year, is somewhat time-series in its organization. For example, today’s handle may be related to yesterday’s handle and may in turn relate to tomorrow’s handle. And, even within the individual racecards we acknowledge this relationship with the Race2, Race3,…, Race11to13 dummy variables. It is understood that time-series data is prone to autocorrelation and its pitfalls. Future studies into this matter wrestle with the notion of ‘stacked’ autocorrelation but for now we sideline the matter as beyond the scope of the current project. To circumvent this in the data and to treat each race as its own event we re-order the observations on a random basis prior to modeling and regression. The respective regression outputs have a Durbin- Watson test value of 2.12 and 2.08, respectively, implying that auto-correlation has been mitigated for the purposes of this current project. The All Sources models explain (coefficient of variation, r-squared) 80 percent and 81 percent, respectively, of the variation in defined handle. For ease of comparison we outline the complete results for both econometric models in Table 4. The left-most column identifies the various independent variables. The right-side series of columns identify the parameter estimates for
  • 20. Econometric Models of Wagering on the Woodbine 2011 Thoroughbred Race Product S. Koch – March 2012 Page 13 of 25 the respective independent variables. We present side by side the output for the All Sources Purses Model and the All Sources Race Conditions model. Similarly we present the subdivision models (HMA sources Race Conditions Model and Export sources Race Conditions Model where HMA + Export = All Sources) contiguous to the All Source Race Conditions Model for simplicity of comparisons. The grey columns in the three Race Conditions Models present the parameter estimates as a percentage of the respective wagering stream’s average handle. In Table 4 each parameter estimate identifies the average, ceteris paribus (all other variables held constant at their sample means) marginal impacts on wagering handle per incidence or increase of the associated variable. Statistical significance of an estimate is notated with “*”. Statistically insignificant estimates (no *’s) may be interpreted as being not different than zero in their relationship to the dependent handle variable. Purse or Race Conditions variables purposely omitted from a respective model are denoted as ‘na’. The two competing specifications allow an additional benefit to the analysis in that we can demonstrate some robustness of analysis results. Parameter estimates seem consistent across the models with only some minor variations. As a benefit of the robust models we will concentrate hereafter on results of the All Sources Handle Race Conditions Model (presented as bold type in Table 4). We will refer back to the Purses Model and the HMA or Export sources Race Conditions Models as key differences in the model outputs warrant. Field Size We illustrate the statistically significant quadratic relationship between field size (Starters and Starters2) and wagering handle in Figure 1. The black bars demonstrate the marginal percentage impacts on All Sources handle of having added one additional betting interest up to that point. For example, adding a seventh runner to a six horse field will on average increase handle about 9.9%, all else held constant. To add a seventh plus an eighth horse then the average reward accumulates to 19.1% (9.9% + 9.2%) more than handle would have been on the six horse field. Notice that the isolated percentage impacts decrease as we approach the normal maximum field size of 14. The dummy variable controlling for the extraordinary field size and outlier wagering experience of the Queen’s Plate and the International (RaceQPorIntl) shows that wagering lifted $1,302,258 after having controlled for other input factors. Obviously these marquee events bring positive reputation effects for the track along with related one-time handle windfalls. Interestingly, the Purses model returns a statistically insignificant result on RaceQPorIntl. We interpret that within this alternative model the extraordinary purses on these races mitigates the impacts of their respective outlier field sizes. Quality of Field The Race Conditions model outputs statistically significant and positive estimates for increasing field quality. Using the bottom level (CondCL1) races as our base of comparison we identify that CondCL2, CondCL3 and CondCL5 are not different than CondCL1 in their relationship to driving All Sources handle. Although, CondCL2 and CondCL3 do show statistical significance in the HMA model signifying that there exist rewards specifically from the home market customers for increasing quality of claiming fields. It seems an oddity in the data that CondCL4 would outperform CondCL5 though we note after the fact that CondCL5 holds only 5 observations for the year. More importantly, in all models we easily identify increasing wagering gains as quality of field increases through the Allowance and Stake races. We illustrate these
  • 21. Econometric Models of Wagering on the Woodbine 2011 Thoroughbred Race Product S. Koch – March 2012 Page 14 of 25 rewards to quality fields in Figure 2. The percentage data labels in this figure reflect the isolated percent wagering increase corresponding to the respective race condition versus having carded a low-end claiming event. For example, from an All Sources standpoint an Allowance 4 on average and all else held constant yields an 11.3% increase in wagering over having run a ConCL3 or lesser claiming event. Notice also the trendline added into Figure 2 acknowledging the positive relationship between race conditions and purses as a proxy for quality of field. The estimated increases between the race conditions parameter estimates, particularly at the Allowance and Stake levels, in the first model suggests that the alternate model implementing purses as proxy for quality of field is relevant. At the statistically significant Purse parameter estimate of 0.72 we calculate that for each $25,000 purse jump there comes a related All Sources wagering boosts of $18,000 or 6.4% of average handle. Purses seem to be a logical proxy for quality of field for future analyses concentrated within a single racetrack’s purse structure. We note that this approach may go astray though if applied to data reaching across varied purse structures such as from multiple racetracks or multiple years where like race conditions may have offered differing purse levels. Table 4. Summary of statistically significant parameter estimates for the Purses Model and the Race Conditions Models. Dependent variable is All Sources, HMA and Export sourced wagering handle. Percent figures reflect parameter estimates’ percentage relevance to respective handle sources. Statistical significance denoted with *’s. Independent Variables Starters 35,705 * 39,119 * 9,833 * 29,286 * Starters2 -723 *** -892 * -228 ** -664 ** RaceQPorIntl 948,102 1,302,258 * 466% 403,656 ** 536% 898,602 * 441% CondCL2 na 7,247 2,945 * 4% 4,302 CondCL3 na 7,557 2,460 ** 3% 5,097 CondCL4 na 18,689 * 7% 5,065 * 7% 13,625 * 7% CondCL5 na -5,268 3,065 -8,333 CondAL1 na 21,322 * 8% 7,417 * 10% 13,905 * 7% CondAL5 na 20,088 * 7% 6,935 * 9% 13,153 ** 6% CondAL4 na 31,547 * 11% 7,669 * 10% 23,888 * 12% CondAL3 na 49,340 * 18% 11,566 ** 15% 37,774 * 19% CondAL2 na 84,110 * 30% 13,617 * 18% 70,493 * 35% StkOvernight na 61,212 * 22% 15,512 * 21% 45,701 ** 22% StkScheduled na 95,349 * 34% 20,200 * 27% 75,149 * 37% StkGr3 na 142,312 * 51% 28,519 * 38% 113,793 * 56% StkGr2 na 210,967 * 76% 48,077 * 64% 162,890 * 80% StkGr1orMajor na 538,592 * 193% 136,367 * 181% 402,225 * 197% Purse 0.72 * na na na DayOpening 40,268 * 41,564 * 15% 9,862 * 13% 31,702 * 16% DayGoodFri 68,899 * 67,733 * 24% 31,525 * 42% 36,207 * 18% DayJuly1 110,659 * 110,079 * 39% 39,723 * 53% 70,355 * 34% BCTC -1,547 1,308 9,034 * 12% -7,726 PURSES MODEL RACE CONDITIONS MODELS (R²=80) (R²=81) (R²=86) (R²=76) All Sources HMA Export Avg Handle = $279,302 Avg Handle = $75,363 Avg Handle = $203,939 *statistical significance at better than 0.01 (99%) level, **statistical significance at better than 0.05 (95%) level, ***statistical significance at better than 0.10 (90%) level
  • 22. Econometric Models of Wagering on the Woodbine 2011 Thoroughbred Race Product S. Koch – March 2012 Page 15 of 25 Table 4 continued. Independent Variables DayBigRace 111,281 * 105,795 * 38% 40,254 * 53% 65,541 * 32% Filly 2,283 3,665 -800 4,465 *** 2% Age2yo -3,415 -273 -639 365 Furlongs -1,454 -1624 -439 -1185 Maidens -690 -755 -1,274 519 Turf 1,315 682 -1,567 2,250 TurfOff -28,037 * -24,829 * -9% -4,152 ** -6% -20,678 * -10% ONSired -14,852 * -14,827 * -5% -2,531 * -3% -12,296 * -6% ForEx -226,119 -242,485 *** -87% -30,833 -273,317 ** -134% WeatherTemp -1,202 * -1,240 * -0.4% -235 * -0.3% -1,006 * -0.5% WeatherPrecip 222 187 24 163 WeatherWind -96 -81 -53 ** -0.1% -28 Race2 16,085 * 17,381 * 6% 4,433 * 6% 12,948 * 6% Race3 32,412 * 33,567 * 12% 8,406 * 11% 25,161 * 12% Race4 54,208 * 52,252 * 19% 13,781 * 18% 38,471 * 19% Race5 67,492 * 64,709 * 23% 18,721 * 25% 45,988 * 23% Race6 70,420 * 67,586 * 24% 19,366 * 26% 48,220 * 24% Race7 66,266 * 66,699 * 24% 21,141 * 28% 45,557 * 22% Race8 46,703 * 41,649 * 15% 13,979 * 19% 27,670 * 14% Race9 62,018 * 58,835 * 21% 17,962 * 24% 40,873 * 20% Race10 69,749 * 72,547 * 26% 22,583 * 30% 49,964 * 24% Race11to13 92,871 * 96,118 * 34% 26,911 * 36% 69,208 * 34% Wednesday -4,788 -5,286 16,223 * 22% -21,509 * -11% Friday 39,687 * 40,647 * 15% 9,710 * 13% 30,937 * 15% Saturday 86,976 * 86,944 * 31% 29,769 * 40% 57,174 * 28% Sunday 54,039 * 54,337 * 19% 30,815 * 41% 23,522 * 12% Monday 41,483 * 39,708 * 14% 37,052 * 49% 2,656 May 43,254 * 43,233 * 15% 5,054 * 7% 38,179 * 19% June 72,975 * 72,179 * 26% 13,211 * 18% 58,968 * 29% July 82,115 * 83,846 * 30% 12,803 * 17% 71,043 * 35% August 86,201 * 85,619 * 31% 9,117 * 12% 76,502 * 38% September 76,684 * 77,557 * 28% 3,051 74,506 * 37% October 26,451 *** 28,841 ** 10% -8,974 * -12% 37,815 * 19% November 44,695 * 42,547 * 15% -9,562 * -13% 52,109 * 26% December 56,043 * 55,984 * 20% -4,793 60,776 * 30% NYminus5 -7,988 -12,526 79 -12,605 NYminus4 -49,707 * -50,454 * -18% -11,283 * -15% -39,172 * -19% NYminus3 -19,006 *** -18,647 *** -7% -905 -17,742 ** -9% NYminus2 -23,611 -25,573 -2,502 -23,071 NYminus1 -56,763 * -56,839 * -20% -8,609 *** -11% -48,230 * -24% NYzero -100,725 * -95,395 * -34% -21,281 * -28% -74,114 * -36% NYplus1 -60,736 * -68,004 * -24% -10,387 * -14% -57,617 * -28% NYplus2 -40,439 * -37,848 * -14% -5,224 ** -7% -32,624 * -16% NYplus3 -29,900 * -27,282 * -10% -4,846 *** -6% -22,436 * -11% NYplus4 -4,258 -8,134 5,210 -13,344 NYplus5 -31,455 * -32,850 * -12% -2,668 -30,183 * -15% PURSES MODEL RACE CONDITIONS MODELS All Sources HMA Export *statistical significance at better than 0.01 (99%) level, **statistical significance at better than 0.05 (95%) level, ***statistical significance at better than 0.10 (90%) level
  • 23. Econometric Models of Wagering on the Woodbine 2011 Thoroughbred Race Product S. Koch – March 2012 Page 16 of 25 Figure 1. Field size exhibits a positive impact on All Sources Handle, holding all other variables constant at their average (ceteris paribus). Marginal handle gains soften as the field approaches its maximum size. Figure 2. Increasing field quality via race conditions brings rewards to All Sources handle, ceteris paribus. Percentage figures identify All Sources wagering gains relative to having carded the respective condition rather than a low level claiming field. 6.0% 6.4% 6.7% 7.3% 7.9% 8.6% 9.2% 9.9% 10.5% 11.1% 11.8% 12.4% 3 4 5 6 7 8 9 10 11 12 13 14 N um ber of Betting Interests AverageAllSourcesHandle M arginal b enefit to averag e handle of having ad ded one ad ditional betting interest 0% 192.8% 75.5% 51% 34.1% 21.9% 30.1% 17.7% 11.3%7.2%7.60%6.7% C laim ing 4 C laim ing 5A llow ance 1A llow ance 5A llow ance 4A llow ance 3A llow ance 2 O vernightStake Scheduled Stake G rade III G rade II G rade IorM ajorR ace Race Conditions (Claiming 1, 2, 3 and 5 = 0%) AverageAllSourcesHandle
  • 24. Econometric Models of Wagering on the Woodbine 2011 Thoroughbred Race Product S. Koch – March 2012 Page 17 of 25 Race Events Woodbine races executed on holidays or other prime dates benefit All Sources handle, ceteris paribus. The opening weekend of the racemeet in 2011 corresponded to a $41,564 (15%) boost over the average racedates through the rest of the year. Good Friday and July 1st (Canada Day holiday) lift wagering $67,733 (24%) and $110,079 (39%), respectively, over average racedates. Races executed on the same card as the year’s Grade I and three other major races benefit handle $105,795 (38%) per race. Finally, on an all-sources basis we find no statistically significant relationship between handle and races run on a Breeders’ Cup Championship or Triple Crown date. In our alternate analyses of the HMA and Export handle streams it is remarkable to observe the differing response to the holiday or special racedates. HMA and Export customers seem to receive opening weekend with similar enthusiasm as the respective streams boost wagering 13% and 16%. More sizable percentage variance in customer responses to holidays/events can be found on Good Friday (42% boost HMA, only 18% for Export), July 1st (53% HMA, 34% Export) and undercard races on Woodbine’s Gr I or major racedates (53% HMA, 32% Export). Breeders’ Cup or Triple Crown dates show a zero response, positive or negative, from Export customers but a 12% positive response from the HMA. This result seems to bear out that HMA customers are enticed to wager on Woodbine perhaps as a complementary product on these major industry dates but for the more removed Export customers Woodbine gets relatively eclipsed thus mitigating any foreign benefits. Race Condition Restrictions The details internal to the conditions of a race that do not necessarily define quality but rather are just that, conditions of the event, do not seem to have effects on wagering. For all of the models presented in Table 4 we find the variables Age2yo, Furlongs, Maidens and Turf statistically insignificant in their isolated relationships with handle. That is, the influence of two-year-old restricted races, the increasing or decreasing distance of a race and the incidence of events run on the turf course all are not different than zero in their influences on wagering totals. It seems that either these variables are non-factors to total wagering decisions or that for each individual customer’s preference for or against these particulars there is a corresponding customer with a counter-preference. The filly and mare race restriction returns a likewise statistically insignificant result for the All Sources and HMA models but is statistically significant in the Export model. We find that filly and mare restricted races benefit Export handle 2.2%. For the results on the Turf variable we recommend that the positive average handle impacts of turf races is more likely born out by the field size control variable as suggested earlier in the ‘Data’ section of this document. Races originally programmed for the turf course but then removed to the main track due to track conditions or other factors indeed create a 9% disruption, or $24,829 loss, to All Sources wagering, ceteris paribus. The home customer (-6%) is slightly more forgiving than is the Export customer (-10%). This estimate carries out only the losses due to the surface switch as if the field size were constant. However, an even greater wagering loss from off-the-turf racing of course is contained in the reduction of field size as illustrated in Figure 1. All models, consistent with expectations, produce a statistically significant and negative estimate for the ONSired variable. Collectively, Woodbine customers trim wagering 5% on Ontario Sired restricted races after having controlled for other important factors. Export customers seem the harsher critics as they pull back 6% compared to the HMA customer’s more lenient 3% pullback.
  • 25. Econometric Models of Wagering on the Woodbine 2011 Thoroughbred Race Product S. Koch – March 2012 Page 18 of 25 Foreign Exchange The U.S./Canada foreign monetary exchange rate proves relevant to the value of wagering on the Woodbine races. This variable presents a statistically significant and positive relationship with All Sources handle. That is, as the U.S. dollar increases in its ability to purchase Canadian dollars so too does handle increase. This result does not so much suggest that U.S. wagering increases but that the value of U.S. wagering in Canadian pools increases. Not surprisingly the foreign exchange rate is statistically insignificant to HMA wagering. Its entire effect is felt in the Export econometric wagering model. Note that the parameter estimate, due to the construction of the variable, misleads by a factor of 100. The parameter estimate and the related percentage relationship should be divided by 100 to reflect the impact of a penny movement in foreign exchange rather than the implausible $1.00 relationship seen in Table 4. Hence, we determine that a one-cent increase in the exchange value of the U.S. dollar relates to a 1.3% or $2,733 increase in Export sources wagering value. Weather Ceteris paribus, we find that temperature through the year plays the leading role amongst the weather variables for increasing wagering. A one degree Celsius gain in temperature relates to a 0.4% improvement in All Sources wagering. Or, we can say that a ten degrees Celsius gain at the host track pushes up All Sources wagering by 4% or $12,400. It is interesting that on a percentage basis the Export customer base is more responsive to temperature, 5% per each ten degrees, than is the HMA customer at 3% per ten degrees. Perhaps an unaccounted for market or seasonal factor attempts to expose itself herein. The WeatherWind variable shows a zero relationship with handle in the All Sources and Export models but a HMA wagering loss of 1% for each 10 km/hr increase in the day’s high windgusts. Finally, a day’s total precipitation, WeatherPrecip, returns statistically insignificant for all models. Scheduling of Races In Figure 3 we map each of the Race# dummy variables for all three wagering streams across the horizontal with the vertical axis reflecting wagering growth. Race one, being our basis of comparison, equals a zero impact on growing average wagering. We observe relatively rapid wagering growth through the early part of the card and reaching a high plateau at races five, six and seven. Race eight presents a previously unseen scenario where wagering in each of the streams tumbles. However the late races seem to quickly regain their strength. The show of late race wagering strength is consistent with racetrack management experience and earlier econometric analyses. We must note here that our representation of ‘average’ racecard is limiting in its usefulness to management as different times of day (afternoon or evening scheduled cards), parts of the week (weekday, weekend) and variations in number of races per card may alternatively impact wagering flows. What seems new in our results over previous studies is the weakness at race eight or, viewed alternately, the relative strength of races four through seven. We propose that the latter mentioned alternate view is the more correct. Races four through seven have perhaps inherited stature from Woodbine’s full-year marketing push on the much favoured ‘Early Pick-4’ betting pool. We additionally identify that races six and seven positively benefit from their position as the most common races for the ‘Early Pick-4’ and the ‘Late Pick-4’ (always the last 4 races on a card, only offered when card contains nine or more races) to overlap. This overlap creates a pool doubling effect on these observations directly boosting the per-race handle for that observation. For example,
  • 26. Econometric Models of Wagering on the Woodbine 2011 Thoroughbred Race Product S. Koch – March 2012 Page 19 of 25 we find in the data that the average All Sources ‘Early Pick-4’ pool per race is $21,579 while the ‘Late Pick-4’ averages $13,262 per race so that we can value the average incidence of this pool doubling at $17,421 (($21,579 + $13,262)/2) or 6.2% of total All Sources handle. The obvious modeling solution would be a binary variable that equals 1 for observations with overlapping Pick-4 pools and 0 otherwise. However we find this variable to have a very high correlation with the Race7 (0.63) and less so on Race6 (0.12) race order variables therefore collectively threatening multicollinearity. We omit the ‘overlap’ variable and instead make a notation in Figure 3 (notice the ‘**’ on race number six and seven) to indicate the average overlapping Pick-4 pool structural affect on race six and race seven handle observations. Finally, in Figure 3 we acknowledge that the incidence of the rolling Pick-3 pools offers a very small altering effect on the econometric model results for Race2 (notice the ‘*’ on race number two). Woodbine offers rolling Pick-3’s throughout the card. Referring back to our ‘Data’ section, we defined Handle as sum of all single-leg pools plus an equal share of any multi-leg pools that included the respective race. So by this definition there is a modeled disadvantage to the Race2 variable of 2% ($5,472) all sources (or 1.3%, $2,574 for Export and 3.8%, $2,898 HMA) for the absence of an earlier Pick-3 pool. Referring back to Table 4 we identify that this 2% (or 1.3% Export and 3.8% HMA) improves the absolute value of Race2. We have therefore mechanically added this theoretical missing average Pick-3 pool into the Race2 variable as graphed in Figure 3. Figure 3. Wagering from each source strengthens through race seven (perhaps showing some relationship to ‘Early Pick-4’ promotion factors) falters at race eight but rallies through the last race of the average card, ceteris paribus. *Race number two is corrected for the Pick-3 structural disadvantage. **The rectangle over races six and seven indicates the possible All Sources range of structural increases due to overlapping Pick-4 effects. 1 2* 3 4 5 6** 7** 8 9 10 11 to 13 Race Number AverageHandle All Sources Export HMA
  • 27. Econometric Models of Wagering on the Woodbine 2011 Thoroughbred Race Product S. Koch – March 2012 Page 20 of 25 Handle behaves differently across the various bases of customers on different days of the week, all else held constant. In Figure 4 we exhibit the isolated benefits and losses to average wagering for each day of the week and per wagering source. In the first series, on the left of Figure 4, we view All Sources model output with clear wagering maximums for Saturday followed not so closely by Sundays, Friday and Mondays. We notice that on an All Sources basis that Wednesdays are not different than Thursdays in their wagering strength. The HMA customers, analyzed separately in the middle series of Figure 4, show a greater appreciation for Wednesday cards by wagering 22% stronger than on a Thursday. Saturdays and Sundays are 40% and 41% better than Thursdays for the HMA. And it is logical that Mondays receive highest regards from the HMA as these relatively unusual racedates coincide with Canadian statutory holidays. The Export customers exhibit less but still statistically significant reaction to the changing days of the week as we can see in the right-side series of Figure 4. Export customers actually seem to prefer Thursday afternoon cards over the Wednesday evening cards by a handle margin of 11%. Export wagering is strongest on Saturdays followed distantly by Fridays and then Sundays. It is notable that Mondays, coinciding with a holiday for Canadians but not necessarily for Americans or other nations, shows zero handle benefits relative to Thursdays for the Export bettors. Having identified that the HMA and Export customers exhibit conflicting preferences for Wednesdays versus Thursdays we investigate which day earns greater revenues for Woodbine. We apply after-purse wagering commissions as discussed in the ‘Data’ section of this article (8% HMA and 3% Export) to the respective Table 4 parameter estimates for Wednesday and Thursday. We determine that Wednesdays out-earned Thursdays in 2011 by $653 per race: (8% * $16,223 = $1,298) + (3% * -$21,509 = -$645) = $653. Continuing this course, we rank the days of the week based upon estimated sum of HMA and Export commissions to find that Saturdays outperform Sundays by 30%, followed by Fridays, Wednesdays and then Thursdays. Mondays rank behind Sundays, ahead of Fridays, being mostly advantaged by HMA holiday effects. The next series of independent variables tests for seasonal business trends across the months of the racing year. In general we find that April, being the ‘zero’ month by analysis design, was indeed a relatively weak wagering month. The graph in Figure 5 shows that wagering generally gained strength through the summer but the fall months of October and November presented substantial declines. While HMA and Export wagering followed the same pattern of rise and fall we notice that HMA led Export into the fall trough and that Export recovered into December earlier than did HMA. The model output for the New York minutes series of dummy variables confirms our expectations that, as a group, customers forced to choose will favour New York over the nearby Woodbine race, all else held constant. We can visualize in Figure 6 that the losses in Export wagering due to overlapping posttimes outrun the HMA losses on a percentage basis. Next we find that the worst posttime placement for Woodbine is immediately within the same minute, plus or minus, as a New York race (NYzero) where handle losses compared to average come to 34% for All Sources (or 28% HMA, 36% Export). After NYzero we find that the Woodbine races fare better if slightly after a New York race (NYminus…) rather than immediately before its New York counterpart (NYplus…). This result is consistent with previous studies executed by Woodbine management albeit with slightly messier results. For example, we find the output on NYminus4, NYminus2 and NYplus5 variables do contrast with a priori expectations of improved wagering as races move away from posttime competitors. We suspect a hidden structural element within the NY minutes observations is at play but we do not speculate herein what this hidden element might be.
  • 28. Econometric Models of Wagering on the Woodbine 2011 Thoroughbred Race Product S. Koch – March 2012 Page 21 of 25 Figure 4. Wagering gains and stalls across the different days of the week. Thursdays serve as the basement observation by which we compare all other dates on a percentage basis. Figure 5. Wagering, ceteris paribus, trended strongest through the summer months but hit a trough in October and November. HMA wagering declines in the fall were relatively substantial. -15% -5% 5% 15% 25% 35% April May June July August September October November December PercentageAverageHandleGains/Losses relativetoApril=0 All Sources Export HMA 0% 22% 15% 13% 15% 31% 40% 28% 19% 41% 12% 14% 49% 0%-11% ALL SOURCES HMA EXPORT PercentageAverageHandleGains relativetoThurdays=0 Wed Fri Sat Sun Mon
  • 29. Econometric Models of Wagering on the Woodbine 2011 Thoroughbred Race Product S. Koch – March 2012 Page 22 of 25 Figure 6. Overlapping posttime with New York proves detrimental to wagering on Woodbine races. Woodbine races that run on top of (NYzero) or just before a New York race (NYplus) fare worse than their counterparts that run just after a New York race (NYminus). CONCLUSIONS Bettors’ collective preferences drive per-race handle. The more that a race’s numerous characteristics are collectively appealing then the more will the customers invest. The racetrack manager must understand these preferences as a requirement to maximize revenue per race and through the racing season. This unique analysis provides empirical evidence of what per-race variables play key to the wagering decision, and in what magnitudes, all while isolating the various impacts from co-mingling factors. Important predictors of All Sources, HMA and Export handle include field size, quality of field, certain race conditions restrictions, international foreign exchange factors, weather, and race scheduling decisions ranging from monthly down to the minute. Field size is not the single most overwhelming predictor of handle amongst this broad analysis. But within any single racedate, lacking major race events and where dates are inflexible then field size has again been empirically identified as a primary handle driver. We have also empirically confirmed that there are decreasing rewards to add horses to a growing field. The Racing Secretary, adds more value to ‘hustle’ a sixth horse for the five horse field than to exercise same hustle for an eleventh horse to a ten horse field. That said, adding to either field is a positive exercise. -35% -25% -15% -5% N Y m inus5 N Ym inus4 N Y m inus3 N Y m inus2 N Y m inus1 N yzero N Yplus1 N Y plus2 N Y plus3 N Yplus4 N Y plus5 PercentageAverageHandleLosses All Sources Export HMA
  • 30. Econometric Models of Wagering on the Woodbine 2011 Thoroughbred Race Product S. Koch – March 2012 Page 23 of 25 There are clear disadvantages to handle from carding low quality race class conditions. Alternatively, the racetrack that can maximize the average quality of its fields will benefit, perhaps substantially. We prefer the model specification where we distill actual race conditions into a series of dummy variables. This model provides a more detailed picture with which to communicate to the horseracing industry the relationships of race conditions and wagering. Future analyses may consider a more extensive approach to this same design. The Purses specification, on the other hand, proves to correlate nicely with race conditions and seems a relevant proxy for race conditions for future analysts lacking specific race conditions data. We must repeat our earlier warning though – the purses approach may go awry if misapplied to data ranging across racetracks or years where like race conditions can run for differing purses or ranges of purse. Holidays and other known prime racedates serve on average as an opportunity for increased handle and should be welcomed in any racedates planning exercise. Opening weekend, Good Friday, and July 1st all relate to handle boosts for all wagering streams. There is a similar effect on Monday (statutory holiday) racecards as discussed in the Race Scheduling section of this article. We find that industry events such as Breeders’ Cup Championship and Triple Crown racedates do spur HMA customers’ wagering but exhibits a zero effect from our Export markets. Finally, we find that undercard races on Woodbine’s five major race event dates provide a substantial handle generating opportunity. This unsurprising result does imply that these opportunities should be maximized by the racetrack. Our model outputs show that several restrictions internal to the conditions of a race show no statistical, isolated relationship with wagering. The industry needs not therefore overthink two- year-old, maidens and the incidence of turf as a strategic pursuit to maximize wagering. These variables imprint on wagering ultimately through field size as they, at their root, exist for the Racing Secretary to maximize horse supply as a racecard input. Once carded, however, turf races later removed to the main track indeed diminish handle. This off-the-turf relationship with wagering likely relates to the customer ‘disservice’ aspects of the late change. Filly and mare restrictions have a curious positive relationship with Export wagering but this relationship gets lost from an All Sources and HMA perspective. Ontario-sired race restrictions exhibit 5% wagering pool losses. This economic development project likely provides useful benefits to the supply side of the industry but negatively relates to product demand, particularly for Export wagering customers. Foreign exchange rates inflict gains/losses on the value of Export wagering in the Woodbine pools. The incidence of strong Canadian dollars actually serves detriment on Export revenues to the racetrack. Weather provides a most uncontrollable impact on handle. The positive relationship between handle and temperature perhaps bears some seasonal relationships but there remains intra- day relevance to this factor as well. Days exhibiting high wind gusts bring 10% wagering losses per each 10 km/hr to the home market customers but those gusts are not felt by the Export customers. Careful scheduling of races can profit the diligent racetrack. Within a racecard we find that wagering increases from the early races and through the ‘Early Pick-4’ (races four through seven) but slows at race eight. After the eighth race wagering returns to earlier strength and gains through the end of the card. We recommend that the eighth race slowdown likely relates more to strength in the ‘Early Pick-4’ due to related marketing initiatives. We do not confuse the significant wagering uptick at races 11 to 13 to completely reflect a last race upsurge. Rather the rare incidences of races 11 to 13 tend to complement major race event dates which may bias the estimate on this variable. A downfall to this analysis lies in the equal treatment of each day of the week. Future projects include
  • 31. Econometric Models of Wagering on the Woodbine 2011 Thoroughbred Race Product S. Koch – March 2012 Page 24 of 25 limiting the data to individual days of the week to test for differences in racecard progression on Wednesday night cards or maybe Thursday/Friday late-afternoon cards versus other days’ 1pm cards. Across the days of the week we find differences in wagering strength depending on the market source of the handle. Weekend racing clearly offers the maximum opportunities for Woodbine across all handle streams. HMA customers prefer Wednesdays over Thursdays while the Export punishes Wednesdays relative to Thursdays. We apply racetrack commission rates to the respective parameter estimates to identify that Saturdays are the strongest revenues earning racecards followed by Sundays, Friday, Wednesdays and then Thursdays. Monday racecards rank behind Sundays, ahead of Fridays, being mostly advantaged by HMA holiday effects. The general business gains and declines observed throughout year 2011 are born out in the analysis through the series of months’ dummy variables. The market showed built up relative strength by July through September and receded in October and November. On a percentage basis we find the fall-time wagering recession for Export to have been slower and less dramatic than the HMA experience. Based upon this single year analysis we do not conclude optimal racing months for future planning purposes. Applying this analysis to race observations across several years would abet this sort of decision-making. Woodbine’s longtime obsession with avoiding posttime overlaps with competing racing products, New York in particular, proves relevant in the NY minutes series of variables. Recent years have seen Woodbine reach high success with this complicated initiative thus limiting the regular incidence of observations for this test. We suspect this limitation of incidence has introduced some structural oddities to the data thus inviting the awkward results on the NYminus4 and NYplus5. Nonetheless, the pattern holds throughout that Woodbine is correct to avoid posttimes overlap and should prefer to run its race just after rather than just before a competing product. REFERENCES Chezum, B. and B. Wimmer. “Evidence of Adverse Selection from Thoroughbred Wagering.” Southern Economic Journal. 66 (2000, 3):700-714. DeGennaro, R. (1989) The Determinants of Wagering Behavior, Managerial and Decision Economics, 10, 221-28. Koch, Stephen I., “Estimating Bettors’ Demands and Preferences for the Woodbine Racing Product.” Woodbine Entertainment Group. 21, August, 2003. Koch, Stephen I., “Estimating Bettors Preferences for the Woodbine Thoroughbred Product: An Alternative Specification (in brief).” Woodbine Entertainment Group. 10, September, 2003.
  • 32. Econometric Models of Wagering on the Woodbine 2011 Thoroughbred Race Product S. Koch – March 2012 Page 25 of 25 Koch, Stephen I. , “Separate Estimations of WEG and Non-WEG Off-Track Wagering Patterns On the Woodbine Thoroughbred Product (brief).” Woodbine Entertainment Group. 23, September, 2003. Koch, Stephen I., “Woodbine Live Standardbred Product – Hedonic Handle Model.” Woodbine Entertainment Group. 29, October, 2003. Koch, Stephen I., “Estimating Wagering Patterns For the 2003 Woodbine Thoroughbred Product (summary)” Woodbine Entertainment Group. 21, November, 2003. Koch, Stephen I., “A Hedonic Model of All-Sources, Single-Leg Wagering on the Woodbine 2009 Standardbred Races.” Woodbine Entertainment Group. 11, July, 2010. Koch, Stephen I., “Wednesday night posttimes.” Woodbine Entertainment Group, internal memo. 27, August, 2011. Koch, Stephen I., “Woodbine Live Thoroughbred – Race Scheduling vs NYRA”. Woodbine Entertainment Group, internal memo. 5, September, 2011. Ray, Margaret., “An Economic Analysis of Pari-mutuel Race Competitiveness.” University of Arizona, Racetrack Industry Program. http://www.ua- rtip.org/industry/research/economic_analysis_pari.pdf Ray, Margaret. “Determinants of Simulcast Wagering: The Demand for Harness and Thoroughbred Horse Races.” University of Arizona, Racetrack Industry Program. http://www.ua- rtip.org/industry/research/simulcast_wagering.pdf Ray, Margaret. “Taking Handle into Account: An Economic Analysis of Account Betting.” University of Arizona, Racetrack Industry Program. http://www.ua- rtip.org/industry/research/economic_analysis_account.pdf Ray, Margaret., “What Are the Odds You’ll Bet On a Race? Determinants of wagering demand at a Thoroughbred Racetrack.” University of Arizona, Racetrack Industry Program. http://www.ua- rtip.org/industry/research/odds.pdf CONTACT THE AUTHOR: Stephen Koch Vice President – Thoroughbred Racing Woodbine Entertainment Group SKoch@WoodbineEntertainment.com 888-675-7223 ext. 2652