
Recommandé
Recommandé
Contenu connexe
Tendances
Tendances (18)
En vedette
En vedette (11)
Similaire à FRTB Technology Overview
Similaire à FRTB Technology Overview (20)
Dernier
Dernier (20)
FRTB Technology Overview
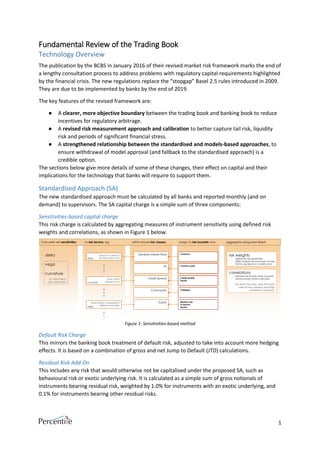
- 1. 1 Fundamental Review of the Trading Book Technology Overview The publication by the BCBS in January 2016 of their revised market risk framework marks the end of a lengthy consultation process to address problems with regulatory capital requirements highlighted by the financial crisis. The new regulations replace the “stopgap” Basel 2.5 rules introduced in 2009. They are due to be implemented by banks by the end of 2019. The key features of the revised framework are: ● A clearer, more objective boundary between the trading book and banking book to reduce incentives for regulatory arbitrage. ● A revised risk measurement approach and calibration to better capture tail risk, liquidity risk and periods of significant financial stress. ● A strengthened relationship between the standardised and models-based approaches, to ensure withdrawal of model approval (and fallback to the standardised approach) is a credible option. The sections below give more details of some of these changes, their effect on capital and their implications for the technology that banks will require to support them. Standardised Approach (SA) The new standardised approach must be calculated by all banks and reported monthly (and on demand) to supervisors. The SA capital charge is a simple sum of three components: Sensitivities-based capital charge This risk charge is calculated by aggregating measures of instrument sensitivity using defined risk weights and correlations, as shown in Figure 1 below. Figure 1: Sensitivities-based method Default Risk Charge This mirrors the banking book treatment of default risk, adjusted to take into account more hedging effects. It is based on a combination of gross and net Jump to Default (JTD) calculations. Residual Risk Add-On This includes any risk that would otherwise not be capitalised under the proposed SA, such as behavioural risk or exotic underlying risk. It is calculated as a simple sum of gross notionals of instruments bearing residual risk, weighted by 1.0% for instruments with an exotic underlying, and 0.1% for instruments bearing other residual risks. to risk factors, eg: Assign to risk buckets and aggregate using prescribed:within broad risk classes. Issuer credit spread curve Calculate net sensitivities General Interest Rate FX Credit Spread Commodity Equity for instruments with optionality Currency Credit quality Sector Category Currency pair Market cap Economy Sector correlations • between risk factors within a bucket. • across buckets within a risk class. For each risk class, take the worst case of low, medium and high correlation scenarios. Tenors on currency risk-free yield curvedelta Equity option underlying at different maturitiesvega • delta • vega • curvature Issuer credit spread curvecurvature risk weights • applied to net sensitivities. • reflect relative risk of buckets and risk factors, eg tenors on a yield curve.
- 2. Fundamental Review of the Trading Book | Technology Overview 2 Internal Models Approach (IMA) The revised internal models approach introduces a more complex risk calculation and a more rigorous model approval process, which is applied at the trading desk level. Any desk that fails controls on backtesting performance and P&L attribution will fall back to the standardised approach, which may also act as a floor or surcharge to approved desk capital charges. Securitisations are no longer eligible to be capitalised under the internal models approach and must use the standardised approach. The IMA capital charge comprises: Default risk charge This is calculated as the 99.9% VaR of a one year default simulation with two types of systematic risk factor, to be reported weekly. Approved desk capital charge The approved desk capital charge has two components: a modellable risk charge, based on a modified expected shortfall calculation (see Figure 2), and a non-modellable risk charge, which is capitalised with a stress scenario that is at least as prudent as the equivalent ES calculation. The capital charge is floored at a multiple of the average capital charge over the last 60 days, with a conservative multiplier for the modellable risk component of between 1.5 and 2, depending on backtesting performance. Figure 2: Global Expected Shortfall calculation Capital Impact While the final calibration produces lower overall capital requirements than earlier versions, results in the explanatory note1 show there is still potential for considerable changes (generally increases) in capital requirements under the new regime. Compared to the current framework, the new framework shows approximately a 22% increase in median total market risk capital requirement and 40% increase in weighted average capital requirement. The gap between standardised and internal models approaches can still be significant (40% higher for the median bank, 200% higher at the 75th percentile), so the incentive to invest in the more complex internal models approach remains. 1 https://www.bis.org/bcbs/publ/d352_note.pdf Potentially 5×3×6=90 revaluations, although many combinations are not valid. Base calculation 97.5% 10-day (overlapping) Expected Shortfall Full revaluation Adjust for liquidity Combine total ES with partial ES values, scaled up to each liquidity horizon Calibrate to period of stress Combine three ES values to produce stress period with full set of risk factors Disallow some diversification Calculate equally-weighted average of total and non-diversified (sum of partial) ES values total ES value with shocks to all risk factors 12 month period of greatest stress, with a reduced set of risk factors. Current 12 month period, with a reduced set of risk factors. Current 12 month period, with the full set of risk factors. total ES value with shocks to all risk classes 4 partial ES values with shocks to subsets of risk factors with liquidity horizons of at least 20 days, 40 days etc. 5 partial ES values with shocks to one of the regulatory risk classes
- 3. Fundamental Review of the Trading Book | Technology Overview 3 Technology Impact The revised framework introduces a number of challenges to banks’ risk IT infrastructure. Enterprise-wide aggregation Following on from the principles for risk data aggregation2 , the new regulation introduces further requirements on aggregation of data from business and technology silos into a firm-wide view of risk that can be reported to the regulator. The added complexity of the aggregation step takes emphasis away from the Front Office or risk models that price scenarios and calculate sensitivities and transfers it to centralised risk aggregation components. Unless a bank is operating a single Front Office system with a self-contained capital calculation, integration will be required at a finer level of detail than for existing regulation; it will no longer be as simple as adding together P&L vectors generated by isolated systems to calculate firm-wide VaR. Scalability One of the clearest impacts is the increase in scale and complexity of the IMA risk measure calculation. Table 1 compares the processing/storage requirements of a sample portfolio under the internal models approach between the current framework (revised Basel II) and FRTB. FRTB framework Jan 2016 Revised Basel II framework Dec 2010 Positions 100,000 Instruments from all the broad risk classes and their derivatives. Market risk measure Expected Shortfall (daily) Value at Risk (daily) Stressed Value at Risk (weekly) Risk factor combinations 21 valid combinations of liquidity horizon and risk class 1 total scenario Scenarios 250 ES 1 year time horizon 3 sets of scenarios to calibrate to a period of stress 500 VaR 2 year time horizon 500 Stressed VaR 1 year time horizon with antithetical scenarios Total scenario valuations 100,000 x 21 x 3 x 250 = 1,575,000,000 (daily) Full revaluations 100,000 x 1 x 500 = 50,000,000 (daily) 100,000 x 1 x 500 = 50,000,000 (weekly) Data volume Based on one result using 20 bytes ~600GB (monthly) ~25GB (monthly) Table 1: Comparison of FRTB with current internal models approach While storage is relatively cheap and easy to scale, the requirement to do multiple full revaluations of each instrument on a daily basis may begin to push the limits of existing infrastructure. There is however scope to reduce the scale of FRTB calculations: ● Only a small fraction of the 21 combinations of risk factors will apply to each individual position, so many redundant valuations can be eliminated if pricing is distributed in an intelligent way. ● If there is 10 years of history for the full set of risk factors, repricings using the reduced set of factors can be omitted - effectively applying the full set to the stress period directly and reducing calculations by a factor of three. In the hypothetical portfolio exercise at least, this is the approach many banks took. Data governance The standardised approach in particular relies on detailed position and instrument data to correctly allocate risk buckets and identify risk factor sensitivities. Metadata such as industry sector or market capitalisation, which may have played a secondary role in day-to-day risk management, now 2 http://www.bis.org/publ/bcbs239.pdf
- 4. Fundamental Review of the Trading Book | Technology Overview 4 becomes key in regulatory capital calculations. For some risk classes, unclassified positions are allocated to the other bucket, which attracts the highest risk weighting and does not benefit from diversification or hedging effects with other buckets. This underscores the need for robust processes to collect and manage data. A key component is the automation of data gathering and validation, which can greatly reduce the amount of manual data entry (and its associated errors) and free up risk management and data groups. For the internal models approach, this also applies to historical market data, which is orders of magnitude larger, but its numerical nature lends itself better to programmatic approaches to identify and correct errors. These will be important to meet the requirements on data freshness set out in the regulations: data sets for current observations must be updated at least once every month and be flexible enough to allow more frequent updates. There will always need to be human intervention for some aspects of data management, but a scalable solution will reduce this to only those cases where it is vital, eg where automated processes cannot differentiate with any confidence an extreme data point from an incorrect data point. Implementation approach The scope of the required changes makes the decision on how to tackle the implementation an important one. A short-termist approach that does the bare minimum to comply with the new regulation is unlikely to be flexible enough to handle likely revisions to the framework (following further impact studies in 2016) and new regulations such as FRTB-CVA. With the growing importance of regulatory calculations, an inflexible system could also prove to be a barrier to new business and new technology. In light of this implementation burden, simple ideas such as sharing risk technology infrastructure across standardised and internal models approaches or reusing Front Office models for risk pricing will be important in making these projects feasible. Percentile provides software for integrated and holistic risk management in capital markets, to deliver faster regulatory compliance and reduce operational risk while lowering costs. Percentile’s flexible and scalable RiskMine platform has evolved over 10 years to meet the ever-increasing regulatory burden. www.percentile.co.uk info@percentile.co.uk @pcentile