SlideShare une entreprise Scribd logo
1  sur  8
Télécharger pour lire hors ligne
UK Labour Market	 8th
October 2013
The most up-to-date source of monthly UK labour market data and analysis
Report on Jobs
1998 1999 2000 2001 2002 2003 2004 2005 2006 2007 2008 2009 2010 2011 2012 2013
25
30
35
40
45
50
55
60
65
70
75
Temp/Contract	Billings
Permanent	Placements
Increasing rate of decline
Increasing rate of growth
50 = no change on previous month
Staff Appointments via Recruitment Consultancies
Staff appointments continue to rise
strongly in September
Commenting on the latest survey results, Bernard Brown, Partner and Head of Business
Services at KPMG, said:
“With another month of data showcasing a strong rise in the number of appointments and
job offers on the table, it seems that business is warming to calls for investment from Mark
Carney. Improved market conditions, higher activity levels amongst clients and generally
stronger levels of confidence amongst employers are certainly one of the major factors
underpinning the latest rise in placements.
“Only last week the Bank of England argued that recovery will only be sustainable over the
long term if regions beyond London grow strongly. Against this backdrop it is also welcome
news to see permanent placements increase across the whole country. The North is
showing strongest growth, with the Midlands driving a rise in temporary placements. It’s
a sign that local economies are picking up and gives hope that economic recovery is not
dependent on one area or sector.
“Yet it remains worrying that employees are clearly still not sharing employers’ growing faith
in recovery. Demand for staff may be up, but the number of individuals putting themselves on
the market has dropped for the fifth consecutive month. Perhaps the pay on offer has to rise
to encourage staff to ‘make the move’. If it doesn’t we could be about to witness a growing
gap between what the employers need and what employees are prepared to do.”
Markit
Henley on Thames
Oxon RG9 1HG, UK
Tel: +44 1491 461000
Fax: +44 1491 461001
email: economics@markit.com
Copies of the report are available
on annual subscription from
Markit. For subscription details
please contact:
economics@markit.com
The Report on Jobs is a monthly
publication produced by Markit and
sponsored by the Recruitment and
Employment Confederation and KPMG
LLP.
The report features original survey
data which provide the most up-to-
date monthly picture of recruitment,
employment, staff availability and
employee earnings trends available.
1	Executive summary
2	Appointments
3	Vacancies
4	Sectoral demand
5	Staff availability
6	Pay pressures
7	Special feature
Key points from the September survey:
Marked increases in both permanent placements and temp billings
Permanent salary inflation sharpest since February 2008
Vacancies continue to rise at marked pace
Candidate availability falls further




Report on Jobs | Recruitment Industry Survey
The Report on Jobs is unique in providing the most
comprehensive guide to the UK labour market,
drawing on original survey data provided by
recruitment consultancies and employers to provide
the first indication each month of labour market
trends.
The main findings for September are:
Strong growth of staff appointments
maintained...
Recruitment consultants signalled a further substantial rise in
permanent staff placements during September. The pace of
expansion was only slightly slower than July’s 40-month high.
Temp billings similarly increased at a sharp rate, with growth
close to the 15-year high seen in August.
...supported by marked expansion
of vacancies
Demand for staff continued to increase strongly in September.
Growth of job vacancies was at a similar pace to that recorded
in August, which was the fastest for over six years.
Candidate availability continues to
fall...
September data indicated a further reduction in the availability
of candidates. Solid rates of decline were indicated for both
permanent and temporary staff availability.
...contributing to further increase in
pay rates
Permanent salary inflation quickened slightly in September,
reaching its sharpest rate since February 2008. Temp pay
inflation also accelerated, with the latest rise only marginally
slower than July’s five-and-a-half year high.
1 Executive summary
1998 1999 2000 2001 2002 2003 2004 2005 2006 2007 2008 2009 2010 2011 2012 2013
25
30
35
40
45
50
55
60
65
70
Staff Appointments
Temp/Contract	Billings
Permanent	Placements
25
30
35
40
45
50
55
60
65
70
50	=	no	change	on	previous	month 50=no	change	on	previous	month
1998 1999 2000 2001 2002 2003 2004 2005 2006 2007 2008 2009 2010 2011 2012 2013
35
40
45
50
55
60
65
70
Staff Availability and Earnings Growth
Skill	shortages
Average	permanent	salaries	(LHS)
90
80
70
60
50
40
30
50	=	no	change	on	previous	month 50	=	no	change	on	previous	month	(inverted)
inverted	-	RHS)
(Availability	of	staff
1998 1999 2000 2001 2002 2003 2004 2005 2006 2007 2008 2009 2010 2011 2012 2013
Temp/Contract	Vacancies
Permanent	Vacancies
50	=	no	change	on	previous	month
25
30
35
40
45
50
55
60
65
70
75 Increasing rate of growth
Increasing rate of decline
Demand for staff
All Intellectual Property Rights owned by Markit Economics Limited
Report on Jobs | Recruitment Industry Survey
Recruitment consultancies report on the number of
people placed in permanent jobs each month, and
their revenues (billings) received from placing people
in temporary or contract positions at employers.
Latest data from the survey of recruitment consultancies
pointed to further strong growth of staff appointments during
September.
Marked increase in permanent
placements
The number of people placed into permanent jobs continued to
rise in September, extending the current period of expansion to
12 months. The rate of growth was marked, having accelerated
since August to a pace only slightly below July’s 40-month high.
Improved market conditions, higher activity levels at clients and
generally stronger confidence among employers were reported
to have underpinned the latest rise in placements.
Permanent placements increased across all four monitored
English regions, with the North continuing to register the
sharpest growth.
Temp billings growth eases slightly
from 15-year high
September data signalled a further increase in agencies’
temporary/contract staff billings. Although moderating from the
15-year high posted in August, the rate of growth remained
strong.
The Midlands saw the fastest increase in temp billings
during September, while the South posted the slowest rise.
An index reading above 50 signals a higher number of
placements/billings than the previous month. Readings below
50 signal a decline compared with the previous month.
2 Staff appointments
1998 1999 2000 2001 2002 2003 2004 2005 2006 2007 2008 2009 2010 2011 2012 2013
25
30
35
40
45
50
55
60
65
70
75
Temp/Contract	Billings
Permanent	Placements
Increasing rate of decline
Increasing rate of growth
50 = no change on previous month
Staff Appointments via Recruitment Consultancies
2013	Apr	 38.9	 36.7	 24.4	 14.5	 57.2	 52.5
	 May	 39.2	 30.7	 30.1	 9.1	 54.6	 53.4
	 Jun	 47.9	 31.5	 20.6	 27.2	 63.6	 57.6
	 Jul	 48.9	 32.0	 19.1	 29.8	 64.9	 63.3
	 Aug	 37.8	 38.6	 23.6	 14.2	 57.1	 61.3
	 Sep	 49.0	 33.5	 17.4	 31.6	 65.8	 62.2
	 	 Higher	 Same	 Lower	 Net	 Index	 S.Adj.	
	           	 %	 %	 %	 +/-	 50 = no chg	 Index
Permanent Staff Placements
Q. Please compare the number of staff placed in permanent
positions with the number one month ago.
2013	Apr	 26.1	 42.7	 31.3	 -5.2	 47.4	 48.7
	 May	 34.8	 42.7	 22.5	 12.2	 56.1	 52.6
	 Jun	 41.3	 39.1	 19.6	 21.7	 60.8	 56.4
	 Jul	 46.6	 36.8	 16.6	 30.0	 65.0	 61.5
	 Aug	 44.4	 40.0	 15.6	 28.8	 64.4	 62.9
	 Sep	 43.1	 43.1	 13.8	 29.4	 64.7	 61.7
	 	 Higher	 Same	 Lower	 Net	 Index	 S.Adj.	
	           	 %	 %	 %	 +/-	 50 = no chg	 Index
Temporary/Contract Staff Billings
Q. Please compare your billings received from the
employment of temporary and contract staff with the
situation one month ago.
Report on Jobs | Recruitment Industry Survey
3 Vacancies
All Intellectual Property Rights owned by Markit Economics Limited
Recruitment consultants are asked to specify
whether the demand for staff from employers has
changed on the previous month, thereby providing
an indicator of the number of job vacancies. The
summary indexes shown in this page are derived
from the detailed sector data shown on page 5.
Further strong rise in vacancies
Demand for staff continued to increase at a marked pace
in September. The Report on Jobs Vacancies Index posted
63.5 in September, only slightly below the reading of 63.7 in
August, which was the highest for over six years.
Both permanent and temporary staff registered sharp rates
of demand growth in the latest survey period.
Public & private sector vacancies
Private sector demand for staff continued to rise at a
substantial pace in September. In the case of permanent
workers, the latest increase was the fastest since data were
first available in December 2011.
In the public sector, demand for temporary staff improved
at the sharpest rate in the series history, but permanent
workers saw a slight fall in demand for their services.
Other vacancy indicators
Data from the Office for National Statistics showed that job
vacancies were up 11.1% on an annual basis in the three
months to August.
Latest available data signalled that internet-based
recruitment spending rose by 2.3% in the first quarter of 2013.
That was down from a pace of 3.1% in the final quarter of
2012.
The Job Vacancies Index monitors the overall demand for
staff at recruitment consultancies. An index reading above
50 signals a higher number of vacancies than the previous
month. Readings below 50 signal a decline compared with the
previous month.
1998 1999 2000 2001 2002 2003 2004 2005 2006 2007 2008 2009 2010 2011 2012 2013
Temp/Contract	Vacancies
Permanent	Vacancies
50	=	no	change	on	previous	month
25
30
35
40
45
50
55
60
65
70
75
Increasing rate of growth
Increasing rate of decline
25
30
35
40
45
50
55
60
65
70
75
Job Vacancies
50	=		no	change	on	previous	month
Vacancy	Index
Increasing rate of growth
Increasing rate of decline
Job Vacancy Indicators
	 	 	 May’13	 Jun	 Jul	 Aug	 Sep  	
Job Vacancy Index (recruitment industry survey)
50 = no change on previous month	 			 	
Other key vacancy data
Annual % change
Sources: 	Job centre vacancies provided by Office for National Statistics
Internet recruitment spending provided by WARC.com
Total			 54.9	 59.2	 61.1	 63.7	 63.5
Permanent Staff	 54.9	 59.3	 61.0	 63.6	 63.6
Temporary Staff	 55.6	 58.0	 61.6	 64.0	 62.8
Public: perm		 46.7	 52.8	 47.6	 47.4	 49.1
Public: temp		 50.8	 50.0	 53.8	 51.6	 58.2
Private: perm		 64.9	 66.6	 67.1	 65.7	 68.7
Private: temp		 60.2	 63.9	 65.5	 66.3	 65.5
Job centre vacancies	 12.0	 12.9	 12.6	 11.1	 n/a	
Internet recruitment	 2.3	 --	 --	 --	 --	
Public & private sector vacancies (not seasonally adjusted)
Report on Jobs | Recruitment Industry Survey
Recruitment consultancies are requested to compare
the demand for staff according to sector with the
situation one month ago.
Permanent Staff
Demand rose for all nine categories of permanent staff
monitored by the survey in September. The strongest rate
of growth was signalled for Construction workers, closely
followed by Engineering staff. Hotel & Catering posted the
slowest rise.
4 Demand for staff by sector
50	=		no	change	on	previous	month
Demand for staff
20
30
40
50
60
70
80
90 Secretarial & Clerical
Perm
Tem p
2002 2003 2004 2005 2006 2007 2008 2009 2010 2011 2012 2013
20
30
40
50
60
70
80
90 Accounting & Financial
Tem p
Perm
2002 2003 2004 2005 2006 2007 2008 2009 2010 2011 2012 2013
2002 2003 2004 2005 2006 2007 2008 2009 2010 2011 2012 2013
20
30
40
50
60
70
80
90 Executive & Professional
Perm
Tem p
2002 2003 2004 2005 2006 2007 2008 2009 2010 2011 2012 2013
20
30
40
50
60
70
80
90 IT & Computing
Tem p
Perm
20
30
40
50
60
70
80
90
2002 2003 2004 2005 2006 2007 2008 2009 2010 2011 2012 2013
Tem p
Blue Collar
Perm
20
30
40
50
60
70
80
90
2002 2003 2004 2005 2006 2007 2008 2009 2010 2011 2012 2013
Nursing/Medical/Care
Tem p
Perm
2002 2003 2004 2005 2006 2007 2008 2009 2010 2011 2012 2013
20
30
40
50
60
70
80
90 Hotel & Catering
Tem p
Perm
Engineering; Construction
	 	 	This year (Last year)	
		 Rank	 Sep'13	 Rank	 Sep'12
	 	 	This year (Last year)	
	 	 Rank	 Sep'13	 Rank	 Sep'12
*Non-seasonally adjusted data. Prior to April 2013
Engineering/Construction was reported as a single category.
Data are presented in the form of diffusion indices whereby
a reading of 50 indicates no change on the previous month.
Readings above 50 signal stronger demand than a month
ago. Readings below 50 signal weaker demand than a month
ago.
Engineering*			 1	 66.6	 n/a	 n/a
Blue Collar			 2	 65.9	 (2)	 (54.2)
Nursing/Medical/Care		 3	 65.8	 (1)	 (62.5)
Construction*			 4	 62.2	 n/a	 n/a
IT & Computing			 5	 62.1	 (4)	 (51.9)
Secretarial/Clerical		 6	 61.8	 (3)	 (52.8)
Accounting/Financial		 7	 58.6	 (7)	 (48.4)
Executive/Professional		 8	 54.2	 (6)	 (48.7)
Hotel & Catering			 9	 54.0	 (5)	 (49.9)
Construction*			 1	 70.3	 n/a	 n/a
Engineering*			 2	 69.2	 n/a	 n/a
IT & Computing			 3	 67.3	 (2)	 (55.0)
Executive/Professional		 4	 63.9	 (5)	 (52.4)
Accounting/Financial		 5	 63.7	 (3)	 (53.8)
Secretarial/Clerical		 6	 61.9	 (4)	 (52.9)
Nursing/Medical/Care		 7	 61.3	 (1)	 (60.7)
Blue Collar			 8	 56.5	 (6)	 (50.0)
Hotel & Catering			 9	 56.1	 (7)	 (47.7)
Temporary/contract staff
Growth of demand was broad-based across all nine
temporary/contract staff sectors in the latest survey period.
Engineering workers were the most sought-after. Mirroring
the trend seen for permanent staff, the weakest growth was
signalled for Hotel & Catering employees.
46
50
54
58
62
66
70
74
78
Engineering Construction
Perm Tem p
Report on Jobs | Recruitment Industry Survey
Recruitment consultants are asked to report whether
availability of permanent and temporary staff has
changed on the previous month. An overall indicator
of staff availability is also calculated.
Availability of permanent staff
The availability of candidates to fill permanent job roles
deteriorated for a fifth consecutive month in September. The
rate of decline was little-changed from the solid pace recorded
in August.
All four English regions posted lower permanent staff
availability during September. The sharpest reduction was
signalled in London.
Availability of temp/contract staff
Temporary/contract staff availability continued to fall in
September. The rate of deterioration was broadly unchanged
from that signalled in the previous two months.
Temp availability fell across London, the Midlands and the
South, but was unchanged in the North.
5 Staff availability
1998 1999 2000 2001 2002 2003 2004 2005 2006 2007 2008 2009 2010 2011 2012 2013
Temp	Availability Permanent	Availability
50	=	no	change	on	previous	month
20
30
40
50
60
70
80
90Improving availability
Deteriorating availability
20
30
40
50
60
70
80
90
Staff Availability
50	=		no	change	on	previous	month
Staff	Availability	Index
Improving availability
Deteriorating availability
2013	Apr	 19.5	 61.1	 19.4	 0.1	 50.0	 50.1
	 May	 16.3	 64.1	 19.6	 -3.3	 48.4	 49.6
	 Jun	 15.5	 61.0	 23.6	 -8.1	 45.9	 48.3
	 Jul	 13.0	 56.3	 30.7	 -17.6	 41.2	 44.2
	 Aug	 13.9	 58.3	 27.8	 -13.9	 43.0	 45.7
	 Sep	 19.0	 51.6	 29.4	 -10.5	 44.8	 45.3
Key permanent staff skills reported in short supply:*
Accountancy/Financial: Accountancy, Banking, Finance,
Insurance. Blue Collar: Semi-skilled operators, Skilled
trades. Construction: Project managers, Quantity surveyors.
Engineering: Automotive, Design engineers, Electrical,
General engineering, Geotechnical, Heavy engineering,
Mechanical, Rail, Revit technicians, Structural, Subsea.
Executive/Professional: Business development, HR,
Marketing. Hotels/Catering: Chefs, Front of house. IT/
Computing: Business analysts, Cloud, Developers, Digital
marketing, GWT, Java, .Net, PHP. Nursing/Medical/Care:
Clinical diagnostics. Secretarial/Clerical: Legal secretaries,
Office support. Other: Customer service, Languages, Sales.
Key temp skills reported in short supply:*
Accountancy/Financial: Accountancy. Blue Collar: CNC,
HGV drivers, Joiners, Labourers, LGV drivers, Skilled trades,
Welding. Engineering: Engineers, Technicians. Hotels/
Catering: Chefs. IT/Computing: Business analysts, Java.
Nursing/Medical/Care: RGNs. Secretarial/Clerical: Legal
secretaries, Reception. Other: Sales.
Availability of permanent staff
Q. Is the availability of candidates for permanent vacancies
better, the same or worse than one month ago?
	 	 Better	 Same	 Worse	 Net	 Index	 S.Adj.	
	           	 %	 %	 %	 +/-	 	 Index
2013	Apr	 16.8	 65.5	 17.7	 -1.0	 49.5	 51.4
	 May	 15.6	 66.8	 17.6	 -2.0	 49.0	 51.0
	 Jun	 23.4	 59.7	 17.0	 6.4	 53.2	 53.1
	 Jul	 17.9	 55.4	 26.6	 -8.7	 45.7	 47.2
	 Aug	 16.2	 58.0	 25.8	 -9.6	 45.2	 46.9
	 Sep	 18.4	 55.1	 26.5	 -8.0	 46.0	 47.0
Availability of temporary/contract staff
Q. Is the availability of candidates for temporary vacancies
better, the same or worse than one month ago?
	 	 Better	 Same	 Worse	 Net	 Index	 S.Adj.	
	           	 %	 %	 %	 +/-	 	 Index
All Intellectual Property Rights owned by Markit Economics Limited
*consultants are invited to specify any areas in which they have encountered skill
shortages during the latest month
Report on Jobs | Recruitment Industry Survey
The recruitment industry survey tracks both the
average salaries awarded to people placed in
permanent jobs each month, as well as average
hourly rates of pay for temp/contract staff.
Permanent salaries
Average starting salaries awarded to successful candidates
placed in permanent jobs increased further in September.
Quickening marginally since August, the rate of inflation was
the fastest since February 2008. Panellists linked salary
growth to a combination of higher demand for staff, shortages
of skilled candidates and increased numbers of higher-
specification jobs being filled.
Permanent salary inflation was sharpest in the South, while
the Midlands posted the slowest rise.
Temp/contract pay rates
Hourly rates of pay for staff in temporary/contract employment
continued to increase in September, which a number of
panellists attributed to skill shortages. The latest rise was
slightly stronger than that recorded in August and only
marginally below July’s five-and-a-half year high.
In contrast to the trend in permanent salaries, the
fastest rise in temp pay was signalled by Midlands-based
consultancies.
6 Pay pressures
1998 1999 2000 2001 2002 2003 2004 2005 2006 2007 2008 2009 2010 2011 2012 2013
35
40
45
50
55
60
65
70
Temp/Contract	Hourly	Pay	Rates
Permanent	Salaries
Increasing rate of decline
Increasing rate of growth
50 = no change on previous month
Pay Pressures
2013	Mar	 10.7	 84.1	 5.2	 5.5	 52.7	 52.7
	 Apr	 10.1	 84.8	 5.1	 4.9	 52.5	 52.1
	 May	 13.1	 80.4	 6.5	 6.6	 53.3	 51.8
	 Jun	 14.4	 79.6	 6.0	 8.4	 54.2	 53.2
	 Jul	 14.9	 82.2	 2.9	 12.0	 56.0	 54.0
	 Aug	 16.2	 80.6	 3.2	 13.0	 56.5	 56.5
	 Sep	 17.6	 79.7	 2.7	 14.9	 57.5	 56.7
	 	 Higher	 Same	 Lower	 Net	 Index	 S.Adj.	
	           	 %	 %	 %	 +/-	 	 Index
Permanent Salaries
Q.Areaverage salaries awarded tostaffplaced in permanent
positions higher, the same or lower than one month ago?
2013	Mar	 8.8	 89.3	 1.9	 6.9	 53.5	 52.1
	 Apr	 7.7	 86.8	 5.5	 2.2	 51.1	 51.6
	 May	 8.6	 87.1	 4.4	 4.2	 52.1	 52.0
	 Jun	 11.9	 83.7	 4.4	 7.5	 53.7	 53.9
	 Jul	 15.7	 81.3	 2.9	 12.8	 56.4	 56.8
	 Aug	 12.1	 85.0	 2.8	 9.3	 54.7	 55.3
	 Sep	 14.3	 82.5	 3.3	 11.0	 55.5	 56.0
	 	 Higher	 Same	 Lower	 Net	 Index	 S.Adj.	
	           	 %	 %	 %	 +/-	 	 Index
Temporary/Contract Pay Rates
Q. Are average hourly pay rates for temporary/contract staff
higher, the same or lower than one month ago?
2001 2002 2003 2004 2005 2006 2007 2008 2009 2010 2011 2012 2013
-6
-3
0
3
6
9
Public	sector
Private	sector
Annual percent change
Yr/yr % chg in average weekly earnings (3mma)
	 2010	 2011	 2012	 Apr'13	 May	 Jun	 Jul
Whole economy	 2.3	 2.4	 1.5	 1.5	 1.8	 2.2	 1.1
Private sector	 2.0	 2.5	 1.5	 1.6	 2.1	 2.8	 1.4
Public sector	 3.3	 2.5	 1.6	 1.2	 1.3	 0.9	 0.5
Services	 2.3	 2.8	 1.4	 1.5	 1.8	 2.2	 1.1
Manufacturing	 4.0	 1.6	 1.8	 2.7	 2.7	 2.6	 2.1
Construction	 0.3	 0.8	 0.8	 -0.3	 -0.4	 0.9	 -0.8
UK average weekly earnings
Data from the Office for National Statistics signalled
that annual growth of employee earnings (including
bonuses) eased to 1.1% in the three months to July,
the slowest since the three months to March.
Report on Jobs | Recruitment Industry Survey
7 Feature UK regional claimant count	
	 KPMG LLP, a UK limited liability partnership, is a
	 subsidiary of KPMG Europe LLP and operates
	 from 22 offices across the UK with over 12,000
partners and staff.  The UK firm recorded a turnover of £1.8 billion
in the year ended September 2012. KPMG is a global network of
professional firms providing Audit, Tax, and Advisory services. We
operate in 156 countries and have 152,000 professionals working in
member firms around the world. The independent member firms of
the KPMG network are affiliated with KPMG International Cooperative
(“KPMG International”), a Swiss entity. KPMG International provides
no client services.
	 The REC is the professional body representing
	 the UK’s £24.6 billion private recruitment and
	 staffingindustrywithmorethan8,000recruitment
agencies and 6,000 recruitment consultants in membership. There are
more than 1 million temporary workers registered with UK agencies
who are deployed in industry, commerce and the public services every
day.
	 Markit is a specialist compiler of
	 business surveys and economic indices,
including the Purchasing Managers’ Index®
(PMI®
) series, which is
now available for 32 countries and key regions including the Eurozone.
For more information e-mail economics@markit.com or call +44
1491 461000.
Recruitment Industry Survey
The monthly survey features original research data collected via
questionnaire by Markit from a panel of 400 UK recruitment and
employment consultancies. In 2010/11, some 1,049,333 people were
employed in either temporary or contract work through consultancies
and 604,193 people were placed in permanent positions through
consultancies. Monthly survey data were first collected in October
1997 and are collected in the end of each month, with respondents
asked to specify the direction of change in a number of survey variables.
Markit do not revise underlying survey data after first publication, but
seasonal adjustment factors may be revised from time to time as
appropriate which will affect the seasonally adjusted data series.
The intellectual property rights to these data are owned by Markit
Economics Limited. Any unauthorised use, including but not limited to
copying, distributing, transmitting or otherwise of any data appearing is
not permitted without Markit’s prior consent. The publication or release
of any of these data prior to the general release time is an infringement
of Markit Economics Limited’s intellectual property rights. Markit shall
not have any liability, duty or obligation for or relating to the content or
information (“data”) contained herein, any errors, inaccuracies, omissions
or delays in the data, or for any actions taken in reliance thereon. In no
event shall Markit be liable for any special, incidental, or consequential
damages, arising out of the use of the data. Purchasing Managers’ Index®
and PMI®
are registered trade marks of Markit Economics Limited. Markit
and the Markit logo are registered trade marks of Markit Group Limited.
UK claimant count drops to four-and-a-half year low
as all regions see a fall
The number of people in the UK claiming jobseeker’s
allowance continued to fall in August, taking the current
sequence of decline to ten months. At 1,401,800, the claimant
count was down 32,600 since July and 168,100 lower than in
August 2012. That took the number of claimants to its lowest
level since February 2009. Declines in the claimant count
were seen in all regions compared with one month previously.
Consequently, the UK claimant count rate fell for the second
month running to 4.2%, its lowest in four-and-a-half years. The
rate fell in the vast majority of regions, with the only exception
being Northern Ireland, where it remained unchanged.
The South East recorded the lowest claimant count rate at
2.5%, followed by the South West at 2.7%. The highest rate
was registered in Northern Ireland at 6.9%, slightly ahead of
the North East at 6.8%.
All Intellectual Property Rights owned by Markit Economics Limited
South East	 117	 2.5	 (1)
South West	 75	 2.7	 (2)
East of England	 100	 3.4	 (3)
London	 201	 3.8	 (4)
East Midlands	 95	 4.1	 (5)
Scotland	 126	 4.5	 (6)
NW & Merseyside	 176	 4.9	 (7)
Wales	 72	 4.9	 (7)
West Midlands	 147	 5.2	 (9)
Yorks & Humberside	 148	 5.5	 (10)
North East	 84	 6.8	 (11)
Northern Ireland 	 62	 6.9	 (12)
United Kingdom	 1402	 4.2	
	 	 	 Claimant count (Aug’13)
Region	 ‘000s	 Rate (%)*	 Rank
Source: Department for Work & Pensions and National Statistics.
* As a percentage of Claimant Count + Workforce Jobs.

Contenu connexe

Tendances

Presentation for web1 4
Presentation for web1 4Presentation for web1 4
Presentation for web1 4
richwalker84
 
Summary slides: London's labour market in the recessions
Summary slides: London's labour market in the recessionsSummary slides: London's labour market in the recessions
Summary slides: London's labour market in the recessions
MelisaWickham
 
Labour reallocation over the business cycle during transition and post-transi...
Labour reallocation over the business cycle during transition and post-transi...Labour reallocation over the business cycle during transition and post-transi...
Labour reallocation over the business cycle during transition and post-transi...
GRAPE
 
Ulster Bank Northern Ireland PMI October 2021 Slide Pack
Ulster Bank Northern Ireland PMI October 2021 Slide PackUlster Bank Northern Ireland PMI October 2021 Slide Pack
Ulster Bank Northern Ireland PMI October 2021 Slide Pack
Richard Ramsey
 

Tendances (20)

Presentation for web1 4
Presentation for web1 4Presentation for web1 4
Presentation for web1 4
 
Summary slides: London's labour market in the recessions
Summary slides: London's labour market in the recessionsSummary slides: London's labour market in the recessions
Summary slides: London's labour market in the recessions
 
The Latvian Economy - 2010 September (pdf)
The Latvian Economy - 2010 September (pdf)The Latvian Economy - 2010 September (pdf)
The Latvian Economy - 2010 September (pdf)
 
Ulster Bank NI PMI Slide Pack, April 2013
Ulster Bank NI PMI Slide Pack, April 2013Ulster Bank NI PMI Slide Pack, April 2013
Ulster Bank NI PMI Slide Pack, April 2013
 
Telling macro stories about productivity from micro data
Telling macro stories about productivity from micro dataTelling macro stories about productivity from micro data
Telling macro stories about productivity from micro data
 
Ulster Bank NI PMI - October 2013
Ulster Bank NI PMI - October 2013Ulster Bank NI PMI - October 2013
Ulster Bank NI PMI - October 2013
 
Sources of Job and Worker Flows: Evidence from a Panel of Regions
Sources of Job and Worker Flows: Evidence from a Panel of RegionsSources of Job and Worker Flows: Evidence from a Panel of Regions
Sources of Job and Worker Flows: Evidence from a Panel of Regions
 
Ulster Bank Northern Ireland PMI January 2019 Slide Pack
Ulster Bank Northern Ireland PMI January 2019 Slide PackUlster Bank Northern Ireland PMI January 2019 Slide Pack
Ulster Bank Northern Ireland PMI January 2019 Slide Pack
 
Labour reallocation over the business cycle during transition and post-transi...
Labour reallocation over the business cycle during transition and post-transi...Labour reallocation over the business cycle during transition and post-transi...
Labour reallocation over the business cycle during transition and post-transi...
 
Labor rellocation and demographics
Labor rellocation and demographicsLabor rellocation and demographics
Labor rellocation and demographics
 
The Estonian Economy, 2010 June
The Estonian Economy, 2010 JuneThe Estonian Economy, 2010 June
The Estonian Economy, 2010 June
 
Ulster Bank PMI Slide Pack
Ulster Bank PMI Slide PackUlster Bank PMI Slide Pack
Ulster Bank PMI Slide Pack
 
Earnings Event
Earnings EventEarnings Event
Earnings Event
 
NATIONAL WAGE EQUALIZATION AND REGIONAL MISALLOCATION: EVIDENCE FROM ITALIAN ...
NATIONAL WAGE EQUALIZATION AND REGIONAL MISALLOCATION: EVIDENCE FROM ITALIAN ...NATIONAL WAGE EQUALIZATION AND REGIONAL MISALLOCATION: EVIDENCE FROM ITALIAN ...
NATIONAL WAGE EQUALIZATION AND REGIONAL MISALLOCATION: EVIDENCE FROM ITALIAN ...
 
Slide pack , Ulster Bank Northern Ireland PMI, December 2014
Slide pack , Ulster Bank Northern Ireland PMI, December 2014Slide pack , Ulster Bank Northern Ireland PMI, December 2014
Slide pack , Ulster Bank Northern Ireland PMI, December 2014
 
August 2020 PMI Slide Pack
August 2020 PMI Slide PackAugust 2020 PMI Slide Pack
August 2020 PMI Slide Pack
 
ONS Economic Forum
ONS Economic ForumONS Economic Forum
ONS Economic Forum
 
Ulster Bank Northern Ireland PMI October 2021 Slide Pack
Ulster Bank Northern Ireland PMI October 2021 Slide PackUlster Bank Northern Ireland PMI October 2021 Slide Pack
Ulster Bank Northern Ireland PMI October 2021 Slide Pack
 
Ulster Bank NI PMI January 2018
Ulster Bank NI PMI January 2018Ulster Bank NI PMI January 2018
Ulster Bank NI PMI January 2018
 
Slide Pack, Ulster Bank NI PMI, May 2014
Slide Pack, Ulster Bank NI PMI, May 2014Slide Pack, Ulster Bank NI PMI, May 2014
Slide Pack, Ulster Bank NI PMI, May 2014
 

En vedette

En vedette (10)

Permanent salaries rise at fastest rate since July 2007
Permanent salaries rise at fastest rate since July 2007Permanent salaries rise at fastest rate since July 2007
Permanent salaries rise at fastest rate since July 2007
 
Hudson 2013 IT Employee Insight & Salary guide
Hudson 2013 IT Employee Insight & Salary guideHudson 2013 IT Employee Insight & Salary guide
Hudson 2013 IT Employee Insight & Salary guide
 
2013 state-of-scrum-report
2013 state-of-scrum-report 2013 state-of-scrum-report
2013 state-of-scrum-report
 
Smart Grid - Selta's Point Of View
Smart Grid - Selta's Point Of ViewSmart Grid - Selta's Point Of View
Smart Grid - Selta's Point Of View
 
Selta's vertical solutions and markets
Selta's vertical solutions and marketsSelta's vertical solutions and markets
Selta's vertical solutions and markets
 
Эффективный анализ мобильного трафика
Эффективный анализ мобильного трафикаЭффективный анализ мобильного трафика
Эффективный анализ мобильного трафика
 
Контекстна реклама для E-commerce в кризис
Контекстна реклама для E-commerce в кризисКонтекстна реклама для E-commerce в кризис
Контекстна реклама для E-commerce в кризис
 
Hiring for success — what makes the difference? Why are so many organisations...
Hiring for success — what makes the difference? Why are so many organisations...Hiring for success — what makes the difference? Why are so many organisations...
Hiring for success — what makes the difference? Why are so many organisations...
 
Диспетчер тегов Google. Меньше затрат, больше контроля.
Диспетчер тегов Google. Меньше затрат, больше контроля.Диспетчер тегов Google. Меньше затрат, больше контроля.
Диспетчер тегов Google. Меньше затрат, больше контроля.
 
Emerging trends in project management
Emerging trends in project managementEmerging trends in project management
Emerging trends in project management
 

Similaire à Vacancies continue to rise at marked pace, candidate availability falls further

Bartlett and west feb 2011 - ar
Bartlett and west   feb 2011 - arBartlett and west   feb 2011 - ar
Bartlett and west feb 2011 - ar
Justin Main
 
June Jobs Report - U.S. Department of the Treasury
June Jobs Report - U.S. Department of the TreasuryJune Jobs Report - U.S. Department of the Treasury
June Jobs Report - U.S. Department of the Treasury
businessforward
 

Similaire à Vacancies continue to rise at marked pace, candidate availability falls further (20)

December report on Permanent and temporary jobs - Permanent placements rise a...
December report on Permanent and temporary jobs - Permanent placements rise a...December report on Permanent and temporary jobs - Permanent placements rise a...
December report on Permanent and temporary jobs - Permanent placements rise a...
 
Report on jobs November 6th
Report on jobs November 6thReport on jobs November 6th
Report on jobs November 6th
 
March 2015 U.S. employment update and outlook
March 2015 U.S. employment update and outlookMarch 2015 U.S. employment update and outlook
March 2015 U.S. employment update and outlook
 
Chicago employment update - May 2015
Chicago employment update - May 2015Chicago employment update - May 2015
Chicago employment update - May 2015
 
Presentation to jelf employee benefits seminar 13 july 2015
Presentation to jelf employee benefits seminar 13 july 2015Presentation to jelf employee benefits seminar 13 july 2015
Presentation to jelf employee benefits seminar 13 july 2015
 
U.S. employment update and outlook: October 2014
U.S. employment update and outlook: October 2014U.S. employment update and outlook: October 2014
U.S. employment update and outlook: October 2014
 
Bartlett and west feb 2011 - ar
Bartlett and west   feb 2011 - arBartlett and west   feb 2011 - ar
Bartlett and west feb 2011 - ar
 
February 2015 U.S. employment update and outlook
February 2015 U.S. employment update and outlookFebruary 2015 U.S. employment update and outlook
February 2015 U.S. employment update and outlook
 
April 2017 U.S. employment update and outlook
April 2017 U.S. employment update and outlookApril 2017 U.S. employment update and outlook
April 2017 U.S. employment update and outlook
 
U.S. employment rate data and trends April 2014
U.S. employment rate data and trends April 2014U.S. employment rate data and trends April 2014
U.S. employment rate data and trends April 2014
 
April 2016 U.S. employment update and outlook
April 2016 U.S. employment update and outlookApril 2016 U.S. employment update and outlook
April 2016 U.S. employment update and outlook
 
U.S. employment update and outlook: November 2014
U.S. employment update and outlook: November 2014U.S. employment update and outlook: November 2014
U.S. employment update and outlook: November 2014
 
U.S. employment rate data and trends June 2014
U.S. employment rate data and trends June 2014U.S. employment rate data and trends June 2014
U.S. employment rate data and trends June 2014
 
U.S. employment update and outlook: December 2014
U.S. employment update and outlook: December 2014U.S. employment update and outlook: December 2014
U.S. employment update and outlook: December 2014
 
April 2015 U.S. employment update and outlook
April 2015 U.S. employment update and outlookApril 2015 U.S. employment update and outlook
April 2015 U.S. employment update and outlook
 
June 2015 Chicago employment update
June 2015 Chicago employment updateJune 2015 Chicago employment update
June 2015 Chicago employment update
 
Minneapolis–St. Employment Update | November 2015
Minneapolis–St. Employment Update | November 2015Minneapolis–St. Employment Update | November 2015
Minneapolis–St. Employment Update | November 2015
 
June Jobs Report - U.S. Department of the Treasury
June Jobs Report - U.S. Department of the TreasuryJune Jobs Report - U.S. Department of the Treasury
June Jobs Report - U.S. Department of the Treasury
 
May 2018 U.S. employment update and outlook
May 2018 U.S. employment update and outlookMay 2018 U.S. employment update and outlook
May 2018 U.S. employment update and outlook
 
March 2017 U.S. employment update and outlook
March 2017 U.S. employment update and outlookMarch 2017 U.S. employment update and outlook
March 2017 U.S. employment update and outlook
 

Dernier

Call Girls Electronic City Just Call 👗 7737669865 👗 Top Class Call Girl Servi...
Call Girls Electronic City Just Call 👗 7737669865 👗 Top Class Call Girl Servi...Call Girls Electronic City Just Call 👗 7737669865 👗 Top Class Call Girl Servi...
Call Girls Electronic City Just Call 👗 7737669865 👗 Top Class Call Girl Servi...
amitlee9823
 
Call Girls Hebbal Just Call 👗 7737669865 👗 Top Class Call Girl Service Bangalore
Call Girls Hebbal Just Call 👗 7737669865 👗 Top Class Call Girl Service BangaloreCall Girls Hebbal Just Call 👗 7737669865 👗 Top Class Call Girl Service Bangalore
Call Girls Hebbal Just Call 👗 7737669865 👗 Top Class Call Girl Service Bangalore
amitlee9823
 
Call Girls Navi Mumbai Just Call 9907093804 Top Class Call Girl Service Avail...
Call Girls Navi Mumbai Just Call 9907093804 Top Class Call Girl Service Avail...Call Girls Navi Mumbai Just Call 9907093804 Top Class Call Girl Service Avail...
Call Girls Navi Mumbai Just Call 9907093804 Top Class Call Girl Service Avail...
Dipal Arora
 

Dernier (20)

Call Girls Electronic City Just Call 👗 7737669865 👗 Top Class Call Girl Servi...
Call Girls Electronic City Just Call 👗 7737669865 👗 Top Class Call Girl Servi...Call Girls Electronic City Just Call 👗 7737669865 👗 Top Class Call Girl Servi...
Call Girls Electronic City Just Call 👗 7737669865 👗 Top Class Call Girl Servi...
 
Call Girls Hebbal Just Call 👗 7737669865 👗 Top Class Call Girl Service Bangalore
Call Girls Hebbal Just Call 👗 7737669865 👗 Top Class Call Girl Service BangaloreCall Girls Hebbal Just Call 👗 7737669865 👗 Top Class Call Girl Service Bangalore
Call Girls Hebbal Just Call 👗 7737669865 👗 Top Class Call Girl Service Bangalore
 
A DAY IN THE LIFE OF A SALESMAN / WOMAN
A DAY IN THE LIFE OF A  SALESMAN / WOMANA DAY IN THE LIFE OF A  SALESMAN / WOMAN
A DAY IN THE LIFE OF A SALESMAN / WOMAN
 
7.pdf This presentation captures many uses and the significance of the number...
7.pdf This presentation captures many uses and the significance of the number...7.pdf This presentation captures many uses and the significance of the number...
7.pdf This presentation captures many uses and the significance of the number...
 
Mondelez State of Snacking and Future Trends 2023
Mondelez State of Snacking and Future Trends 2023Mondelez State of Snacking and Future Trends 2023
Mondelez State of Snacking and Future Trends 2023
 
Boost the utilization of your HCL environment by reevaluating use cases and f...
Boost the utilization of your HCL environment by reevaluating use cases and f...Boost the utilization of your HCL environment by reevaluating use cases and f...
Boost the utilization of your HCL environment by reevaluating use cases and f...
 
👉Chandigarh Call Girls 👉9878799926👉Just Call👉Chandigarh Call Girl In Chandiga...
👉Chandigarh Call Girls 👉9878799926👉Just Call👉Chandigarh Call Girl In Chandiga...👉Chandigarh Call Girls 👉9878799926👉Just Call👉Chandigarh Call Girl In Chandiga...
👉Chandigarh Call Girls 👉9878799926👉Just Call👉Chandigarh Call Girl In Chandiga...
 
Call Girls Navi Mumbai Just Call 9907093804 Top Class Call Girl Service Avail...
Call Girls Navi Mumbai Just Call 9907093804 Top Class Call Girl Service Avail...Call Girls Navi Mumbai Just Call 9907093804 Top Class Call Girl Service Avail...
Call Girls Navi Mumbai Just Call 9907093804 Top Class Call Girl Service Avail...
 
Grateful 7 speech thanking everyone that has helped.pdf
Grateful 7 speech thanking everyone that has helped.pdfGrateful 7 speech thanking everyone that has helped.pdf
Grateful 7 speech thanking everyone that has helped.pdf
 
Famous Olympic Siblings from the 21st Century
Famous Olympic Siblings from the 21st CenturyFamous Olympic Siblings from the 21st Century
Famous Olympic Siblings from the 21st Century
 
HONOR Veterans Event Keynote by Michael Hawkins
HONOR Veterans Event Keynote by Michael HawkinsHONOR Veterans Event Keynote by Michael Hawkins
HONOR Veterans Event Keynote by Michael Hawkins
 
The Coffee Bean & Tea Leaf(CBTL), Business strategy case study
The Coffee Bean & Tea Leaf(CBTL), Business strategy case studyThe Coffee Bean & Tea Leaf(CBTL), Business strategy case study
The Coffee Bean & Tea Leaf(CBTL), Business strategy case study
 
Call Girls In Panjim North Goa 9971646499 Genuine Service
Call Girls In Panjim North Goa 9971646499 Genuine ServiceCall Girls In Panjim North Goa 9971646499 Genuine Service
Call Girls In Panjim North Goa 9971646499 Genuine Service
 
Best VIP Call Girls Noida Sector 40 Call Me: 8448380779
Best VIP Call Girls Noida Sector 40 Call Me: 8448380779Best VIP Call Girls Noida Sector 40 Call Me: 8448380779
Best VIP Call Girls Noida Sector 40 Call Me: 8448380779
 
Call Girls Pune Just Call 9907093804 Top Class Call Girl Service Available
Call Girls Pune Just Call 9907093804 Top Class Call Girl Service AvailableCall Girls Pune Just Call 9907093804 Top Class Call Girl Service Available
Call Girls Pune Just Call 9907093804 Top Class Call Girl Service Available
 
VVVIP Call Girls In Greater Kailash ➡️ Delhi ➡️ 9999965857 🚀 No Advance 24HRS...
VVVIP Call Girls In Greater Kailash ➡️ Delhi ➡️ 9999965857 🚀 No Advance 24HRS...VVVIP Call Girls In Greater Kailash ➡️ Delhi ➡️ 9999965857 🚀 No Advance 24HRS...
VVVIP Call Girls In Greater Kailash ➡️ Delhi ➡️ 9999965857 🚀 No Advance 24HRS...
 
Mysore Call Girls 8617370543 WhatsApp Number 24x7 Best Services
Mysore Call Girls 8617370543 WhatsApp Number 24x7 Best ServicesMysore Call Girls 8617370543 WhatsApp Number 24x7 Best Services
Mysore Call Girls 8617370543 WhatsApp Number 24x7 Best Services
 
How to Get Started in Social Media for Art League City
How to Get Started in Social Media for Art League CityHow to Get Started in Social Media for Art League City
How to Get Started in Social Media for Art League City
 
Ensure the security of your HCL environment by applying the Zero Trust princi...
Ensure the security of your HCL environment by applying the Zero Trust princi...Ensure the security of your HCL environment by applying the Zero Trust princi...
Ensure the security of your HCL environment by applying the Zero Trust princi...
 
Cracking the Cultural Competence Code.pptx
Cracking the Cultural Competence Code.pptxCracking the Cultural Competence Code.pptx
Cracking the Cultural Competence Code.pptx
 

Vacancies continue to rise at marked pace, candidate availability falls further

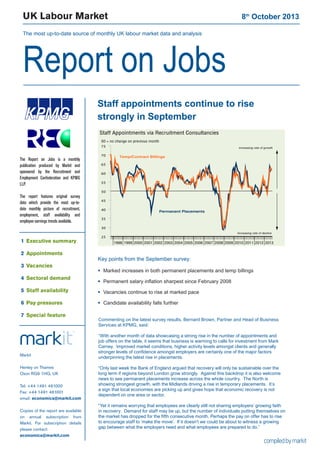
  • 1. UK Labour Market 8th October 2013 The most up-to-date source of monthly UK labour market data and analysis Report on Jobs 1998 1999 2000 2001 2002 2003 2004 2005 2006 2007 2008 2009 2010 2011 2012 2013 25 30 35 40 45 50 55 60 65 70 75 Temp/Contract Billings Permanent Placements Increasing rate of decline Increasing rate of growth 50 = no change on previous month Staff Appointments via Recruitment Consultancies Staff appointments continue to rise strongly in September Commenting on the latest survey results, Bernard Brown, Partner and Head of Business Services at KPMG, said: “With another month of data showcasing a strong rise in the number of appointments and job offers on the table, it seems that business is warming to calls for investment from Mark Carney. Improved market conditions, higher activity levels amongst clients and generally stronger levels of confidence amongst employers are certainly one of the major factors underpinning the latest rise in placements. “Only last week the Bank of England argued that recovery will only be sustainable over the long term if regions beyond London grow strongly. Against this backdrop it is also welcome news to see permanent placements increase across the whole country. The North is showing strongest growth, with the Midlands driving a rise in temporary placements. It’s a sign that local economies are picking up and gives hope that economic recovery is not dependent on one area or sector. “Yet it remains worrying that employees are clearly still not sharing employers’ growing faith in recovery. Demand for staff may be up, but the number of individuals putting themselves on the market has dropped for the fifth consecutive month. Perhaps the pay on offer has to rise to encourage staff to ‘make the move’. If it doesn’t we could be about to witness a growing gap between what the employers need and what employees are prepared to do.” Markit Henley on Thames Oxon RG9 1HG, UK Tel: +44 1491 461000 Fax: +44 1491 461001 email: economics@markit.com Copies of the report are available on annual subscription from Markit. For subscription details please contact: economics@markit.com The Report on Jobs is a monthly publication produced by Markit and sponsored by the Recruitment and Employment Confederation and KPMG LLP. The report features original survey data which provide the most up-to- date monthly picture of recruitment, employment, staff availability and employee earnings trends available. 1 Executive summary 2 Appointments 3 Vacancies 4 Sectoral demand 5 Staff availability 6 Pay pressures 7 Special feature Key points from the September survey: Marked increases in both permanent placements and temp billings Permanent salary inflation sharpest since February 2008 Vacancies continue to rise at marked pace Candidate availability falls further    
  • 2. Report on Jobs | Recruitment Industry Survey The Report on Jobs is unique in providing the most comprehensive guide to the UK labour market, drawing on original survey data provided by recruitment consultancies and employers to provide the first indication each month of labour market trends. The main findings for September are: Strong growth of staff appointments maintained... Recruitment consultants signalled a further substantial rise in permanent staff placements during September. The pace of expansion was only slightly slower than July’s 40-month high. Temp billings similarly increased at a sharp rate, with growth close to the 15-year high seen in August. ...supported by marked expansion of vacancies Demand for staff continued to increase strongly in September. Growth of job vacancies was at a similar pace to that recorded in August, which was the fastest for over six years. Candidate availability continues to fall... September data indicated a further reduction in the availability of candidates. Solid rates of decline were indicated for both permanent and temporary staff availability. ...contributing to further increase in pay rates Permanent salary inflation quickened slightly in September, reaching its sharpest rate since February 2008. Temp pay inflation also accelerated, with the latest rise only marginally slower than July’s five-and-a-half year high. 1 Executive summary 1998 1999 2000 2001 2002 2003 2004 2005 2006 2007 2008 2009 2010 2011 2012 2013 25 30 35 40 45 50 55 60 65 70 Staff Appointments Temp/Contract Billings Permanent Placements 25 30 35 40 45 50 55 60 65 70 50 = no change on previous month 50=no change on previous month 1998 1999 2000 2001 2002 2003 2004 2005 2006 2007 2008 2009 2010 2011 2012 2013 35 40 45 50 55 60 65 70 Staff Availability and Earnings Growth Skill shortages Average permanent salaries (LHS) 90 80 70 60 50 40 30 50 = no change on previous month 50 = no change on previous month (inverted) inverted - RHS) (Availability of staff 1998 1999 2000 2001 2002 2003 2004 2005 2006 2007 2008 2009 2010 2011 2012 2013 Temp/Contract Vacancies Permanent Vacancies 50 = no change on previous month 25 30 35 40 45 50 55 60 65 70 75 Increasing rate of growth Increasing rate of decline Demand for staff All Intellectual Property Rights owned by Markit Economics Limited
  • 3. Report on Jobs | Recruitment Industry Survey Recruitment consultancies report on the number of people placed in permanent jobs each month, and their revenues (billings) received from placing people in temporary or contract positions at employers. Latest data from the survey of recruitment consultancies pointed to further strong growth of staff appointments during September. Marked increase in permanent placements The number of people placed into permanent jobs continued to rise in September, extending the current period of expansion to 12 months. The rate of growth was marked, having accelerated since August to a pace only slightly below July’s 40-month high. Improved market conditions, higher activity levels at clients and generally stronger confidence among employers were reported to have underpinned the latest rise in placements. Permanent placements increased across all four monitored English regions, with the North continuing to register the sharpest growth. Temp billings growth eases slightly from 15-year high September data signalled a further increase in agencies’ temporary/contract staff billings. Although moderating from the 15-year high posted in August, the rate of growth remained strong. The Midlands saw the fastest increase in temp billings during September, while the South posted the slowest rise. An index reading above 50 signals a higher number of placements/billings than the previous month. Readings below 50 signal a decline compared with the previous month. 2 Staff appointments 1998 1999 2000 2001 2002 2003 2004 2005 2006 2007 2008 2009 2010 2011 2012 2013 25 30 35 40 45 50 55 60 65 70 75 Temp/Contract Billings Permanent Placements Increasing rate of decline Increasing rate of growth 50 = no change on previous month Staff Appointments via Recruitment Consultancies 2013 Apr 38.9 36.7 24.4 14.5 57.2 52.5 May 39.2 30.7 30.1 9.1 54.6 53.4 Jun 47.9 31.5 20.6 27.2 63.6 57.6 Jul 48.9 32.0 19.1 29.8 64.9 63.3 Aug 37.8 38.6 23.6 14.2 57.1 61.3 Sep 49.0 33.5 17.4 31.6 65.8 62.2 Higher Same Lower Net Index S.Adj. % % % +/- 50 = no chg Index Permanent Staff Placements Q. Please compare the number of staff placed in permanent positions with the number one month ago. 2013 Apr 26.1 42.7 31.3 -5.2 47.4 48.7 May 34.8 42.7 22.5 12.2 56.1 52.6 Jun 41.3 39.1 19.6 21.7 60.8 56.4 Jul 46.6 36.8 16.6 30.0 65.0 61.5 Aug 44.4 40.0 15.6 28.8 64.4 62.9 Sep 43.1 43.1 13.8 29.4 64.7 61.7 Higher Same Lower Net Index S.Adj. % % % +/- 50 = no chg Index Temporary/Contract Staff Billings Q. Please compare your billings received from the employment of temporary and contract staff with the situation one month ago.
  • 4. Report on Jobs | Recruitment Industry Survey 3 Vacancies All Intellectual Property Rights owned by Markit Economics Limited Recruitment consultants are asked to specify whether the demand for staff from employers has changed on the previous month, thereby providing an indicator of the number of job vacancies. The summary indexes shown in this page are derived from the detailed sector data shown on page 5. Further strong rise in vacancies Demand for staff continued to increase at a marked pace in September. The Report on Jobs Vacancies Index posted 63.5 in September, only slightly below the reading of 63.7 in August, which was the highest for over six years. Both permanent and temporary staff registered sharp rates of demand growth in the latest survey period. Public & private sector vacancies Private sector demand for staff continued to rise at a substantial pace in September. In the case of permanent workers, the latest increase was the fastest since data were first available in December 2011. In the public sector, demand for temporary staff improved at the sharpest rate in the series history, but permanent workers saw a slight fall in demand for their services. Other vacancy indicators Data from the Office for National Statistics showed that job vacancies were up 11.1% on an annual basis in the three months to August. Latest available data signalled that internet-based recruitment spending rose by 2.3% in the first quarter of 2013. That was down from a pace of 3.1% in the final quarter of 2012. The Job Vacancies Index monitors the overall demand for staff at recruitment consultancies. An index reading above 50 signals a higher number of vacancies than the previous month. Readings below 50 signal a decline compared with the previous month. 1998 1999 2000 2001 2002 2003 2004 2005 2006 2007 2008 2009 2010 2011 2012 2013 Temp/Contract Vacancies Permanent Vacancies 50 = no change on previous month 25 30 35 40 45 50 55 60 65 70 75 Increasing rate of growth Increasing rate of decline 25 30 35 40 45 50 55 60 65 70 75 Job Vacancies 50 = no change on previous month Vacancy Index Increasing rate of growth Increasing rate of decline Job Vacancy Indicators May’13 Jun Jul Aug Sep Job Vacancy Index (recruitment industry survey) 50 = no change on previous month Other key vacancy data Annual % change Sources: Job centre vacancies provided by Office for National Statistics Internet recruitment spending provided by WARC.com Total 54.9 59.2 61.1 63.7 63.5 Permanent Staff 54.9 59.3 61.0 63.6 63.6 Temporary Staff 55.6 58.0 61.6 64.0 62.8 Public: perm 46.7 52.8 47.6 47.4 49.1 Public: temp 50.8 50.0 53.8 51.6 58.2 Private: perm 64.9 66.6 67.1 65.7 68.7 Private: temp 60.2 63.9 65.5 66.3 65.5 Job centre vacancies 12.0 12.9 12.6 11.1 n/a Internet recruitment 2.3 -- -- -- -- Public & private sector vacancies (not seasonally adjusted)
  • 5. Report on Jobs | Recruitment Industry Survey Recruitment consultancies are requested to compare the demand for staff according to sector with the situation one month ago. Permanent Staff Demand rose for all nine categories of permanent staff monitored by the survey in September. The strongest rate of growth was signalled for Construction workers, closely followed by Engineering staff. Hotel & Catering posted the slowest rise. 4 Demand for staff by sector 50 = no change on previous month Demand for staff 20 30 40 50 60 70 80 90 Secretarial & Clerical Perm Tem p 2002 2003 2004 2005 2006 2007 2008 2009 2010 2011 2012 2013 20 30 40 50 60 70 80 90 Accounting & Financial Tem p Perm 2002 2003 2004 2005 2006 2007 2008 2009 2010 2011 2012 2013 2002 2003 2004 2005 2006 2007 2008 2009 2010 2011 2012 2013 20 30 40 50 60 70 80 90 Executive & Professional Perm Tem p 2002 2003 2004 2005 2006 2007 2008 2009 2010 2011 2012 2013 20 30 40 50 60 70 80 90 IT & Computing Tem p Perm 20 30 40 50 60 70 80 90 2002 2003 2004 2005 2006 2007 2008 2009 2010 2011 2012 2013 Tem p Blue Collar Perm 20 30 40 50 60 70 80 90 2002 2003 2004 2005 2006 2007 2008 2009 2010 2011 2012 2013 Nursing/Medical/Care Tem p Perm 2002 2003 2004 2005 2006 2007 2008 2009 2010 2011 2012 2013 20 30 40 50 60 70 80 90 Hotel & Catering Tem p Perm Engineering; Construction This year (Last year) Rank Sep'13 Rank Sep'12 This year (Last year) Rank Sep'13 Rank Sep'12 *Non-seasonally adjusted data. Prior to April 2013 Engineering/Construction was reported as a single category. Data are presented in the form of diffusion indices whereby a reading of 50 indicates no change on the previous month. Readings above 50 signal stronger demand than a month ago. Readings below 50 signal weaker demand than a month ago. Engineering* 1 66.6 n/a n/a Blue Collar 2 65.9 (2) (54.2) Nursing/Medical/Care 3 65.8 (1) (62.5) Construction* 4 62.2 n/a n/a IT & Computing 5 62.1 (4) (51.9) Secretarial/Clerical 6 61.8 (3) (52.8) Accounting/Financial 7 58.6 (7) (48.4) Executive/Professional 8 54.2 (6) (48.7) Hotel & Catering 9 54.0 (5) (49.9) Construction* 1 70.3 n/a n/a Engineering* 2 69.2 n/a n/a IT & Computing 3 67.3 (2) (55.0) Executive/Professional 4 63.9 (5) (52.4) Accounting/Financial 5 63.7 (3) (53.8) Secretarial/Clerical 6 61.9 (4) (52.9) Nursing/Medical/Care 7 61.3 (1) (60.7) Blue Collar 8 56.5 (6) (50.0) Hotel & Catering 9 56.1 (7) (47.7) Temporary/contract staff Growth of demand was broad-based across all nine temporary/contract staff sectors in the latest survey period. Engineering workers were the most sought-after. Mirroring the trend seen for permanent staff, the weakest growth was signalled for Hotel & Catering employees. 46 50 54 58 62 66 70 74 78 Engineering Construction Perm Tem p
  • 6. Report on Jobs | Recruitment Industry Survey Recruitment consultants are asked to report whether availability of permanent and temporary staff has changed on the previous month. An overall indicator of staff availability is also calculated. Availability of permanent staff The availability of candidates to fill permanent job roles deteriorated for a fifth consecutive month in September. The rate of decline was little-changed from the solid pace recorded in August. All four English regions posted lower permanent staff availability during September. The sharpest reduction was signalled in London. Availability of temp/contract staff Temporary/contract staff availability continued to fall in September. The rate of deterioration was broadly unchanged from that signalled in the previous two months. Temp availability fell across London, the Midlands and the South, but was unchanged in the North. 5 Staff availability 1998 1999 2000 2001 2002 2003 2004 2005 2006 2007 2008 2009 2010 2011 2012 2013 Temp Availability Permanent Availability 50 = no change on previous month 20 30 40 50 60 70 80 90Improving availability Deteriorating availability 20 30 40 50 60 70 80 90 Staff Availability 50 = no change on previous month Staff Availability Index Improving availability Deteriorating availability 2013 Apr 19.5 61.1 19.4 0.1 50.0 50.1 May 16.3 64.1 19.6 -3.3 48.4 49.6 Jun 15.5 61.0 23.6 -8.1 45.9 48.3 Jul 13.0 56.3 30.7 -17.6 41.2 44.2 Aug 13.9 58.3 27.8 -13.9 43.0 45.7 Sep 19.0 51.6 29.4 -10.5 44.8 45.3 Key permanent staff skills reported in short supply:* Accountancy/Financial: Accountancy, Banking, Finance, Insurance. Blue Collar: Semi-skilled operators, Skilled trades. Construction: Project managers, Quantity surveyors. Engineering: Automotive, Design engineers, Electrical, General engineering, Geotechnical, Heavy engineering, Mechanical, Rail, Revit technicians, Structural, Subsea. Executive/Professional: Business development, HR, Marketing. Hotels/Catering: Chefs, Front of house. IT/ Computing: Business analysts, Cloud, Developers, Digital marketing, GWT, Java, .Net, PHP. Nursing/Medical/Care: Clinical diagnostics. Secretarial/Clerical: Legal secretaries, Office support. Other: Customer service, Languages, Sales. Key temp skills reported in short supply:* Accountancy/Financial: Accountancy. Blue Collar: CNC, HGV drivers, Joiners, Labourers, LGV drivers, Skilled trades, Welding. Engineering: Engineers, Technicians. Hotels/ Catering: Chefs. IT/Computing: Business analysts, Java. Nursing/Medical/Care: RGNs. Secretarial/Clerical: Legal secretaries, Reception. Other: Sales. Availability of permanent staff Q. Is the availability of candidates for permanent vacancies better, the same or worse than one month ago? Better Same Worse Net Index S.Adj. % % % +/- Index 2013 Apr 16.8 65.5 17.7 -1.0 49.5 51.4 May 15.6 66.8 17.6 -2.0 49.0 51.0 Jun 23.4 59.7 17.0 6.4 53.2 53.1 Jul 17.9 55.4 26.6 -8.7 45.7 47.2 Aug 16.2 58.0 25.8 -9.6 45.2 46.9 Sep 18.4 55.1 26.5 -8.0 46.0 47.0 Availability of temporary/contract staff Q. Is the availability of candidates for temporary vacancies better, the same or worse than one month ago? Better Same Worse Net Index S.Adj. % % % +/- Index All Intellectual Property Rights owned by Markit Economics Limited *consultants are invited to specify any areas in which they have encountered skill shortages during the latest month
  • 7. Report on Jobs | Recruitment Industry Survey The recruitment industry survey tracks both the average salaries awarded to people placed in permanent jobs each month, as well as average hourly rates of pay for temp/contract staff. Permanent salaries Average starting salaries awarded to successful candidates placed in permanent jobs increased further in September. Quickening marginally since August, the rate of inflation was the fastest since February 2008. Panellists linked salary growth to a combination of higher demand for staff, shortages of skilled candidates and increased numbers of higher- specification jobs being filled. Permanent salary inflation was sharpest in the South, while the Midlands posted the slowest rise. Temp/contract pay rates Hourly rates of pay for staff in temporary/contract employment continued to increase in September, which a number of panellists attributed to skill shortages. The latest rise was slightly stronger than that recorded in August and only marginally below July’s five-and-a-half year high. In contrast to the trend in permanent salaries, the fastest rise in temp pay was signalled by Midlands-based consultancies. 6 Pay pressures 1998 1999 2000 2001 2002 2003 2004 2005 2006 2007 2008 2009 2010 2011 2012 2013 35 40 45 50 55 60 65 70 Temp/Contract Hourly Pay Rates Permanent Salaries Increasing rate of decline Increasing rate of growth 50 = no change on previous month Pay Pressures 2013 Mar 10.7 84.1 5.2 5.5 52.7 52.7 Apr 10.1 84.8 5.1 4.9 52.5 52.1 May 13.1 80.4 6.5 6.6 53.3 51.8 Jun 14.4 79.6 6.0 8.4 54.2 53.2 Jul 14.9 82.2 2.9 12.0 56.0 54.0 Aug 16.2 80.6 3.2 13.0 56.5 56.5 Sep 17.6 79.7 2.7 14.9 57.5 56.7 Higher Same Lower Net Index S.Adj. % % % +/- Index Permanent Salaries Q.Areaverage salaries awarded tostaffplaced in permanent positions higher, the same or lower than one month ago? 2013 Mar 8.8 89.3 1.9 6.9 53.5 52.1 Apr 7.7 86.8 5.5 2.2 51.1 51.6 May 8.6 87.1 4.4 4.2 52.1 52.0 Jun 11.9 83.7 4.4 7.5 53.7 53.9 Jul 15.7 81.3 2.9 12.8 56.4 56.8 Aug 12.1 85.0 2.8 9.3 54.7 55.3 Sep 14.3 82.5 3.3 11.0 55.5 56.0 Higher Same Lower Net Index S.Adj. % % % +/- Index Temporary/Contract Pay Rates Q. Are average hourly pay rates for temporary/contract staff higher, the same or lower than one month ago? 2001 2002 2003 2004 2005 2006 2007 2008 2009 2010 2011 2012 2013 -6 -3 0 3 6 9 Public sector Private sector Annual percent change Yr/yr % chg in average weekly earnings (3mma) 2010 2011 2012 Apr'13 May Jun Jul Whole economy 2.3 2.4 1.5 1.5 1.8 2.2 1.1 Private sector 2.0 2.5 1.5 1.6 2.1 2.8 1.4 Public sector 3.3 2.5 1.6 1.2 1.3 0.9 0.5 Services 2.3 2.8 1.4 1.5 1.8 2.2 1.1 Manufacturing 4.0 1.6 1.8 2.7 2.7 2.6 2.1 Construction 0.3 0.8 0.8 -0.3 -0.4 0.9 -0.8 UK average weekly earnings Data from the Office for National Statistics signalled that annual growth of employee earnings (including bonuses) eased to 1.1% in the three months to July, the slowest since the three months to March.
  • 8. Report on Jobs | Recruitment Industry Survey 7 Feature UK regional claimant count KPMG LLP, a UK limited liability partnership, is a subsidiary of KPMG Europe LLP and operates from 22 offices across the UK with over 12,000 partners and staff. The UK firm recorded a turnover of £1.8 billion in the year ended September 2012. KPMG is a global network of professional firms providing Audit, Tax, and Advisory services. We operate in 156 countries and have 152,000 professionals working in member firms around the world. The independent member firms of the KPMG network are affiliated with KPMG International Cooperative (“KPMG International”), a Swiss entity. KPMG International provides no client services. The REC is the professional body representing the UK’s £24.6 billion private recruitment and staffingindustrywithmorethan8,000recruitment agencies and 6,000 recruitment consultants in membership. There are more than 1 million temporary workers registered with UK agencies who are deployed in industry, commerce and the public services every day. Markit is a specialist compiler of business surveys and economic indices, including the Purchasing Managers’ Index® (PMI® ) series, which is now available for 32 countries and key regions including the Eurozone. For more information e-mail economics@markit.com or call +44 1491 461000. Recruitment Industry Survey The monthly survey features original research data collected via questionnaire by Markit from a panel of 400 UK recruitment and employment consultancies. In 2010/11, some 1,049,333 people were employed in either temporary or contract work through consultancies and 604,193 people were placed in permanent positions through consultancies. Monthly survey data were first collected in October 1997 and are collected in the end of each month, with respondents asked to specify the direction of change in a number of survey variables. Markit do not revise underlying survey data after first publication, but seasonal adjustment factors may be revised from time to time as appropriate which will affect the seasonally adjusted data series. The intellectual property rights to these data are owned by Markit Economics Limited. Any unauthorised use, including but not limited to copying, distributing, transmitting or otherwise of any data appearing is not permitted without Markit’s prior consent. The publication or release of any of these data prior to the general release time is an infringement of Markit Economics Limited’s intellectual property rights. Markit shall not have any liability, duty or obligation for or relating to the content or information (“data”) contained herein, any errors, inaccuracies, omissions or delays in the data, or for any actions taken in reliance thereon. In no event shall Markit be liable for any special, incidental, or consequential damages, arising out of the use of the data. Purchasing Managers’ Index® and PMI® are registered trade marks of Markit Economics Limited. Markit and the Markit logo are registered trade marks of Markit Group Limited. UK claimant count drops to four-and-a-half year low as all regions see a fall The number of people in the UK claiming jobseeker’s allowance continued to fall in August, taking the current sequence of decline to ten months. At 1,401,800, the claimant count was down 32,600 since July and 168,100 lower than in August 2012. That took the number of claimants to its lowest level since February 2009. Declines in the claimant count were seen in all regions compared with one month previously. Consequently, the UK claimant count rate fell for the second month running to 4.2%, its lowest in four-and-a-half years. The rate fell in the vast majority of regions, with the only exception being Northern Ireland, where it remained unchanged. The South East recorded the lowest claimant count rate at 2.5%, followed by the South West at 2.7%. The highest rate was registered in Northern Ireland at 6.9%, slightly ahead of the North East at 6.8%. All Intellectual Property Rights owned by Markit Economics Limited South East 117 2.5 (1) South West 75 2.7 (2) East of England 100 3.4 (3) London 201 3.8 (4) East Midlands 95 4.1 (5) Scotland 126 4.5 (6) NW & Merseyside 176 4.9 (7) Wales 72 4.9 (7) West Midlands 147 5.2 (9) Yorks & Humberside 148 5.5 (10) North East 84 6.8 (11) Northern Ireland 62 6.9 (12) United Kingdom 1402 4.2 Claimant count (Aug’13) Region ‘000s Rate (%)* Rank Source: Department for Work & Pensions and National Statistics. * As a percentage of Claimant Count + Workforce Jobs.