
Recommandé
Contenu connexe
Tendances
Tendances (20)
Similaire à Financial Business Analysis - Tesla Motors
Similaire à Financial Business Analysis - Tesla Motors (20)
Plus de Sugar Evelyn Bitongga
Financial Business Analysis - Tesla Motors
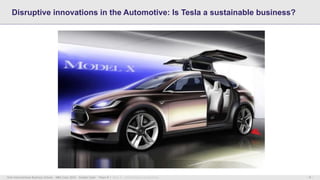
- 1. - 1 -Hult International Business School – MBA Class 2016 – Golden Gate – Team 8 Mod. A – International Accounting Disruptive innovations in the Automotive: Is Tesla a sustainable business?
- 2. - 2 -Hult International Business School – MBA Class 2016 – Golden Gate – Team 8 Mod. A – International Accounting Conclusion Tesla’s economic and financial positions appear to be too fragile for the considering future market developments. The analysis performed reaches the conclusion that currently Tesla’s business model appears not to be sustainable in the long period
- 3. - 3 -Hult International Business School – MBA Class 2016 – Golden Gate – Team 8 Mod. A – International Accounting Executive Summary Automotive Industry Industry Overview: Shifting Paradigm The Companies: Tesla vs Ford The Analysis: Disruptive vs Traditional Operating activities Growth trends Sources of financing ROE and ROA Major findings Conclusion Agenda
- 4. - 4 -Hult International Business School – MBA Class 2016 – Golden Gate – Team 8 Mod. A – International Accounting The present financial analysis focuses on Tesla Motors, a battery-car start-up based in California which promises to set the base for a great paradigm shift in the Automotive Industry In order to better appreciate the importance and the scope of what has been defined by many as the next “Big Thing” the analysis compares Tesla’s economic and financial performances over a 5-year period, from 2010-2014, to Ford’s ones The choice of selecting a company, such as Ford, with a completely different business model, target market and value chain as a main benchmark for Tesla, serves the purpose of gauging the effects of two opposite side of a changing industry on the Companies’ Financial figures and ratios Executive Summary
- 5. - 5 -Hult International Business School – MBA Class 2016 – Golden Gate – Team 8 Mod. A – International Accounting Agenda Executive Summary Automotive Industry Industry Overview: Shifting Paradigm The Companies: Tesla vs Ford The Analysis: Disruptive vs Traditional Operating activities Growth trends Sources of financing ROE and ROA Major findings Conclusion
- 6. - 6 -Hult International Business School – MBA Class 2016 – Golden Gate – Team 8 Mod. A – International Accounting Industry Overview: Shifting Paradigm 15.9% Green Energy Movement: concerned about Environmental sustainability Cost Efficiency: Electric Cars have low cost maintenance when compared with the fuel cars. Innovation: High performance cars with user customization. The Automotive Industry paradigm may be shifting along 3 main axis Comparison between Tesla’s and Ford’s Market share in the Automotive Industry in US [2014; % of total market share] 0.01% INNOVATION GREEN ENERGY COST
- 7. - 7 -Hult International Business School – MBA Class 2016 – Golden Gate – Team 8 Mod. A – International Accounting The Companies: Tesla vs Ford Technology Supply Chain Sales Model R&D Environment Electric Engine User customization Internal Combustion Engine Vertically Integrated Tier-based manufacturing model Company owned sales distribution model Web based selling model Franchisee sales distribution model Disruptive and breakthrough Innovation Incremental Innovation Environment-Friendly Zero-emission target Still in the Initial Phase for Green Energy Development
- 8. - 8 -Hult International Business School – MBA Class 2016 – Golden Gate – Team 8 Mod. A – International Accounting Agenda Executive Summary Automotive Industry Industry Overview: Shifting Paradigm The Companies: Tesla vs Ford The Analysis: Disruptive vs Traditional Operating activities Growth trends Sources of financing ROE and ROA Major findings Conclusion
- 9. - 9 -Hult International Business School – MBA Class 2016 – Golden Gate – Team 8 Mod. A – International Accounting Operating activities 83% 72% 9% 19% 5% 3% TESLA 3.419 FORD 144.077 100% R&D SG&A COGS POSITIVE EBIT Breakdown of Revenues components [2014; $ Mln; % of total revenues] NEGATIVE EBIT 16% 7% COGS increase primarily because of the amount of Raw materials. From 2013 to 2014 the increase in cost was from $228.2 million to $500.2 million SG&A Investments are primarily from higher headcount and costs to support an expanded retail and services R&D Investments have been increasing year by year. In 2014 the increase of almost 50% is primarily to support Model X expenses and Model S upgrades EBIT difference between Gross Income and SG&A and R&D. Gross Income has been increasing but still below their operation expenses The analysis on Operating Activities suggests that Tesla’s current margins do not fit with the current cost structure of production
- 10. - 10 -Hult International Business School – MBA Class 2016 – Golden Gate – Team 8 Mod. A – International Accounting Tesla’s profitability over the previous five years has seen some dramatic changes, though one thing has remained constant: their losses The losses mainly pertain to Tesla’s fast development as a relative newcomer in the automotive industry Ford’s sales continuously have risen, yet the growth of Tesla is exponential in comparison In terms of Tesla’s gross profit ratio, although this ratio dictate more cost than revenue, they remain higher than the industry giant Ford Growth Trends Trend of Tesla’s Revenues [2010 – 2014; $ Mln] 413204117 +59% 3.198 2014201220112010 2013 2.013 20122011 2013 40 20 35 30 20142010 25 FORD TESLA Gross Profit Ratio trend comparison [2010 – 2014; %] On the profitability side historical data confirm that If they continue on their trajectory, their sales and operations will start to become profitable
- 11. - 11 -Hult International Business School – MBA Class 2016 – Golden Gate – Team 8 Mod. A – International Accounting The automotive sector due to its capital-intensive structure, relies more than any other sector on heavy borrowing Ford Debt-Equity percentage show a year on year decrease on the last five years, Tesla, displays a more irregular pattern. Its reliance on debt has increased in the last years The comparison with Ford becomes interesting when comparing Total Debt and Total Asset. In this case it appears like, despite of a heavy reliance on debt compared to other sources of financing, Tesla is well below the average level of Ford and the main Automotive players Sources of Financing 2 8 4 6 0 2010 2011 20142012 2013 12 10 FORD TESLA Liabilities to Equity trend comparison [2010 – 2014; Absolute value] Even though ratio analysis shows that the actual level of debt is well managed, the strong leverage Tesla is exploiting now has to be backed up by a considerable amount of profits in the year to com 201320112010 20142012 10 50 60 40 70 30 20 TESLA FORD Total Debt and Total Assets trend comparison [2010 – 2014; Absolute value]
- 12. - 12 -Hult International Business School – MBA Class 2016 – Golden Gate – Team 8 Mod. A – International Accounting ROE and ROA ROE % ROA % -37 -118-113 -200 -150 -100 -50 -250 0 -19 -227 -46 0 -10 -30 -50 -60 -20 -40 -4 -7 -43 -60 12 34 282 0 100 150 250 300 50 2010 200 20122011 20142013 37 2 4 12 8 6 10 2 12 4 2012 20132011 20142010 4 3 2010 2011 2012 2013 2014
- 13. - 13 -Hult International Business School – MBA Class 2016 – Golden Gate – Team 8 Mod. A – International Accounting Agenda Executive Summary Automotive Industry Industry Overview: Shifting Paradigm The Companies: Tesla vs Ford The Analysis: Disruptive vs Traditional Operating activities Growth trends Sources of financing ROE and ROA Major findings Conclusion
- 14. - 14 -Hult International Business School – MBA Class 2016 – Golden Gate – Team 8 Mod. A – International Accounting In performing the analysis on Tesla’s operating activities and cash flows and comparing with Ford’s, focusing on Tesla’s variability was paramount. Ford’s stability as an incumbent showed limited variability. These indications are key to analyzing the entrant of a innovative start-up to a long time incumbent. The conclusion on operating activity analysis suggests that Tesla’s current margins do not fit with the cost structure of production. If the trend continues along its current trajectory, its hard to imagine that it will be sustainable in the long term. Revenues are growing at a promising rate even though there are still concerns regarding the sustainability of the income statements lines i.e. gross profit margin net income and EBITDA. Looking at the capital and debt structure of Tesla, the company is currently benefiting from a low rate of debt issuance and high level of capital injection from the market. Nonetheless, the current method Tesla is using to manage debt and capital leverage appears to not be sustainable in the long term. Major findings Operating Activities Growth trends Sources of Financing
- 15. - 15 -Hult International Business School – MBA Class 2016 – Golden Gate – Team 8 Mod. A – International Accounting Agenda Executive Summary Automotive Industry Industry Overview: Shifting Paradigm The Companies: Tesla vs Ford The Analysis: Disruptive vs Traditional Operating activities Growth trends Sources of financing ROE and ROA Major findings Conclusion
- 16. - 16 -Hult International Business School – MBA Class 2016 – Golden Gate – Team 8 Mod. A – International Accounting Conclusion Tesla’s economic and financial positions appear to be too fragile for the considering future market developments. The analysis performed reaches the conclusion that currently Tesla’s business model appears not to be sustainable in the long period
Notes de l'éditeur
- to accelerate the advent of sustainable transport by bringing compelling mass market electric cars to market as soon as possible” this is part of Tesla mission’s statement which I want you to remember through this presentation
- Today we will be presenting our financial analysis which focuses on Tesla Motors, an electric vehicle start-up based in California which promises to set the base for a great paradigm shift in the Automotive Industry. Today we will present the understanding, framing and conclusions over the sustainability of the disruptive business model Tesla has been carrying over one of the biggest and strategically important markets in the World’s economy. In order to better appreciate the importance and the scope of what has been defined by many as the next “Big Thing” our analysis compares Tesla’s economic and financial performances over a 5-year period, from 2010-2014, to industry giant and incumbent Ford Motors. The purpose for choosing a company, such as Ford, with a completely different business model, target market and value chain as a main benchmark of Tesla serves the purpose of gauging the effects of two opposite sides of a changing industry on the Companies’ Financial figures and ratios.
- The automotive sector due to its capital-intensive structure, relies more than any other sector on heavy borrowing
- Today we will be presenting our financial analysis which focuses on Tesla Motors, an electric vehicle start-up based in California which promises to set the base for a great paradigm shift in the Automotive Industry. Today we will present the understanding, framing and conclusions over the sustainability of the disruptive business model Tesla has been carrying over one of the biggest and strategically important markets in the World’s economy. In order to better appreciate the importance and the scope of what has been defined by many as the next “Big Thing” our analysis compares Tesla’s economic and financial performances over a 5-year period, from 2010-2014, to industry giant and incumbent Ford Motors. The purpose for choosing a company, such as Ford, with a completely different business model, target market and value chain as a main benchmark of Tesla serves the purpose of gauging the effects of two opposite sides of a changing industry on the Companies’ Financial figures and ratios.