Aug2013 Heidi Rehm integrating large scale sequencing into clinical practice
EHA poster Genomic Analysis by MyAML with Chemotherapy
1. CORRELATION OF GENOMIC ANALYSIS BY MYAML™ WITH IN VITRO HIGH THROUGHPUT DRUG SENSITIVITY TESTING
IN NEW DIAGNOSIS AND RELAPSED ACUTE MYELOID LEUKEMIA
Pamela S. Becker, Michael W. Schmitt, Lawrence A. Loeb, Weiyi Gu, Qi Wei, Zhiyi Xie, Andrew R. Carson, Timothy Martins, Carl Anthony Blau, Vivian Oehler, Ka Yee Yeung
University of Washington and Fred Hutchinson Cancer Research Center, Seattle, WA; University of Washington, Tacoma, WA; Invivoscribe, San Diego, CA
INTRODUCTION
ABSTRACT
The promise of precision medicine is that knowledge of the genomic alterations present within a
cancer will enable better choices for therapy.
Even after sequencing reveals the mutations present in an individual patient’s tumor, this
information usually does not tell us how to best treat the cancer, with rare exception, such as FLT3
mutations and FLT3 inhibitors. Moreover, because of genomic instability, the clonal composition of
the leukemia changes over time, from diagnosis, to relapse, to refractory disease, and new
mutations may arise.
MyAML provides analysis for individual mutations tailored to patients with acute myeloid leukemia
(AML). The MyAML panel includes the coding an noncoding exons, including the 5' and 3' UTRs of
196 genes known to have recurrent mutations in AML. Analysis for the 36 genes involved in the
majority of chromosomal translocations found in AML is also provided. The average depth of
coverage is 1000X.
For a panel of 24 patient samples for which we had in vitro high throughput chemosensitivity data
for 160 chemotherapy drugs, we obtained mutation data. We then sought to correlate the mutation
data with the chemotherapy sensitivity data.
RESULTS
UW Sample ID Age Gender Ethnicity % blast (clinic) % blast (lab)
Clinical Data MyAML Calls Clinical Data MyAML Calls Clinical Data MyAML Calls
FLT3 FLT3-ITD FLT3-TKD NPM1 NPM1 Structural Variants Structural Variants
39 51 M Caucasian 31.4%+ 13.8% ND ND 60bp ITD neg ND None None
55 69 F Caucasian 80 80 neg neg neg neg neg None None
59 53 F Caucasian 87 93 pos 51bp ITD neg neg neg None None
60 61 M Caucasian 89 97 neg neg neg neg neg t(8;12) None
62 56 F Caucasian 72 74 pos 18bp ITD neg pos COSM158604 None None
63 19 F Caucasian 12 71 neg neg neg neg neg inv16 inv16
71 67 M Caucasian 34 87 neg neg neg pos COSM158604 t(6;14) None
77 22 M Native American ND 69 neg neg D835Y neg neg t(8;21) t(8;21)
78 63 M Asian 42 78 neg neg neg ND neg None None
83 32 M Hispanic 44 89 neg neg D835H neg neg inv 16 Inv16
98 49 M Caucasian 63 88 neg 3bp ITD; 81bp ITD neg neg neg None None
99 54 M Caucasian 82 85 pos neg neg neg neg inv 16 Inv16
133 38 F Asian 22 95.1 pos 45bp ITD neg pos COSM20859 None None
135 67 M Caucasian 39 98.5 neg neg neg ND neg None t(10;19)
138 76 M Caucasian 52 ND neg neg neg ND neg None None
140 62 M Caucasian 43.5 80 neg neg neg neg neg None t(5;11)
141 53 M Caucasian 98 85 ND neg neg ND neg None None
144 83 F Caucasian 52 75.2 neg neg neg neg neg None None
149 72 M Caucasian 82 92.3 ITD-;D835+ neg D835Y ND neg inv(3) None
154 70 M Caucasian 97 99.1 pos 39bp ITD neg pos COSM158604 None None
156 58 M Caucasian 81 ND neg neg neg ND neg None None
157 47 F Caucasian/Hispanic 42 ND ND neg neg ND neg t(1;10) + t(1;5) None
159 63 F Caucasian ND 86.1 pos 72bp ITD neg neg neg t(6;9) t(6;9)
161 39 F Asian 80 ND neg neg neg neg neg t(9;11) + t(4;22;6) + t(6;12) + t(6;7) t(4;6) + t(4;22) + t(6;12) + t(9;11)
153 ND ND ND ND 80.5 ND 90bp ITD neg ND neg ?der(5), t(5;9)t(6;9),?der(6)?der(9) t(6;9)
For the 24 patient samples analyzed to date, an average of 129 missense mutations were identified in each
sample with an allelic frequency > 5%. These samples also contained an average of over 12 coding indels (~5
frameshift and 7 inframe indels) per sample.
• 3.4 Mb of DNA spanning the exons and a subset of introns from 196 genes were targeted by
MyAML baits.
• 0.5-1.0 μg of patient DNA was sheared before hybridizing to MyAML baits.
• Captured target DNA was then sequenced using an Illumina platform.
• Customized bioinformatics pipeline identifies and characterizes SNVs, indels, SVs, and CNVs.
• Average sequencing depth greater than 1000x.
• More than 95% of targeted bases have at least 100x depth.
• Most commonly mutated genes in AML are all targeted with average depth of coverage of 975x
(range = 417x to 1370x).
• Overall analytical sensitivity >96% and specificity >99.99% for SNVs.
• Overall analytical sensitivity >95% and specificity >99.98% for indels.
• 100% sensitivity and 100% specificity for known pathogenic mutations, including missense and
nonsense mutations in FLT3, DNMT3A, IDH1, IDH2, KIT, NRAS, KRAS, & TP53.
• Accurately detect SNV and indels with allelic frequencies as low as 2.5%.
• >95% reproducibility for SNVs and indels at allelic frequencies as low as 2.5%.
1. Blood and/or bone marrow samples are obtained from the patient, enriched to ≥ 80% blasts after density depletion and
magnetic bead separation , if needed.
2. Eight 384 well plates accommodate duplicate testing of 160 drugs (chemotherapy and targeted agents, 56 FDA approved,
104 investigational) at 8 concentrations each and controls.
3. Cells are added to matrix protein coated non-tissue culture-treated 384-well plates at a density of 5,000 cells per well in
50μL of complete media using a Thermo Scientific Matrix WellMate, and incubated overnight to allow attachment.
4. Compounds (50nL) are added (ranging from 5 pM to 100 μM) to patient samples using the CyBio CyBi-Well Vario and
incubated at 37C, 5% CO2 for 96 hours.
5. CellTiter- Glo (Promega) is dispensed into the individual wells with the WellMate and following 20 minutes incubation on
an orbital shaker, luminescence is measured on a Perkin Elmer EnVision Multi-label plate reader.
6. Percentage cell viability is reported as relative to the DMSO solvent control.
7. After 4 days, the results are obtained. EC50 values are calculated by fitting data using least squares method to the
standard four-parameter logistic model where: “Y” = (“Ymin”+(“Ymax”/(1+((“X”/”IC50”)Slope), and Y = % viability, Ymin =
minimal % viability, Ymax = maximal % viability, X = compound concentration, EC50 = concentration of compound
exhibiting 50% inhibition of cellular viability, Slope = the slope of the resultant curve. Curve fitting is performed using idbs
XLFit software (Microsoft Excel).
8. Then, an appropriate drug is selected to treat the patient choosing lowest EC50 for a drug that is able to be procured.
9. Dosing is at Maximal Tolerated Dose as previously reported for that drug.
METHOD for High Throughput Screen
METHOD for Mutation analysis by MyAML
METHOD for Statistical Analysis
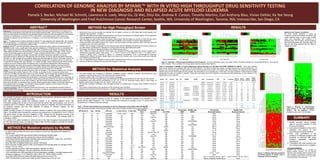
Figure 1: Heatmaps of Drug Chemosensitivity for the 24 patients. Survival is indicated in green, cell death in black. The patient samples are horizontally distributed, the drugs are
listed vertically. This is a subset of the drugs, those commonly used to treat leukemia.
Drug concentration: 1 X 10e-6 M 3 X 10e-7 M 1 X 10e-7 M
Table 2: Comparison of MyAML to Duplex sequencing method (Schmitt et al. Nat Meth 2015 PMID 25849638) for AML39. There were mutations
seen by both methods, and mutations seen with one of the methods. The failure to detect the mutation by duplex sequencing could be explained by not
getting much sequencing depth at those positions (some of these positions had 0 depth in the duplex data, likely because the capture set only targeted
specific exons of some of the genes and the mutation may have fallen in a non-targeted exon. There were 3 low-level mutations in AML39 seen by duplex
sequencing that were not reported by MyAML. These were well below the limit of detection of conventional DNA sequencing, so their absence in the
MyAMLdata is to be expected/
Table 1: Clinical characteristics and comparison of clinical cytogenetics and mutation data with MyAML.
Note: Discordance between Clinical Data and MyAML calls is due to analysis at different time points in patients.
● This initial analysis was conducted to determine correlations between missense mutations (non-synonymous point
mutations) in specific genes, and in vitro cytotoxicity with individual drugs.
● Missense mutations with ≥ 5% frequency were included (150 genes).
● % cell survival in the high throughput assay was performed at 8 different concentrations for each drug and each patient.
● Interpolations were performed at concentrations of 10-6, 10-7, 3 X10⁻⁷ M, assuming linearity within a close range. All
negative values were converted to 0%, all values > 100% to 100%.
● The pairwise correlation coefficients were calculated between all possible pairs of (drugs, gene mutations) across 24
patients.
● The p-values corresponding to the significance of the correlation were calculated.
● Analyses were performed using both Pearson’s correlation coefficient and rank-based Spearman’s correlation.
Figure 2: Heatmap of chemotherapy
drug toxicity in our high throughput
screen for 24 patients. Green
represents cell survival, red cell death.
Spearman and Pearson correlations.
We found several significant p values for
mutations in genes that exhibited correlations with
certain leukemia drugs. In some cases, multiple
drugs were associated with mutations in a
particular gene, and for others, several mutations
were found associated with individual drugs. The
data are still being analyzed and we intend to
validate the results.
RESULTS
Figure 3: Heatmap depicting mutations
as present (green) or absent (red) in
150 genes for the 24 patients.
1. MyAML provided robust mutation
data for recurring mutations in AML
for these 24 patients.
2. Each patient exhibited a unique set of
mutations and unique in vitro
chemotherapy sensitivity patterns.
3. Rank order correlations of the
presence of missense mutations with
sensitivity to individual AML drugs
revealed statistically significant
associations.
4. Correlations with indel mutations and
non-coding mutations are in progress.
ACKNOWLEDGEMENTS
Genection and Invivoscribe, Inc. provided the
MyAML mutation analyses. The Life Sciences
Discovery Fund provided research funding for the
high throughput chemotherapy sensitivity assay.
We are grateful to Sylvia Chien and Jin Dai for their
technical expertise in the laboratory.
Sample Chr Position REF ALT COSMIC dbSNP Gene Consequence CDS AA Frequency
Seen in
duplex?
duplex
coverage
duplex
mutations
duplex
mutant
fraction
AML39 19 33793186 T G CEBPA synonymous c.135A>C p.P45P 1.08% no 40 0 0.0%
AML39 2 25498405 T C DNMT3A synonymous c.456A>G p.E152E 1.68% no 0 0 ND
AML39 2 209108301 T C rs34599179 IDH1 missense c.548A>G p.Y183C 49.54% no 0 0 ND
AML39 2 209108317 C T COSM97131 rs34218846 IDH1 missense c.532G>A p.V178I 50.78% no 0 0 ND
AML39 2 209113192 G A COSM253316 rs11554137 IDH1 synonymous c.315C>T p.G105G 49.56% yes 258 139 53.9%
AML39 12 25368462 C T rs4362222 KRAS synonymous c.483G>A p.R161R 99.83% no 0 0 ND
AML39 1 115258744 C T COSM573 rs121434596 NRAS missense c.38G>A p.G13D 6.11% yes 2227 118 5.3%
AML39 1 115258748 C A COSM562 rs121913250 NRAS missense c.34G>T p.G12C 33.62% yes 2227 784 35.2%
AML39 21 36259157 G C RUNX1 missense c.334C>G p.L112V 93.13% yes 247 238 96.4%
AML39 4 106196951 A G rs2454206 TET2 missense c.5284A>G p.I1762V 48.28% yes 383 176 46.0%
AML39 17 7579472 G C COSM250061 rs1042522 TP53 missense c.215C>G p.P72R 99.59% yes 258 258 100.0%
Mutations seen by duplex, but not in MyAML
AML39 12 112888145 T C yes 1161 2 0.2%
AML39 1 115258747 C G yes 2243 2 0.1%
AML39 1 115258747 C T yes 2243 11 0.5%
SUMMARY
Background: Whole genome sequencing has demonstrated tremendous heterogeneity in the mutations and
chromosomal translocations associated with acute myeloid leukemia (AML), yet we remain quite limited in our
ability to predict specific chemotherapy drug sensitivity based on genomics with the exception of a few selected
mutations or translocations, such as FLT3-ITD or PML-RARA. The overall survival in AML remains poor,
especially for patients who are refractory to ≥ 2 regimens, or for those with brief duration of first complete
remission.
Aims: 1. To categorize the mutations identified by MyAML™ in new diagnosis and relapsed AML, and correlate
with clinical features. 2. To determine if specific mutations or patterns of mutations will correlate with results of
in vitro high throughput drug sensitivity testing in AML.
Methods: MyAML™ uses next generation sequencing to analyze the coding regions and potential genomic
breakpoints within known somatic gene fusion genomic breakpoints of 194 genes known to be associated with
AML. Fragmented genomic DNA is captured (3.4Mb) with a customized probe design, and sequenced with
300bp paired end reads on an Illumina MiSeq instrument to an average depth of coverage >1000x. Using a
custom bioinformatics pipeline, MyInformatics™, single nucleotide variants (SNVs), indels, inversions and
translocations are identified, annotated, characterized, and allelic frequencies calculated. Commonly
associated variants in dbSNP and 1000 genomes were eliminated, as well as variants with allele frequencies
less than 5%. High throughput drug sensitivity testing was performed against a panel of 160 drugs, of which 56
are FDA approved and 104 are investigational. De-identified samples from 12 patients with de novo AML and
12 patients with relapsed AML were analyzed. For 2 patient samples, Duplex Sequencing was also performed
to detect sub-clonal mutations below the detection limit of conventional nextgeneration DNA sequencing.
Statistical analysis was performed to examine relationships between gene mutations and drug sensitivity
profiles. Specifically, we computed the Pearson’s correlation between all possible pairs of genes containing
missense mutations and the in vitro cytotoxicity response across the same set of 24 patients.
Results: From the 24 patient samples analyzed to date, an average of 129 missense mutations were identified
in each sample with an allelic frequency >5%. Of these, an average of over 21 missense variants were
observed in COSMIC and less than 3 were novel (not in dbSNP). These samples also contained an average of
over 12 coding indels (~5 frameshift and 7 inframe indels per sample). In addition, MyAML™ identified 3
samples with inv(16) and 6 samples with translocations, including the cryptic NUP98-NSD1 t(5;11) that was not
detected by karyotyping. For 2 of the samples, Duplex Sequencing was performed at a depth of at least 6000X,
and showed concordance of some of the mutations, with each method identifying additional mutations not
observed by the other, an expected finding, as each method targeted distinct regions, and Duplex Sequencing
had a greater depth of coverage. The correlative studies between mutations and the results of the high
throughput drug sensitivity testing are in progress.
Summary/Conclusion: Data from disease focused genomics and in vitro chemotherapy sensitivity testing of
individual patient AML samples will likely lead to innovation in treatment, identification of novel targeted agents,
and improved outcomes in AML.