SlideShare une entreprise Scribd logo
1  sur  8
Télécharger pour lire hors ligne
Introduction
When we wrote our Baltic Outlook in October, the
memories of September’s collapse of the global financial
system were fresh and its consequences was only starting
to reveal its dramatic nature. Expectations continued to
dwindle rapidly and forecasts were cut in every month
and week. It seems that for now the signs of panic have
retreated, albeit expectations continue to worsen and one
cannot see the stabilisation or improvement of forecasts
yet. Optimists have left the scene and people are adjusting
their actions for a gloomier future.
The three Baltic countries were moving toward recession
even before September’s developments shook the global
financial system. However the global financial and
economic crisis has made the outlook for these three
economies much worse and now the possible outcomes
are between bad and worse. Domestic factors are now
less important than external ones, as external financing
and expectations are those which set the scope of actions
in the region. However, good intentions and ideas can not
materialize if the external environment remains extremely
hostile towards the three countries.
Our expectations about the Estonian, Latvian and
Lithuanian economic developments have worsened
significantly. We expect a significant economic decline
due to falling domestic and external demand this year,
and even the year 2010 will not bring positive growth,
albeit the year-end growth rates may turn positive.
Negative processes in the economy mean that prices of
goods, services, labour and assets will continue to fall,
and annual deflation a very possible scenario in 2009-
10. The global economic situation will make it extremely
difficult to increase exports, but weak domestic demand
and shrinking external financing will mean a fall in the
amounts of imports, which will end up with a significant
improvement in foreign balances.
The governments’ opportunities to help their economies
are narrow and hence they have concentrated mostly
on stabilising the situation and then, if possible, helping
businesses. Social tensions are increasing, and if political
problems are not solved or get worse, the situation in the
economies might turn extremely bad. An open dialogue
between the public, the corporate sector and authorities
is a must as this could ease tensions and bring up good
ideas for change and improvement.
2003 2004 2005 2006 2007 2008f 2009f 2010f
Economic growth, %
Estonia 7.1 7.5 9.2 10.4 6.3 -2.6 -7.0 1.0
Latvia 7.2 8.7 10.6 12.2 10.3 -2.2 -10.0 -2.0
Lithuania 10.2 7.4 7.8 7.8 8.9 3.2* -6.0 -3.0
Average consumer price growth, %
Estonia 1.3 3.1 4.1 5.1 6.6 10.4* 1.0 1.2
Latvia 2.9 6.2 6.9 6.6 10.1 15.4* 0.0 -6.5
Lithuania -1.1 1.2 2.7 3.7 5.7 10.9* 5.0 3.0
Current and capital account balance, % of GDP
Estonia -10.6 -11.0 -9.2 -14.6 -16.9 -8.5 -0.5 0.0
Latvia -7.5 -11.8 -11.2 -21.3 -21.8 -13.3 -3.3 0.1
Lithuania -6.4 -6.4 -5.8 -9.5 -12.8 -11.0 -3.2 -2.5
* actual
Macro Outlook, The Baltic Region, January 2009 HANSABANK MARKETS
The Baltic
Outlook: Update
2 Estonia
Estonia
We have cut our expectations substantially due to the
worsening global economic situation and the hostile
financial environment. We expect the Estonian economy
to fall 5-8% in 2009 with a slight recovery in 2010 (with a
possible decline in the 1st
half of that year). The economy
is about to see monthly deflation turn into an annual price
decrease in the 2nd
half of 2009, a rapid correction of the
current account deficit and growing unemployment.
Contributions to Real GDP Grow th
-15%
-10%
-5%
0%
5%
10%
15%
20%
25%
2006 2007 2008f 2009f 2010f
Households Gov ernment Inv estments
Net exports Errors Economic growth
Source: ESA, HBM calculations and forecast
The economy will decline in 2009, due to falling domestic
demand,by6-9%ashouseholdspendingdeclinesby5-8%,
government consumption by 2-3% and investments by 13-
16%. Exports are expected to fall, but imports’ decline will
be deeper and net exports will contribute positively to GDP
growth like what happened in 2008. In 2010 the economy
is expected to grow 0.5-3% as investments are expected
to show a recovery, household consumption to shift into
slightly positive territory and net exports to contribute
positively. The government’s contribution may be slightly
positive or negative depending on policy choices they are
about to do in 2009.
Our forecast, which may look too positive regarding 2010,
is based on several assumptions. First, we expect that
foreign direct investments will start to increase in the
2nd
half of 2009 as asset prices continue falling, making
them attractive to investors. Falling wages and growing
unemployment should support production transfers to
Estonia (e.g. from Finland, Sweden, Germany) especially
when taking into account the lower wage costs here
(now ca EUR 7.5 per hour) and room for productivity
improvement. However, those investments should take
into account the long-term convergence process (e.g.
diminishing labour supply which eventually results in
higher wage level).
The second factor, which we count as positively affecting
the economy, is transfers from different EU funds. The
amount available from this source is substantial, and if
Brussels’ promise of earlier distribution of some funds
along with diminishing its bureaucracy stands (contingent
on the improvement of administrative work in Estonia),
we can expect that 60-70% of EU funds currently
planned in the budget will be used. However, this scenario
also requires that the problem of finding co-financing
of related projects can be solved. For this, different
types of government actions are needed (e.g. extending
guarantees for bank loans, etc).
The third factor, which affects our economic processes
negatively, but has very important implications for
overall economic development, especially in 2009, is
external financing through commercial banks. We are
highly sceptical about forecasting that domestic banks
will have to relay on domestic sources (i.e. deposits and
back-payment of loans). This and an increasing level of
bankruptcies will end up with domestic and external debt
falling in 2009 and 2010. Interest rates will continue to
fall but are to remain high due to the cost of funding and
elevated risk assumptions, and that will make private
investments difficult without governmental support. Poor
access to loans and the high cost of borrowing will be one
reason we expect that takeovers of domestic companies
will increase in 2009-2010.
The EU funds and FDI are sources which will gradually
start to support investments. However, the decline in
investments will be sharp as residential construction,
which we now expect to remain minimal for 2-3 years,
gained elevated shares during 2006-2007’s construction
boom. Increasing competition and lower prices may end up
with a real growth in public investment, although the sums
available for investments will diminish (practically the
only way to make public investments is from EU funding).
Falling prices of construction should help investments,
but investments into machinery and equipment require
positive outlook besides finances. Recent months have
deeply undermined companies’ confidence, which will
affect investments in the 1st
half of 2009 significantly.
We expect the number of employed persons to decrease
4-6% and total wage payments to fall up to 15% in 2009.
Still, we also expect non-activity to increase and labour
outflow as well (e.g. to non-attractive Finnish regions;
Current And Capital Account, % of GDP
-25%
-20%
-15%
-10%
-5%
0%
5%
10%
2007 2008f 2009f 2010f
Trade and serv ices Priv ate tranf ers, wages
Gov ernment transf ers Other
Reinv ested prof its
Source: EP; HBM calculations and forecast
3Estonia
mostly in 2010). Wage payments will decrease due to their
loweringalongwithdiminishedworkinghours.Thisprocess
(supported by changes in the labour market regulations
from July 2009) is expected to improve the efficiency of
production and grant the survival of stronger companies
even in this extremely difficult economic situation.
The build up of precautionary reserves, which started in
late 2007 and early 2008, may stop at the most difficult
times, but a few months after forecasts stabilize (i.e. not
turning worse) households may start timidly increase
their spending and savings as well. The stabilisation of
unemployment rate (maybe in the 1st
half ot 2010) should
increase confidence, and the lower prices of goods and
services will leave households with higher disposable
income.
Producer price deflation arrives already in early 2009
and construction prices are already falling, but consumer
price deflation in annual comparison may arrive in
the 3rd
quarter of the year; cuts in heating tariffs (ca
40%) will contribute significantly to consumer price
deflation and also to disposable income growth. The
end of administrative price increases and lowering
wages make possible, and weak demand and increasing
competition will force companies to cut prices. Weakening
currencies of Sweden, Poland and Russia will increase
pressure on exporters and retail prices even more – so
success in cutting prices might be a key to survival for
many companies. Those developments are about to cut
required profitability levels, which in 2006-2007 reached
extraordinarily high levels, even remaining relatively high
in the 3rd
quarter of 2008 (6.8% in average on 12-month
basis).
The Estonian government is about to cut budget spending
plans in February-April. This is not only because the
government is targeting Euro adoption (and related to
that the 3% of GDP budget deficit limit). Although the
Estonian government has reserves, they are not big
enough to cover the budget deficit for more than 1-2 years
if existing spending plans are continued, as tax revenues
are weak. Hence, borrowing is required, but with current
lending terms it is difficult and economically unreasonable.
Therefoe, one may say that the Estonian government
is forced to cut spending to avoid a troubled financial
situation in 2010-11. But we also expect that budget cuts
will be made so that they improve the efficiency of public
services, and spending will be increased in areas important
for recovery (e.g. granting the use of EU funds, labour
market activities, education, etc.). Supportive monetary
policy measures would be highly welcome (e.g. lowering
reserve and capital requirement).
Maris Lauri
Confidence (3-months average, s.a.)
-70
-60
-50
-40
-30
-20
-10
0
10
20
30
40
50
Jul.02 Apr.03 Jan.04 Oct.04 Jul.05 Apr.06 Jan.07 Oct.07 Jul.08
Industry Consumer Construction
Retail trade Serv ices
Source: EKI; HBM calculations
2003 2004 2005 2006 2007 2008f 2009f 2010f
Economic growth, % 7.1 7.5 9.2 10.4 6.3 -2.6 -7.0 1.0
GDP, EURm 8,693 9,651 11,091 13,104 15,270 15,860 15,000 15,900
GDP per capita, th kroons 100.5 111.9 128.9 152.6 178.1 185.0 180.0 180.0
euros 6,424 7,153 8,239 9,754 11,381 11,830 11,200 11,900
Growth of industrial production, % 11.0 10.5 10.9 10.0 6.8 -6.0 -10.0 2.0
Growth of GDP deflator, % 4.6 3.3 5.3 7.0 9.6 6.8 2.5 3.0
Growth of consumer prices, % 1.3 3.1 4.1 5.1 6.6 10.4* 1.0 1.2
Growth of harmonized consumer price index, % 1.4 3.0 4.1 4.5 6.7 10.6* 1.2 1.3
Growth of producer prices, % 0.2 2.9 2.1 4.5 8.3 7.2* -1.5 1.5
Harmonized unemployment rate (average), % 10.0 9.7 7.9 5.9 4.7 5.8 9.5 9.0
Real growth of average monthly gross wage, % 8.0 5.1 6.1 10.5 13.0 3.5 -3.0 1.0
Growth of exports of goods and services, % 9.3 16.8 26.0 19.2 6.9 6.8 -6.5 3.0
Growth of imports of goods and services, % 10.0 16.2 23.5 26.6 7.5 -2.0 -12.0 2.0
Balance of goods and services, % of GDP -7.4 -7.4 -6.4 -11.8 -11.3 -4.2 -1.0 -0.5
Balance of current and capital account, % of GDP -10.6 -11.0 -9.2 -14.6 -16.9 -8.5 -0.5 0.0
Inflow of FDI, % of GDP 9.5 7.4 20.8 14.6 12.8 8.0 7.8 7.0
Foreign gross debt, % of GDP 64.5 76.1 86.2 97.4 112.3 110.0 105.0 94.0
General government budget position, % of GDP 1.8 1.7 1.9 3.6 3.3 -1.8 -3.4 -2.5
General government debt, % of GDP 5.5 5.0 4.4 4.0 3.0 2.7 3.5 4.0
*actual
4 Latvia
Latvia
We foresee a deep and long recession. There will be no
growth support from the exports side and deflation is
inevitable. Our forecasts are based on the assumption
that the world economy will start to recover in mid 2010.
We expect GDP to fall ca 2% in 2008 and ca 10% in 2009
(we forecasted -1% and -4% before). In line with global
developments, Latvian economy is expected to start
recovering only in the 2nd
half of 2010; however, growth
for the whole of 2010 will still be negative. Productivity
deterioration might continue in 2009, nevertheless, with
weaker businesses going bankrupt, it will improve in 2010.
It has to be noted that there are strong downside risks
attached to this forecast.
Contributions to GDP Annual Grow th, pp
-30
-20
-10
0
10
20
30
2004 2005 2006 2007 2008f 2009f 2010f
Households consumption Gov ernment consumption
Gross capital f ormation Exports
Imports GDP
Source: CSBL; HBM calculations and forecast
The fall in household consumption was deepened in the
4th
quarter and will continue to do so throughout 2009. A
slow recovery is expected only in the 2nd
half of 2011. The
share of household consumption in GDP went up to an
unsustainable 72% in 2007 and we expect it to fall to the
historical average of ca 60% by the end of current crisis.
Thus a fall in household consumption by 16% will exceed
the GDP decline. Consumption will be cut by:
Delining employment - unemployment rate will●
reach its peak in 2010 at ca 16%.
Wage cuts for many of those who keep their●
jobs, enabled by disappearing bargaining power of
employees and a low degree of unionisation. The
average fall in nominal wages will be ca 15% in 2009,
partly through the virtual disappearance of bonuses.
The fall will decelerate in 2010.
Credit squeeze. Loan stock started to fall in●
November and will probably continue to do so
in 2009-2010, driven by pessimism, tighter loan
conditions and high risk premiums.
Government consumption will diminish in 2009-2010 as
well, suppressed both by the terms of the IMF Stand-By
Arrangement and weak tax revenues (see below).
As margins and profits fall, credit is scarce and expensive,
and demand outlook is unfavourable, businesses will be
neither able nor willing to sustain investments at previous
levels. In 2009 investments will fall by 30%. However,
investments will recover ahead of household consumption,
already by the 2nd
half of 2010. Nevertheless, the overall
number for 2010 will be negative. Construction activity is
expected to be very low for several years.
After surprisingly strong export performance in early
2008 it swiftly deteriorated as global crisis deepened.
Imports were falling already in the 1st
half of the year but
the decline accelerated in the 3rd
quarter. With decrease
in world demand being bigger than anticipated before,
appreciating EUR as well as credit squeeze, exports are
expected to decline in 2009 and remain stable or grow
slowly in 2010 in nominal terms. Falling domestic demand
will accelerate the reduction of nominal imports in 2009
and, unlike for exports, the trend will remain negative also
in 2010. Consequently, current account deficit is expected
to improve swiftly, reaching ca 5.5% and 3% in 2009 and
2010, respectively. We expect external financing to remain
limited in 2009 and 2010 due to global credit crunch.
With current global deflationary pressures and planned
wage cuts, deflation, mentioned as the November
Outlook, is now very likely for the 2nd
half of 2009. The
year will start with double-digit annual inflation, yet it
will decelerate even more sharply than in 2008 (except
in January-February, due to tax changes). Thus average
CPI growth in 2009 is forecast to be around 0%. World
price decreases, depreciation of currencies in Latvia’s
trade partner countries and fall in domestic consumption
will force Latvian companies to cut prices and wages,
as they are preconditions for restoring international
competitiveness. In 2010 we forecast prices to remain
stable on average; however, due to the base effect of 2009
adjustments, we expect prices also to fall on average in
2010. The exchange rate regime is expected to stay intact,
making the implementation of activities set out in Stand-
By Agreement crucial.
Current Account, % of GDP
-30
-25
-20
-15
-10
-5
0
5
10
1996
1997
1998
1999
2000
2001
2002
2003
2004
2005
2006
2007
2008f
2009f
2010f
Trade in goods and serv ices Compensation of employ ees
Interest (debt and portf olio) Div idends
Transf ers Current account
Source: LaB; HBM calculations and forecast
5Latvia
Economic policy
Latvia now faces two main issues to deal with:
In the short run: removing the liquidity squeeze,●
exacerbated by the Parex takeover. It is an urgent
issue for both, the government and businesses. As
the government at least has some access to finance,
it should try to alleviate the situation of companies,
for example, through tax postponements.
In the medium and long run: regaining●
competitiveness as well as moving the economy’s
product mix towards goods and services demanded
in external markets
In order to improve competitiveness, both wage restraints
or outright reductions as well as productivity gains and
efficiency enhancements are necessary. While falling
real incomes are undesirable, in the short run they are
unavoidable as the other, more pleasant route — doing
more with less – cannot be implemented rapidly enough.
IMF Stand-By Arrangement* (SBA) was released in
January, supplemented by EU and several neighbouring
countries and totalling EUR 7.5b for the period of 27
months. SBA tackles liquidity problem by providing
financing for rolling over commercial bank debt and
financing the budget deficit. In order to make the
currency peg sustainable, public payroll cost decreases
and structural reforms are imposed as a pre-condition.
The government implemented several other measures .
For instance, changes in tax policy and aggressive cuts on
other spending besides payroll, bringing the total impact
on the earlier 2009 budget up to 7% of GDP. 1/3 of this
adjustment is coming from the revenue side (e.g. VAT and
excise increase, capital income tax from 2010) and 2/3
from cutting expenditures. The government is required
to reduce public sector wage bill by ca 30% from 2008
level, of which ca. 5 pp is through lay-offs, 25 pp through
wages, partly by elimination of bonuses. Most of the other
current spending positions of the general government are
to be cut by ca 25%.
The program also requires the government to implement
measures aimed at higher GDP growth in the future —
to continue co-financing for EU structural funds, export
promotions, more efficient insolvency regimes, and
tighter bank supervision. In addition, there are several
quantitative performance criteria to be constantly
checked by the IMF (e.g. a floor on net international
reserves), as well as structural benchmarks with specific
deadlines (e.g. the development of a comprehensive debt
restructuring strategy by April 30, 2009).
The intended exit strategy is euro accession by 2012 made
possible by rapid elimination of inflationary pressures;
however, this will require strict budget policy under
extraordinarily difficult circumstances. In our opinion, IMF
forecast for 2009 is quite optimistic (regarding GDP and
inflation), which puts 5% budget deficit target at risk and
further expenditure cut is required.
Mārtiņš Kazāks
Ivonna Slapiņa
Dainis Stikuts
Lija Strašuna
Pēteris Strautiņš
* The full text of SBA: http://www.imf.org/external/pubs/cat/longres.cfm?sk=22586.0
Unemployment and Inflation
-40
-20
0
20
40
60
80
2004
2005
2006
2007
2008f
2009f
2010f
-10%
-5%
0%
5%
10%
15%
20%
Consumer price growth, y oy (r.s.)
Rate of job seekers (r.s.)
Inf lation expectations, end of y ear (l.s.)
Unemploy ment expectations, end of y ear (l.s.)
Source: CSBL, Eurostat; HBM calculations and forecast
2002 2003 2004 2005 2006 2007 2008f 2009f 2010f
Economic growth, % 6.5 7.2 8.7 10.6 12.2 10.3 -2.2 -10.0 -2.0
GDP, mln euros 9,911 9,978 11,176 13,012 16,047 19,936 21,837 18,199 17,247
GDP per capita, euro 4,251 4,302 4,846 5,671 7,034 8,779 9,646 8,081 7,699
Growth of GDP deflator, % 3.6 3.6 7.0 10.2 9.9 13.3 12.0 -7.4 -3.3
Growth of consumer prices, % 2.0 2.9 6.2 6.7 6.6 10.1 15.4* 0.0 -6.5
Growth of harmonized consumer price index, % 2.0 2.9 6.2 6.9 6.6 10.1 15.4* 0.0 -6.5
Growth of producer prices, % 1.0 3.1 8.6 7.8 10.3 16.1 11.5* na na
Harmonised unemployment level, % 12.2 10.5 10.4 8.9 6.8 6.0 7.0 13.5 16.0
Real growth of average net monthly wage, % 6.0 7.8 2.4 9.7 15.6 19.9 5.0 -15.0 -2.0
Growth of exports of goods and services, % 8.6 14.3 21.4 31.4 15.3 24.1 11.0 -14.0 0.0
Growth of imports of goods and services, % 9.0 19.5 27.0 27.4 31.3 23.5 -1.5 -25.0 -8.0
Balance of goods and services, % of GDP -10.0 -12.7 -15.8 -15.2 -22.2 -21.8 -14.6 -7.3 -3.2
Current account balance, % of GDP -6.6 -8.2 -12.8 -12.5 -22.5 -23.8 -15.0 -5.5 -2.7
Current and capital account balance, % of GDP -6.4 -7.5 -11.8 -11.2 -21.3 -21.8 -13.3 -3.3 0.1
Net FDI, % of GDP 2.7 2.3 3.8 3.6 7.5 7.1 6.0 2.0 2.0
Foreign gross debt, % of GDP 72.7 79.6 93.3 99.4 114.0 135.1 137.0 138.3 136.2
General government budget, % of GDP (ESA) -2.3 -1.6 -1.0 -0.4 -0.2 0.1 -3.5 -7.5 -6.0
General government debt, % of GDP 13.5 14.6 14.9 12.4 10.7 9.5 16.0 37.0 47.0
* fact
6 Lithuania
Lithuania
Economic downturn in Lithuania will be deeper and longer
than assumed before, given a substantially weakening
global environment, especially shrinking economies of
the main trading partners of Lithuania, and fast changing
downward processes in Lithuania itself. A decline in
all components of the domestic demand is anticipated
and positive effect of net exports will not be enough to
compensate for it. We expect the economy to contract
by ~6% this year (the previous expectation was in the
range of -1.5-0.5%) and by ~3% next year. Thus, Lithuania
is entering a protracted recession, which is forecast to
continue next year. Declining demand in local markets and
faltering external demand will halt companies’ investment
plans. Household consumption will be impaired by lower
incomes, unemployment fears and limited borrowing
possibilities.
We do not rule out a possibility, however, of an even
sharper drop in economic growth in the next 1-2 years,
considering the current business and consumer pessimism
and uncertainty in the global environment.
Confidence Indicators
-80
-60
-40
-20
0
20
40
2004 2005 2006 2007 2008
Ov erall sentiment Industry
Construction Retail trade
Serv ices Consumer
Source: LDS
Household consumption will be negatively influenced by a
rise in unemployment, negative growth of real wages and
an increase in pessimism. An increase in expenditures on
utilities and more expensive foodstuffs (especially meat)
will force households to reduce consumption on non-
essentials goods and services. We forecast household
consumption to decrease ~7% (strong downside
risks remain). The major factors that will discourage
consumption are the following:
Unemployment is expected to be ~9.5% in 2009●
and ~12% in 2010. This means ca 65 thousand new
unemployed this year and additional 40 thousand
next year. Layoffs, which started in the 4Q 2008,
will continue: almost half of local companies
are planning to lay off workers, with the largest
dismissals in industry and construction. The total cut
in employment will be ~4-5%.
We expect a ~3-4% decline of real net wage for●
2009-10. Despite a drop in wages in some companies,
the average gross wage is expected to remain
unchanged due to structural changes and layoffs
of low-wage workers. The modest positive effect on
nominal net wage growth this year will come from
the personal income tax rate cut to 21% from 24%,
starting in January, but this effect will be lessened
by the changes in the general non-taxed minimum
(LTL 320 before Jan. 1 2009). The decrease in gross
salaries in the public sector (but an increase in net
wages due a drop in personal income tax burden) will
push the average wage growth slightly downward.
Government consumption is expected to decrease by ca
5% this year. We forecast that the budget deficit will reach
~3% of GDP and thus fit under Maastricht criteria. The
new government introduced the anti-crisis plan, which,
among other measures, includes many tax changes,
which are intended to reduce the budget deficit. VAT rate
was increased from 18% to 19%, personal income tax was
cut and excise duties for fuel, alcoholic beverages and
cigarettes were raised even more than is required by the
EU at the end of the given transitional period. The majority
of income tax and VAT exemptions were repealed. The
majority of measures of the plan are meant to eliminate
distortions present in the previous tax system, broaden
the tax base and target needed protection for the most
vulnerable groups.
Although all expenditure items are expected to fall in
2009, investments are expected to decline the most
and thus contribute extensively to the fall in domestic
demand. We forecast investment in fixed assets to
contract by ~20% this year. The forecast is due to a sharp
downturn in the construction sector, which was the most
salient source of investment in the previous boom years,
and credit conditions, which, although eased to a certain
extent towards the end of 2008, will remain tight. New
funding from parent banks is expected to decline from
the elevated levels of recent years, and thus credit to
the private sector will decrease substantially. Weakening
demand both in Lithuania and its main trading partners
will shrink profit margins and further limit business
investment. We expect negative investment growth to
continue in 2010.
Economic Grow th and Inflation
4.2%
6.7% 6.9%
10.2%
7.4% 7.8% 7.8%
8.9%
3.2%
-6.0%
-3.0%
-8%
-6%
-4%
-2%
0%
2%
4%
6%
8%
10%
12%
2000 2002 2004 2006 2008 2010f
GDP Inf lation
Source: LDS, HBM forecast
7Lithuania
After having peaked in the 1st
half of the year, the current-
account deficit narrowed in the 2nd
half of last year owing
to weakening demand and weaker global conditions, which
slowed down import (and export) growth significantly.
A sharper economic slowdown is expected to alleviate
external imbalances even more this year: mainly due to
the narrowing of the trade balance, the current account
is forecast to reach ~ -5% of GDP in 2009. Even though
the Lithuanian export outlook is certainly not reassuring,
imports are expected to fall even more. Export prospects
have declined significantly as the slowdown has become
more severe than expected in Lithuania’s main trading
partners. The export boom to CIS countries (Russia,
Ukraine, Belarus) is likely to slow significantly due to a
weaker global economy and lower commodity prices. On
the positive side, the country’s competitiveness is going
to improve through wage and employment cuts, which
will improve productivity growth. Exports will decline by
less next year as the global economy recovers; however,
the correction in the external imbalances is not going to
continue due to a substantial increase in imports for fossil
fuels, as Ignalina NPP is to be closed at the end of the year.
The services account will remain in surplus, but demand for
transport services and tourism will weaken significantly.
Inflows of EU structural funds should maintain the surplus
on current transfers. Given the vulnerability of emerging
market economies to the current economic downturn, we
do not expect significant FDI and other investment flows.
Nevertheless, in order to raise funds, the Lithuanian
government has also announced its plans to sell the rest
(9.98%) of Mazeikiu nafta shares to Poland’s PKN Orlen
for approximately LTL 705 million (EUR 204.18 m.), which
will, at 0.6% of GDP, be an important source to finance
the CAD.
Weakening domestic and external demand resulted
in a decline of consumer price inflation from the 4th
quarter of 2008. We expect the process to continue and
anticipate that annual average inflation will moderate to
~5% this year. Sharper disinflation, however, is prevented
by significant administrative price increases. Rises in
energy prices alone - electricity by 12%, gas by 26%,
and the termination of the VAT exemption on heating
services in autumn could push inflation upwards by
~1-1.5% percentage points. An increase in excise duties on
alcohol, cigarettes and fuel (although the effect of fuel
excise tax increases could be mitigated by stabilization
in oil prices) will further push inflation upwards. An
increase in the standard VAT rate and termination of all
preferential VAT rates could raise average annual inflation
by ~3%, however, the effect is likely to be significantly
smaller as price increases are not going to be passed onto
consumers fully so as to prevent a critical fall in demand.
We do expect, however, monthly deflation in some months
of the second and third quarters. Next year, solely due to
cost-push pressures, inflation will remain high and only
mitigate to ~3%. Weak domestic demand will continue
to exert a downward pressure; however, energy price
increases together with the second-round effects will
push inflation upwards.
Lina Vrubliauskienė
Ieva Vyšniauskaitė
2003 2004 2005 2006 2007 2008f 2009f 2010f
Economic growth, % 10.2 7.4 7.8 7.8 8.9 3.2* -6.0 -3.0
GDP, mln euros 16,452 18,159 20,870 23,978 28,423 32,272* 31,095 30,765
GDP per capita, euros 4,776 5,285 6,113 7,065 8,420 9,606* 9,297 9,235
Growth of industrial sales, % 16.1 10.8 7.1 7.3 4.0 2.7* -2.0 -2.0
Growth of GDP deflator, % -0.8 2.5 6.6 6.5 8.8 10.0* 2.5 2.0
Growth of consumer prices, % -1.1 1.2 2.7 3.7 5.7 10.9* 5.0 3.0
Growth of harmonized consumer price index, % -1.1 1.2 2.7 3.8 5.8 11.1* 5.0 3.0
Growth of producer prices, % -0.5 6.0 11.5 7.4 7.0 18.2* -8.0 4.5
Harmonized unemployment level, % 12.4 11.4 8.3 5.6 4.3 5.6 9.5 12.0
Growth of real net wage, % 9.3 4.9 6.8 14.9 17.7 11.2 -4.0 -3.0
Growth of exports of goods and services, % 6.2 12.0 27.0 17.9 9.2 25.0 -4.0 -2.0
Growth of imports of goods and services, % 6.9 14.2 26.1 23.1 15.9 20.8 -12.7 -0.9
Balance of goods and services, % of GDP -5.7 -7.0 -7.2 -10.3 -13.4 -11.9 -5.7 -6.4
Current account, % of GDP -6.8 -7.7 -7.1 -10.6 -14.6 -12.8 -5.0 -5.5
Current and capital account, % of GDP -6.4 -6.4 -5.8 -9.5 -12.8 -11.0 -3.2 -2.5
FDI inflow, % of GDP 1.0 3.4 4.0 6.0 5.2 3.6 3.8 3.8
Foreign gross debt, % of GDP 40.5 42.4 50.7 60.2 72.3 73.8 76.7 76.0
General government budget position, % of GDP -1.3 -1.5 -0.5 -0.4 -1.2 -2.9* -3.0 -2.5
General government debt, % of GDP 21.1 19.4 18.4 18.0 17.0 17.2 19.5 20.0
* actual results
Labour Market, annual grow th rates
12.4%
11.4%
8.3%
5.6%
4.3%
5.3%
9.5%
12.0%
-8%
-4%
0%
4%
8%
12%
16%
20%
24%
2003 2004 2005 2006 2007 2008f 2009f 2010f
Unemploy ment rate Gross nominal wage
Net real wage
Source: LDS, HBM calculations
Disclaimer:
Hansabank Markets a brokerage division of AS Hansapank in Estonia, AS Hansabanka in Latvia and AB Bankas Hansabankas in Lithuania (hereinafter the above banks and any of their division or affiliate collectively
referred to as Hansabank Group) is responsible for preparation of research reports. The opinions contained within this report are the opinions of the persons responsible for preparation of this report and may differ
from those of Hansabank Group. Hansabank Group is regulated by the Financial Supervision Authorities in Estonia, Latvia and Lithuania.
Hansabank Group may make a market in, or may, as principal or agent, buy or sell securities or derivatives of the companies mentioned in this report. Hansabank Group or its officers and employees may serve or
have served as an officer, director or in an advisory capacity for any company mentioned in this report and from time to time, solicit, perform or have performed investment banking, underwriting or other services
(including acting as an adviser, manager, underwriter or lender) within last 12 months for any company referred to in this report. Hansabank Group may receive or intend to seek compensation from investment banking
services in the next three months from any issuer mentioned in this report. Hansabank Group may also perform or seek to perform banking services for those companies
Neither Hansabank Group nor any of their directors, officers or employees will accept responsibility for any direct or indirect losses arising from the use of this report without limitation any loss of profits even if
Hansabank Group has expressly advised of the possibility or likelihood of such loss. Hansabank Group or its directors, officers or employees may have financial interest in the companies mentioned in this report,
including a long or short positions in their securities, and/or options, futures or other derivative instruments based thereon.
Hansabank Group draws your attention to the fact that past performance does not necessarily indicate the future performance and the indications of future performance are based on assumptions, which may not
be realized. The value of and income from your investment may change due to the changes of interest rates, changes of foreign exchange rates, securities prices or market indexes or other factors that may change
the conditions of the securities market.
This report is not a tender to buy or sell, nor is it a solicitation to buy or sell any securities. This report has been prepared without regard to the individual financial circumstances and objectives of persons who receive
this report. Therefore, the report does not provide individual investment advice. The securities referred to in this report may not be suitable for all investors. Investors should independently and carefully evaluate
every particular investment and seek the advice of financial adviser, if needed. The distribution of this report may be restricted in certain jurisdictions and persons into whose possession this report comes should
inform themselves about and act pursuant to such restrictions.
This report is based upon information available to the public. The information contained within this report has been compiled from sources deemed to be both expert and reliable, however no statement is made
which guarantees the accuracy, completeness, nor the timeless of this information and this information should not be relied upon as such. Any opinions expressed herein reflect a professional judgement at the date
of publication and are subject to change. Any company mentioned in this report may have an position in Hansabank Group. Also, any company mentioned in this report may have been provided with section of this
report prior to its publication in order to verify its factual accuracy and the report may have been amended after that, if necessary. Hansabank Group may to the extent permitted by law, have acted upon or used the
information contained herein, or the research or analysis on which it was based, before its publication.
In preparation of this report different valuation methods have been used including but not limited to discounted free cash-flow and comparative analysis. The selection of methods depends on different circumstances.
This report is amended periodically, once a month/quarter or more often if required.
The research analysts responsible for the preparation of this report receive compensation, based upon various factors, including quality and accuracy of the research, client feedback, competitive factors and overall
Hansabank Group revenues. Hansabank Group’s overall revenues include revenues from its investment banking and fixed income business units. The analysts do not own securities mentioned in this report.
Maris Lauri
+372 888 1202
maris.lauri@swedbank.ee
Mārtiņš Kazāks
+371 67 445 859
martins.kazaks@swedbank.lv
Lina Vrubliauskienė
+370 5 268 4275
lina.vrubliauskiene@swedbank.lt
Hansabank Markets
Tel.+372 6 131 670 , Fax. +372 6 132 099
Liivalaia 8, 15040, Tallinn, Estonia

Contenu connexe

Tendances

Macroeconomic Developments Report, December 2017
Macroeconomic Developments Report, December 2017Macroeconomic Developments Report, December 2017
Macroeconomic Developments Report, December 2017Latvijas Banka
 
Swedbank Economic Outlook 29 September 2009
Swedbank Economic Outlook 29 September 2009Swedbank Economic Outlook 29 September 2009
Swedbank Economic Outlook 29 September 2009Swedbank
 
Macroeconomic Developments Report. July 2013
Macroeconomic Developments Report. July 2013Macroeconomic Developments Report. July 2013
Macroeconomic Developments Report. July 2013Latvijas Banka
 
Latvijas Banka Monthly Newsletter 12/2017
Latvijas Banka Monthly Newsletter 12/2017Latvijas Banka Monthly Newsletter 12/2017
Latvijas Banka Monthly Newsletter 12/2017Latvijas Banka
 
Macroeconomic Developments Report, June 2017
Macroeconomic Developments Report, June 2017Macroeconomic Developments Report, June 2017
Macroeconomic Developments Report, June 2017Latvijas Banka
 
Latvijas Banka Monthly Newsletter 09/2017
Latvijas Banka Monthly Newsletter 09/2017Latvijas Banka Monthly Newsletter 09/2017
Latvijas Banka Monthly Newsletter 09/2017Latvijas Banka
 
Russia - sharp slowdown and protacted recovery
Russia - sharp slowdown and protacted recoveryRussia - sharp slowdown and protacted recovery
Russia - sharp slowdown and protacted recoverySwedbank
 
Monthly Newsletter 03/2016
Monthly Newsletter 03/2016Monthly Newsletter 03/2016
Monthly Newsletter 03/2016Latvijas Banka
 
Latvijas Banka Monthly Newsletter 07/2017
Latvijas Banka Monthly Newsletter 07/2017Latvijas Banka Monthly Newsletter 07/2017
Latvijas Banka Monthly Newsletter 07/2017Latvijas Banka
 
The Baltic Outlook April 2009
The Baltic Outlook April 2009The Baltic Outlook April 2009
The Baltic Outlook April 2009Swedbank
 
Monthly Newsletter 04/2016
Monthly Newsletter 04/2016Monthly Newsletter 04/2016
Monthly Newsletter 04/2016Latvijas Banka
 
Swedbank Baltic Sea Analysis No. 25
Swedbank Baltic Sea Analysis No. 25Swedbank Baltic Sea Analysis No. 25
Swedbank Baltic Sea Analysis No. 25Swedbank
 
Macroeconomic Developments Report. December 2015
Macroeconomic Developments Report. December 2015Macroeconomic Developments Report. December 2015
Macroeconomic Developments Report. December 2015Latvijas Banka
 
Monthly Newsletter 01/2016
Monthly Newsletter 01/2016Monthly Newsletter 01/2016
Monthly Newsletter 01/2016Latvijas Banka
 
Swedbank Economic Outlook - 2010, September 21
Swedbank Economic Outlook - 2010, September 21Swedbank Economic Outlook - 2010, September 21
Swedbank Economic Outlook - 2010, September 21Swedbank
 
Economic forecast-summary-russia-oecd-economic-outlook-november-2016
Economic forecast-summary-russia-oecd-economic-outlook-november-2016Economic forecast-summary-russia-oecd-economic-outlook-november-2016
Economic forecast-summary-russia-oecd-economic-outlook-november-2016Bankir_Ru
 
Macroeconomic Developments Report. December 2014
Macroeconomic Developments Report. December 2014Macroeconomic Developments Report. December 2014
Macroeconomic Developments Report. December 2014Latvijas Banka
 
"Macroeconomic Developments Report", October 2013
"Macroeconomic Developments Report", October 2013"Macroeconomic Developments Report", October 2013
"Macroeconomic Developments Report", October 2013Latvijas Banka
 

Tendances (20)

Macroeconomic Developments Report, December 2017
Macroeconomic Developments Report, December 2017Macroeconomic Developments Report, December 2017
Macroeconomic Developments Report, December 2017
 
Swedbank Economic Outlook 29 September 2009
Swedbank Economic Outlook 29 September 2009Swedbank Economic Outlook 29 September 2009
Swedbank Economic Outlook 29 September 2009
 
Macroeconomic Developments Report. July 2013
Macroeconomic Developments Report. July 2013Macroeconomic Developments Report. July 2013
Macroeconomic Developments Report. July 2013
 
Latvijas Banka Monthly Newsletter 12/2017
Latvijas Banka Monthly Newsletter 12/2017Latvijas Banka Monthly Newsletter 12/2017
Latvijas Banka Monthly Newsletter 12/2017
 
Macroeconomic Developments Report, June 2017
Macroeconomic Developments Report, June 2017Macroeconomic Developments Report, June 2017
Macroeconomic Developments Report, June 2017
 
Latvijas Banka Monthly Newsletter 09/2017
Latvijas Banka Monthly Newsletter 09/2017Latvijas Banka Monthly Newsletter 09/2017
Latvijas Banka Monthly Newsletter 09/2017
 
Russia - sharp slowdown and protacted recovery
Russia - sharp slowdown and protacted recoveryRussia - sharp slowdown and protacted recovery
Russia - sharp slowdown and protacted recovery
 
Monthly Newsletter 03/2016
Monthly Newsletter 03/2016Monthly Newsletter 03/2016
Monthly Newsletter 03/2016
 
Latvijas Banka Monthly Newsletter 07/2017
Latvijas Banka Monthly Newsletter 07/2017Latvijas Banka Monthly Newsletter 07/2017
Latvijas Banka Monthly Newsletter 07/2017
 
The Baltic Outlook April 2009
The Baltic Outlook April 2009The Baltic Outlook April 2009
The Baltic Outlook April 2009
 
Monthly Newsletter 04/2016
Monthly Newsletter 04/2016Monthly Newsletter 04/2016
Monthly Newsletter 04/2016
 
Swedbank Baltic Sea Analysis No. 25
Swedbank Baltic Sea Analysis No. 25Swedbank Baltic Sea Analysis No. 25
Swedbank Baltic Sea Analysis No. 25
 
Macroeconomic Developments Report. December 2015
Macroeconomic Developments Report. December 2015Macroeconomic Developments Report. December 2015
Macroeconomic Developments Report. December 2015
 
Monthly Newsletter 01/2016
Monthly Newsletter 01/2016Monthly Newsletter 01/2016
Monthly Newsletter 01/2016
 
Polish economic outlook 1/2010 (44)
Polish economic outlook 1/2010 (44)Polish economic outlook 1/2010 (44)
Polish economic outlook 1/2010 (44)
 
Swedbank Economic Outlook - 2010, September 21
Swedbank Economic Outlook - 2010, September 21Swedbank Economic Outlook - 2010, September 21
Swedbank Economic Outlook - 2010, September 21
 
Economic forecast-summary-russia-oecd-economic-outlook-november-2016
Economic forecast-summary-russia-oecd-economic-outlook-november-2016Economic forecast-summary-russia-oecd-economic-outlook-november-2016
Economic forecast-summary-russia-oecd-economic-outlook-november-2016
 
Macroeconomic Developments Report. December 2014
Macroeconomic Developments Report. December 2014Macroeconomic Developments Report. December 2014
Macroeconomic Developments Report. December 2014
 
A Russian Sudden Stop or Just a Slippery Oil Slope to Stagnation?
A Russian Sudden Stop or Just a Slippery Oil Slope to Stagnation?A Russian Sudden Stop or Just a Slippery Oil Slope to Stagnation?
A Russian Sudden Stop or Just a Slippery Oil Slope to Stagnation?
 
"Macroeconomic Developments Report", October 2013
"Macroeconomic Developments Report", October 2013"Macroeconomic Developments Report", October 2013
"Macroeconomic Developments Report", October 2013
 

En vedette

Q1 2008 Transcript Conference Call
Q1 2008 Transcript Conference CallQ1 2008 Transcript Conference Call
Q1 2008 Transcript Conference CallSwedbank
 
Roadshow, Lehman Brothers Global Financial Services Conference
Roadshow, Lehman Brothers Global Financial Services ConferenceRoadshow, Lehman Brothers Global Financial Services Conference
Roadshow, Lehman Brothers Global Financial Services ConferenceSwedbank
 
Roadshow, Tokyo, Mikael Inglander and Anders Ek
Roadshow, Tokyo, Mikael Inglander and Anders EkRoadshow, Tokyo, Mikael Inglander and Anders Ek
Roadshow, Tokyo, Mikael Inglander and Anders EkSwedbank
 
Roadshow, UBS Nordic Banking Conference Jan Lidén
	Roadshow, UBS Nordic Banking Conference Jan Lidén	Roadshow, UBS Nordic Banking Conference Jan Lidén
Roadshow, UBS Nordic Banking Conference Jan LidénSwedbank
 
Handelsbanken - Nordic Large Cap seminar 2010
Handelsbanken - Nordic Large Cap seminar 2010Handelsbanken - Nordic Large Cap seminar 2010
Handelsbanken - Nordic Large Cap seminar 2010Swedbank
 
Swedbank företagspresentation, 25 oktober 2016
Swedbank företagspresentation, 25 oktober 2016Swedbank företagspresentation, 25 oktober 2016
Swedbank företagspresentation, 25 oktober 2016Swedbank
 
Swedbank Corporate Presentation, October 25 2016
Swedbank Corporate Presentation, October 25 2016Swedbank Corporate Presentation, October 25 2016
Swedbank Corporate Presentation, October 25 2016Swedbank
 

En vedette (7)

Q1 2008 Transcript Conference Call
Q1 2008 Transcript Conference CallQ1 2008 Transcript Conference Call
Q1 2008 Transcript Conference Call
 
Roadshow, Lehman Brothers Global Financial Services Conference
Roadshow, Lehman Brothers Global Financial Services ConferenceRoadshow, Lehman Brothers Global Financial Services Conference
Roadshow, Lehman Brothers Global Financial Services Conference
 
Roadshow, Tokyo, Mikael Inglander and Anders Ek
Roadshow, Tokyo, Mikael Inglander and Anders EkRoadshow, Tokyo, Mikael Inglander and Anders Ek
Roadshow, Tokyo, Mikael Inglander and Anders Ek
 
Roadshow, UBS Nordic Banking Conference Jan Lidén
	Roadshow, UBS Nordic Banking Conference Jan Lidén	Roadshow, UBS Nordic Banking Conference Jan Lidén
Roadshow, UBS Nordic Banking Conference Jan Lidén
 
Handelsbanken - Nordic Large Cap seminar 2010
Handelsbanken - Nordic Large Cap seminar 2010Handelsbanken - Nordic Large Cap seminar 2010
Handelsbanken - Nordic Large Cap seminar 2010
 
Swedbank företagspresentation, 25 oktober 2016
Swedbank företagspresentation, 25 oktober 2016Swedbank företagspresentation, 25 oktober 2016
Swedbank företagspresentation, 25 oktober 2016
 
Swedbank Corporate Presentation, October 25 2016
Swedbank Corporate Presentation, October 25 2016Swedbank Corporate Presentation, October 25 2016
Swedbank Corporate Presentation, October 25 2016
 

Similaire à Baltic Outlook January 2009

The Latvian Economy, 2010, May
The Latvian Economy, 2010, MayThe Latvian Economy, 2010, May
The Latvian Economy, 2010, MaySwedbank
 
The Latvian Economy - 2010, June
The Latvian Economy - 2010, JuneThe Latvian Economy - 2010, June
The Latvian Economy - 2010, JuneSwedbank
 
The Lithuanian Economy - 2010 September
The Lithuanian Economy - 2010 SeptemberThe Lithuanian Economy - 2010 September
The Lithuanian Economy - 2010 SeptemberSwedbank
 
The Estonian Economy – 2010 November 3
The Estonian Economy – 2010 November 3 The Estonian Economy – 2010 November 3
The Estonian Economy – 2010 November 3 Swedbank
 
Swedbank Analysis: The fiscal stance in Latvia
Swedbank Analysis: The fiscal stance in LatviaSwedbank Analysis: The fiscal stance in Latvia
Swedbank Analysis: The fiscal stance in LatviaSwedbank
 
Weakening boom reduces unemployment at an unanticipated rate – employment gro...
Weakening boom reduces unemployment at an unanticipated rate – employment gro...Weakening boom reduces unemployment at an unanticipated rate – employment gro...
Weakening boom reduces unemployment at an unanticipated rate – employment gro...Palkansaajien tutkimuslaitos
 
Economic and Structural Report August 2008, extract from
Economic and Structural Report August 2008, extract fromEconomic and Structural Report August 2008, extract from
Economic and Structural Report August 2008, extract fromSwedbank
 
2006. Laszlo Akar. Medium-term Economic Trends and Perspectives for Hungary. ...
2006. Laszlo Akar. Medium-term Economic Trends and Perspectives for Hungary. ...2006. Laszlo Akar. Medium-term Economic Trends and Perspectives for Hungary. ...
2006. Laszlo Akar. Medium-term Economic Trends and Perspectives for Hungary. ...Forum Velden
 
The Lithuanian Economy - 2010, July
The Lithuanian Economy - 2010, JulyThe Lithuanian Economy - 2010, July
The Lithuanian Economy - 2010, JulySwedbank
 
Latvia`s Macro Profile 2023
Latvia`s Macro Profile 2023Latvia`s Macro Profile 2023
Latvia`s Macro Profile 2023Latvijas Banka
 
Monthly Newsletter 5/2013
Monthly Newsletter 5/2013Monthly Newsletter 5/2013
Monthly Newsletter 5/2013Latvijas Banka
 
Prévisions économiques du printemps 2019 pour le Luxembourg
Prévisions économiques du printemps 2019 pour le LuxembourgPrévisions économiques du printemps 2019 pour le Luxembourg
Prévisions économiques du printemps 2019 pour le LuxembourgPaperjam_redaction
 
Insolvency forecasts feb 2016
Insolvency forecasts   feb 2016Insolvency forecasts   feb 2016
Insolvency forecasts feb 2016Ignacio Jimenez
 
Latvijas Banka Monthly Newsletter 02/2018
Latvijas Banka Monthly Newsletter 02/2018Latvijas Banka Monthly Newsletter 02/2018
Latvijas Banka Monthly Newsletter 02/2018Latvijas Banka
 
Strong Growth Continues – Finland Wasn’t a Hopeless Case, After All
Strong Growth Continues – Finland Wasn’t a Hopeless Case, After AllStrong Growth Continues – Finland Wasn’t a Hopeless Case, After All
Strong Growth Continues – Finland Wasn’t a Hopeless Case, After AllPalkansaajien tutkimuslaitos
 
Quantic asset management monthly review April 2019
Quantic asset management monthly review April 2019Quantic asset management monthly review April 2019
Quantic asset management monthly review April 2019Quantic Asset Management
 
Economic growth is slowing downGlobalization contributes many.docx
Economic growth is slowing downGlobalization contributes many.docxEconomic growth is slowing downGlobalization contributes many.docx
Economic growth is slowing downGlobalization contributes many.docxtidwellveronique
 
Flash Report - Government Deficit - 6 April 2018
Flash Report - Government Deficit - 6 April 2018Flash Report - Government Deficit - 6 April 2018
Flash Report - Government Deficit - 6 April 2018OTP Bank Ltd.
 
Monthly Newsletter 9/2015
Monthly Newsletter 9/2015Monthly Newsletter 9/2015
Monthly Newsletter 9/2015Latvijas Banka
 

Similaire à Baltic Outlook January 2009 (20)

The Latvian Economy, 2010, May
The Latvian Economy, 2010, MayThe Latvian Economy, 2010, May
The Latvian Economy, 2010, May
 
The Latvian Economy - 2010, June
The Latvian Economy - 2010, JuneThe Latvian Economy - 2010, June
The Latvian Economy - 2010, June
 
The Lithuanian Economy - 2010 September
The Lithuanian Economy - 2010 SeptemberThe Lithuanian Economy - 2010 September
The Lithuanian Economy - 2010 September
 
The Estonian Economy – 2010 November 3
The Estonian Economy – 2010 November 3 The Estonian Economy – 2010 November 3
The Estonian Economy – 2010 November 3
 
Swedbank Analysis: The fiscal stance in Latvia
Swedbank Analysis: The fiscal stance in LatviaSwedbank Analysis: The fiscal stance in Latvia
Swedbank Analysis: The fiscal stance in Latvia
 
Weakening boom reduces unemployment at an unanticipated rate – employment gro...
Weakening boom reduces unemployment at an unanticipated rate – employment gro...Weakening boom reduces unemployment at an unanticipated rate – employment gro...
Weakening boom reduces unemployment at an unanticipated rate – employment gro...
 
Economic and Structural Report August 2008, extract from
Economic and Structural Report August 2008, extract fromEconomic and Structural Report August 2008, extract from
Economic and Structural Report August 2008, extract from
 
2006. Laszlo Akar. Medium-term Economic Trends and Perspectives for Hungary. ...
2006. Laszlo Akar. Medium-term Economic Trends and Perspectives for Hungary. ...2006. Laszlo Akar. Medium-term Economic Trends and Perspectives for Hungary. ...
2006. Laszlo Akar. Medium-term Economic Trends and Perspectives for Hungary. ...
 
The Lithuanian Economy - 2010, July
The Lithuanian Economy - 2010, JulyThe Lithuanian Economy - 2010, July
The Lithuanian Economy - 2010, July
 
Latvia`s Macro Profile 2023
Latvia`s Macro Profile 2023Latvia`s Macro Profile 2023
Latvia`s Macro Profile 2023
 
Monthly Newsletter 5/2013
Monthly Newsletter 5/2013Monthly Newsletter 5/2013
Monthly Newsletter 5/2013
 
Prévisions économiques du printemps 2019 pour le Luxembourg
Prévisions économiques du printemps 2019 pour le LuxembourgPrévisions économiques du printemps 2019 pour le Luxembourg
Prévisions économiques du printemps 2019 pour le Luxembourg
 
Insolvency forecasts feb 2016
Insolvency forecasts   feb 2016Insolvency forecasts   feb 2016
Insolvency forecasts feb 2016
 
Latvijas Banka Monthly Newsletter 02/2018
Latvijas Banka Monthly Newsletter 02/2018Latvijas Banka Monthly Newsletter 02/2018
Latvijas Banka Monthly Newsletter 02/2018
 
Strong Growth Continues – Finland Wasn’t a Hopeless Case, After All
Strong Growth Continues – Finland Wasn’t a Hopeless Case, After AllStrong Growth Continues – Finland Wasn’t a Hopeless Case, After All
Strong Growth Continues – Finland Wasn’t a Hopeless Case, After All
 
Quantic asset management monthly review April 2019
Quantic asset management monthly review April 2019Quantic asset management monthly review April 2019
Quantic asset management monthly review April 2019
 
Polish Economic Outlook 01/2010
Polish Economic Outlook 01/2010Polish Economic Outlook 01/2010
Polish Economic Outlook 01/2010
 
Economic growth is slowing downGlobalization contributes many.docx
Economic growth is slowing downGlobalization contributes many.docxEconomic growth is slowing downGlobalization contributes many.docx
Economic growth is slowing downGlobalization contributes many.docx
 
Flash Report - Government Deficit - 6 April 2018
Flash Report - Government Deficit - 6 April 2018Flash Report - Government Deficit - 6 April 2018
Flash Report - Government Deficit - 6 April 2018
 
Monthly Newsletter 9/2015
Monthly Newsletter 9/2015Monthly Newsletter 9/2015
Monthly Newsletter 9/2015
 

Plus de Swedbank

Swedbank corporate presentation April 25 2017
Swedbank corporate presentation April 25 2017Swedbank corporate presentation April 25 2017
Swedbank corporate presentation April 25 2017Swedbank
 
Swedbank foretagspresentation 25 april 2017
Swedbank foretagspresentation 25 april 2017Swedbank foretagspresentation 25 april 2017
Swedbank foretagspresentation 25 april 2017Swedbank
 
Delårsrapport kv1 2017
Delårsrapport kv1 2017Delårsrapport kv1 2017
Delårsrapport kv1 2017Swedbank
 
Interim report q1 2017
Interim report q1 2017Interim report q1 2017
Interim report q1 2017Swedbank
 
Year end report 2016
Year end report 2016Year end report 2016
Year end report 2016Swedbank
 
Bokslutskommuniké 2016
Bokslutskommuniké 2016Bokslutskommuniké 2016
Bokslutskommuniké 2016Swedbank
 
Swedbank företagspresentation, 2 februari 2017
Swedbank företagspresentation, 2 februari 2017Swedbank företagspresentation, 2 februari 2017
Swedbank företagspresentation, 2 februari 2017Swedbank
 
Swedbank corporate presentation, February 2 2017
Swedbank corporate presentation, February 2 2017Swedbank corporate presentation, February 2 2017
Swedbank corporate presentation, February 2 2017Swedbank
 
Swedbank Corporate Presentation, June 30 2016
Swedbank Corporate Presentation, June 30 2016Swedbank Corporate Presentation, June 30 2016
Swedbank Corporate Presentation, June 30 2016Swedbank
 
Swedbank företagspresentation, 30 juni 2016
Swedbank företagspresentation, 30 juni 2016Swedbank företagspresentation, 30 juni 2016
Swedbank företagspresentation, 30 juni 2016Swedbank
 
Swedbank corporate presentation Q1, 2016
Swedbank corporate presentation Q1, 2016Swedbank corporate presentation Q1, 2016
Swedbank corporate presentation Q1, 2016Swedbank
 
Swedbank företagspresentation kvartal 1, 2016.
Swedbank företagspresentation kvartal 1, 2016.Swedbank företagspresentation kvartal 1, 2016.
Swedbank företagspresentation kvartal 1, 2016.Swedbank
 
Swedbank corporate presentation Q4, 2015
Swedbank corporate presentation Q4, 2015Swedbank corporate presentation Q4, 2015
Swedbank corporate presentation Q4, 2015Swedbank
 
Swedbank företagspresentation kvartal 4,2015
Swedbank företagspresentation kvartal 4,2015Swedbank företagspresentation kvartal 4,2015
Swedbank företagspresentation kvartal 4,2015Swedbank
 
Year end report 2015
Year end report 2015Year end report 2015
Year end report 2015Swedbank
 
Bokslutskommuniké 2015
Bokslutskommuniké 2015Bokslutskommuniké 2015
Bokslutskommuniké 2015Swedbank
 
Swedbank Företagspresentation, September 2015
Swedbank Företagspresentation, September 2015Swedbank Företagspresentation, September 2015
Swedbank Företagspresentation, September 2015Swedbank
 
Swedbank Corporate Presentation, September 2015
Swedbank Corporate Presentation, September 2015Swedbank Corporate Presentation, September 2015
Swedbank Corporate Presentation, September 2015Swedbank
 
Swedbank's third quarter 2015 results
Swedbank's third quarter 2015 resultsSwedbank's third quarter 2015 results
Swedbank's third quarter 2015 resultsSwedbank
 
Swedbank Interim report third quarter 2015
Swedbank Interim report third quarter 2015Swedbank Interim report third quarter 2015
Swedbank Interim report third quarter 2015Swedbank
 

Plus de Swedbank (20)

Swedbank corporate presentation April 25 2017
Swedbank corporate presentation April 25 2017Swedbank corporate presentation April 25 2017
Swedbank corporate presentation April 25 2017
 
Swedbank foretagspresentation 25 april 2017
Swedbank foretagspresentation 25 april 2017Swedbank foretagspresentation 25 april 2017
Swedbank foretagspresentation 25 april 2017
 
Delårsrapport kv1 2017
Delårsrapport kv1 2017Delårsrapport kv1 2017
Delårsrapport kv1 2017
 
Interim report q1 2017
Interim report q1 2017Interim report q1 2017
Interim report q1 2017
 
Year end report 2016
Year end report 2016Year end report 2016
Year end report 2016
 
Bokslutskommuniké 2016
Bokslutskommuniké 2016Bokslutskommuniké 2016
Bokslutskommuniké 2016
 
Swedbank företagspresentation, 2 februari 2017
Swedbank företagspresentation, 2 februari 2017Swedbank företagspresentation, 2 februari 2017
Swedbank företagspresentation, 2 februari 2017
 
Swedbank corporate presentation, February 2 2017
Swedbank corporate presentation, February 2 2017Swedbank corporate presentation, February 2 2017
Swedbank corporate presentation, February 2 2017
 
Swedbank Corporate Presentation, June 30 2016
Swedbank Corporate Presentation, June 30 2016Swedbank Corporate Presentation, June 30 2016
Swedbank Corporate Presentation, June 30 2016
 
Swedbank företagspresentation, 30 juni 2016
Swedbank företagspresentation, 30 juni 2016Swedbank företagspresentation, 30 juni 2016
Swedbank företagspresentation, 30 juni 2016
 
Swedbank corporate presentation Q1, 2016
Swedbank corporate presentation Q1, 2016Swedbank corporate presentation Q1, 2016
Swedbank corporate presentation Q1, 2016
 
Swedbank företagspresentation kvartal 1, 2016.
Swedbank företagspresentation kvartal 1, 2016.Swedbank företagspresentation kvartal 1, 2016.
Swedbank företagspresentation kvartal 1, 2016.
 
Swedbank corporate presentation Q4, 2015
Swedbank corporate presentation Q4, 2015Swedbank corporate presentation Q4, 2015
Swedbank corporate presentation Q4, 2015
 
Swedbank företagspresentation kvartal 4,2015
Swedbank företagspresentation kvartal 4,2015Swedbank företagspresentation kvartal 4,2015
Swedbank företagspresentation kvartal 4,2015
 
Year end report 2015
Year end report 2015Year end report 2015
Year end report 2015
 
Bokslutskommuniké 2015
Bokslutskommuniké 2015Bokslutskommuniké 2015
Bokslutskommuniké 2015
 
Swedbank Företagspresentation, September 2015
Swedbank Företagspresentation, September 2015Swedbank Företagspresentation, September 2015
Swedbank Företagspresentation, September 2015
 
Swedbank Corporate Presentation, September 2015
Swedbank Corporate Presentation, September 2015Swedbank Corporate Presentation, September 2015
Swedbank Corporate Presentation, September 2015
 
Swedbank's third quarter 2015 results
Swedbank's third quarter 2015 resultsSwedbank's third quarter 2015 results
Swedbank's third quarter 2015 results
 
Swedbank Interim report third quarter 2015
Swedbank Interim report third quarter 2015Swedbank Interim report third quarter 2015
Swedbank Interim report third quarter 2015
 

Dernier

VIP Independent Call Girls in Mumbai 🌹 9920725232 ( Call Me ) Mumbai Escorts ...
VIP Independent Call Girls in Mumbai 🌹 9920725232 ( Call Me ) Mumbai Escorts ...VIP Independent Call Girls in Mumbai 🌹 9920725232 ( Call Me ) Mumbai Escorts ...
VIP Independent Call Girls in Mumbai 🌹 9920725232 ( Call Me ) Mumbai Escorts ...dipikadinghjn ( Why You Choose Us? ) Escorts
 
Solution Manual for Principles of Corporate Finance 14th Edition by Richard B...
Solution Manual for Principles of Corporate Finance 14th Edition by Richard B...Solution Manual for Principles of Corporate Finance 14th Edition by Richard B...
Solution Manual for Principles of Corporate Finance 14th Edition by Richard B...ssifa0344
 
Top Rated Pune Call Girls Viman Nagar ⟟ 6297143586 ⟟ Call Me For Genuine Sex...
Top Rated  Pune Call Girls Viman Nagar ⟟ 6297143586 ⟟ Call Me For Genuine Sex...Top Rated  Pune Call Girls Viman Nagar ⟟ 6297143586 ⟟ Call Me For Genuine Sex...
Top Rated Pune Call Girls Viman Nagar ⟟ 6297143586 ⟟ Call Me For Genuine Sex...Call Girls in Nagpur High Profile
 
Booking open Available Pune Call Girls Talegaon Dabhade 6297143586 Call Hot ...
Booking open Available Pune Call Girls Talegaon Dabhade  6297143586 Call Hot ...Booking open Available Pune Call Girls Talegaon Dabhade  6297143586 Call Hot ...
Booking open Available Pune Call Girls Talegaon Dabhade 6297143586 Call Hot ...Call Girls in Nagpur High Profile
 
The Economic History of the U.S. Lecture 23.pdf
The Economic History of the U.S. Lecture 23.pdfThe Economic History of the U.S. Lecture 23.pdf
The Economic History of the U.S. Lecture 23.pdfGale Pooley
 
VIP Independent Call Girls in Mira Bhayandar 🌹 9920725232 ( Call Me ) Mumbai ...
VIP Independent Call Girls in Mira Bhayandar 🌹 9920725232 ( Call Me ) Mumbai ...VIP Independent Call Girls in Mira Bhayandar 🌹 9920725232 ( Call Me ) Mumbai ...
VIP Independent Call Girls in Mira Bhayandar 🌹 9920725232 ( Call Me ) Mumbai ...dipikadinghjn ( Why You Choose Us? ) Escorts
 
TEST BANK For Corporate Finance, 13th Edition By Stephen Ross, Randolph Weste...
TEST BANK For Corporate Finance, 13th Edition By Stephen Ross, Randolph Weste...TEST BANK For Corporate Finance, 13th Edition By Stephen Ross, Randolph Weste...
TEST BANK For Corporate Finance, 13th Edition By Stephen Ross, Randolph Weste...ssifa0344
 
The Economic History of the U.S. Lecture 17.pdf
The Economic History of the U.S. Lecture 17.pdfThe Economic History of the U.S. Lecture 17.pdf
The Economic History of the U.S. Lecture 17.pdfGale Pooley
 
The Economic History of the U.S. Lecture 26.pdf
The Economic History of the U.S. Lecture 26.pdfThe Economic History of the U.S. Lecture 26.pdf
The Economic History of the U.S. Lecture 26.pdfGale Pooley
 
Kharghar Blowjob Housewife Call Girls NUmber-9833754194-CBD Belapur Internati...
Kharghar Blowjob Housewife Call Girls NUmber-9833754194-CBD Belapur Internati...Kharghar Blowjob Housewife Call Girls NUmber-9833754194-CBD Belapur Internati...
Kharghar Blowjob Housewife Call Girls NUmber-9833754194-CBD Belapur Internati...priyasharma62062
 
06_Joeri Van Speybroek_Dell_MeetupDora&Cybersecurity.pdf
06_Joeri Van Speybroek_Dell_MeetupDora&Cybersecurity.pdf06_Joeri Van Speybroek_Dell_MeetupDora&Cybersecurity.pdf
06_Joeri Van Speybroek_Dell_MeetupDora&Cybersecurity.pdfFinTech Belgium
 
Booking open Available Pune Call Girls Shivane 6297143586 Call Hot Indian Gi...
Booking open Available Pune Call Girls Shivane  6297143586 Call Hot Indian Gi...Booking open Available Pune Call Girls Shivane  6297143586 Call Hot Indian Gi...
Booking open Available Pune Call Girls Shivane 6297143586 Call Hot Indian Gi...Call Girls in Nagpur High Profile
 
The Economic History of the U.S. Lecture 18.pdf
The Economic History of the U.S. Lecture 18.pdfThe Economic History of the U.S. Lecture 18.pdf
The Economic History of the U.S. Lecture 18.pdfGale Pooley
 
VIP Call Girl Service Andheri West ⚡ 9920725232 What It Takes To Be The Best ...
VIP Call Girl Service Andheri West ⚡ 9920725232 What It Takes To Be The Best ...VIP Call Girl Service Andheri West ⚡ 9920725232 What It Takes To Be The Best ...
VIP Call Girl Service Andheri West ⚡ 9920725232 What It Takes To Be The Best ...dipikadinghjn ( Why You Choose Us? ) Escorts
 
03_Emmanuel Ndiaye_Degroof Petercam.pptx
03_Emmanuel Ndiaye_Degroof Petercam.pptx03_Emmanuel Ndiaye_Degroof Petercam.pptx
03_Emmanuel Ndiaye_Degroof Petercam.pptxFinTech Belgium
 
Call Girls Koregaon Park Call Me 7737669865 Budget Friendly No Advance Booking
Call Girls Koregaon Park Call Me 7737669865 Budget Friendly No Advance BookingCall Girls Koregaon Park Call Me 7737669865 Budget Friendly No Advance Booking
Call Girls Koregaon Park Call Me 7737669865 Budget Friendly No Advance Bookingroncy bisnoi
 
Gurley shaw Theory of Monetary Economics.
Gurley shaw Theory of Monetary Economics.Gurley shaw Theory of Monetary Economics.
Gurley shaw Theory of Monetary Economics.Vinodha Devi
 

Dernier (20)

VIP Independent Call Girls in Mumbai 🌹 9920725232 ( Call Me ) Mumbai Escorts ...
VIP Independent Call Girls in Mumbai 🌹 9920725232 ( Call Me ) Mumbai Escorts ...VIP Independent Call Girls in Mumbai 🌹 9920725232 ( Call Me ) Mumbai Escorts ...
VIP Independent Call Girls in Mumbai 🌹 9920725232 ( Call Me ) Mumbai Escorts ...
 
Solution Manual for Principles of Corporate Finance 14th Edition by Richard B...
Solution Manual for Principles of Corporate Finance 14th Edition by Richard B...Solution Manual for Principles of Corporate Finance 14th Edition by Richard B...
Solution Manual for Principles of Corporate Finance 14th Edition by Richard B...
 
From Luxury Escort Service Kamathipura : 9352852248 Make on-demand Arrangemen...
From Luxury Escort Service Kamathipura : 9352852248 Make on-demand Arrangemen...From Luxury Escort Service Kamathipura : 9352852248 Make on-demand Arrangemen...
From Luxury Escort Service Kamathipura : 9352852248 Make on-demand Arrangemen...
 
Top Rated Pune Call Girls Viman Nagar ⟟ 6297143586 ⟟ Call Me For Genuine Sex...
Top Rated  Pune Call Girls Viman Nagar ⟟ 6297143586 ⟟ Call Me For Genuine Sex...Top Rated  Pune Call Girls Viman Nagar ⟟ 6297143586 ⟟ Call Me For Genuine Sex...
Top Rated Pune Call Girls Viman Nagar ⟟ 6297143586 ⟟ Call Me For Genuine Sex...
 
Booking open Available Pune Call Girls Talegaon Dabhade 6297143586 Call Hot ...
Booking open Available Pune Call Girls Talegaon Dabhade  6297143586 Call Hot ...Booking open Available Pune Call Girls Talegaon Dabhade  6297143586 Call Hot ...
Booking open Available Pune Call Girls Talegaon Dabhade 6297143586 Call Hot ...
 
The Economic History of the U.S. Lecture 23.pdf
The Economic History of the U.S. Lecture 23.pdfThe Economic History of the U.S. Lecture 23.pdf
The Economic History of the U.S. Lecture 23.pdf
 
VIP Independent Call Girls in Mira Bhayandar 🌹 9920725232 ( Call Me ) Mumbai ...
VIP Independent Call Girls in Mira Bhayandar 🌹 9920725232 ( Call Me ) Mumbai ...VIP Independent Call Girls in Mira Bhayandar 🌹 9920725232 ( Call Me ) Mumbai ...
VIP Independent Call Girls in Mira Bhayandar 🌹 9920725232 ( Call Me ) Mumbai ...
 
TEST BANK For Corporate Finance, 13th Edition By Stephen Ross, Randolph Weste...
TEST BANK For Corporate Finance, 13th Edition By Stephen Ross, Randolph Weste...TEST BANK For Corporate Finance, 13th Edition By Stephen Ross, Randolph Weste...
TEST BANK For Corporate Finance, 13th Edition By Stephen Ross, Randolph Weste...
 
Call Girls in New Ashok Nagar, (delhi) call me [9953056974] escort service 24X7
Call Girls in New Ashok Nagar, (delhi) call me [9953056974] escort service 24X7Call Girls in New Ashok Nagar, (delhi) call me [9953056974] escort service 24X7
Call Girls in New Ashok Nagar, (delhi) call me [9953056974] escort service 24X7
 
The Economic History of the U.S. Lecture 17.pdf
The Economic History of the U.S. Lecture 17.pdfThe Economic History of the U.S. Lecture 17.pdf
The Economic History of the U.S. Lecture 17.pdf
 
The Economic History of the U.S. Lecture 26.pdf
The Economic History of the U.S. Lecture 26.pdfThe Economic History of the U.S. Lecture 26.pdf
The Economic History of the U.S. Lecture 26.pdf
 
Kharghar Blowjob Housewife Call Girls NUmber-9833754194-CBD Belapur Internati...
Kharghar Blowjob Housewife Call Girls NUmber-9833754194-CBD Belapur Internati...Kharghar Blowjob Housewife Call Girls NUmber-9833754194-CBD Belapur Internati...
Kharghar Blowjob Housewife Call Girls NUmber-9833754194-CBD Belapur Internati...
 
06_Joeri Van Speybroek_Dell_MeetupDora&Cybersecurity.pdf
06_Joeri Van Speybroek_Dell_MeetupDora&Cybersecurity.pdf06_Joeri Van Speybroek_Dell_MeetupDora&Cybersecurity.pdf
06_Joeri Van Speybroek_Dell_MeetupDora&Cybersecurity.pdf
 
Booking open Available Pune Call Girls Shivane 6297143586 Call Hot Indian Gi...
Booking open Available Pune Call Girls Shivane  6297143586 Call Hot Indian Gi...Booking open Available Pune Call Girls Shivane  6297143586 Call Hot Indian Gi...
Booking open Available Pune Call Girls Shivane 6297143586 Call Hot Indian Gi...
 
The Economic History of the U.S. Lecture 18.pdf
The Economic History of the U.S. Lecture 18.pdfThe Economic History of the U.S. Lecture 18.pdf
The Economic History of the U.S. Lecture 18.pdf
 
VIP Call Girl Service Andheri West ⚡ 9920725232 What It Takes To Be The Best ...
VIP Call Girl Service Andheri West ⚡ 9920725232 What It Takes To Be The Best ...VIP Call Girl Service Andheri West ⚡ 9920725232 What It Takes To Be The Best ...
VIP Call Girl Service Andheri West ⚡ 9920725232 What It Takes To Be The Best ...
 
03_Emmanuel Ndiaye_Degroof Petercam.pptx
03_Emmanuel Ndiaye_Degroof Petercam.pptx03_Emmanuel Ndiaye_Degroof Petercam.pptx
03_Emmanuel Ndiaye_Degroof Petercam.pptx
 
Call Girls Koregaon Park Call Me 7737669865 Budget Friendly No Advance Booking
Call Girls Koregaon Park Call Me 7737669865 Budget Friendly No Advance BookingCall Girls Koregaon Park Call Me 7737669865 Budget Friendly No Advance Booking
Call Girls Koregaon Park Call Me 7737669865 Budget Friendly No Advance Booking
 
Gurley shaw Theory of Monetary Economics.
Gurley shaw Theory of Monetary Economics.Gurley shaw Theory of Monetary Economics.
Gurley shaw Theory of Monetary Economics.
 
(Vedika) Low Rate Call Girls in Pune Call Now 8250077686 Pune Escorts 24x7
(Vedika) Low Rate Call Girls in Pune Call Now 8250077686 Pune Escorts 24x7(Vedika) Low Rate Call Girls in Pune Call Now 8250077686 Pune Escorts 24x7
(Vedika) Low Rate Call Girls in Pune Call Now 8250077686 Pune Escorts 24x7
 

Baltic Outlook January 2009

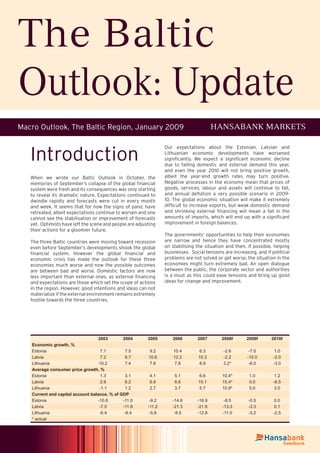
  • 1. Introduction When we wrote our Baltic Outlook in October, the memories of September’s collapse of the global financial system were fresh and its consequences was only starting to reveal its dramatic nature. Expectations continued to dwindle rapidly and forecasts were cut in every month and week. It seems that for now the signs of panic have retreated, albeit expectations continue to worsen and one cannot see the stabilisation or improvement of forecasts yet. Optimists have left the scene and people are adjusting their actions for a gloomier future. The three Baltic countries were moving toward recession even before September’s developments shook the global financial system. However the global financial and economic crisis has made the outlook for these three economies much worse and now the possible outcomes are between bad and worse. Domestic factors are now less important than external ones, as external financing and expectations are those which set the scope of actions in the region. However, good intentions and ideas can not materialize if the external environment remains extremely hostile towards the three countries. Our expectations about the Estonian, Latvian and Lithuanian economic developments have worsened significantly. We expect a significant economic decline due to falling domestic and external demand this year, and even the year 2010 will not bring positive growth, albeit the year-end growth rates may turn positive. Negative processes in the economy mean that prices of goods, services, labour and assets will continue to fall, and annual deflation a very possible scenario in 2009- 10. The global economic situation will make it extremely difficult to increase exports, but weak domestic demand and shrinking external financing will mean a fall in the amounts of imports, which will end up with a significant improvement in foreign balances. The governments’ opportunities to help their economies are narrow and hence they have concentrated mostly on stabilising the situation and then, if possible, helping businesses. Social tensions are increasing, and if political problems are not solved or get worse, the situation in the economies might turn extremely bad. An open dialogue between the public, the corporate sector and authorities is a must as this could ease tensions and bring up good ideas for change and improvement. 2003 2004 2005 2006 2007 2008f 2009f 2010f Economic growth, % Estonia 7.1 7.5 9.2 10.4 6.3 -2.6 -7.0 1.0 Latvia 7.2 8.7 10.6 12.2 10.3 -2.2 -10.0 -2.0 Lithuania 10.2 7.4 7.8 7.8 8.9 3.2* -6.0 -3.0 Average consumer price growth, % Estonia 1.3 3.1 4.1 5.1 6.6 10.4* 1.0 1.2 Latvia 2.9 6.2 6.9 6.6 10.1 15.4* 0.0 -6.5 Lithuania -1.1 1.2 2.7 3.7 5.7 10.9* 5.0 3.0 Current and capital account balance, % of GDP Estonia -10.6 -11.0 -9.2 -14.6 -16.9 -8.5 -0.5 0.0 Latvia -7.5 -11.8 -11.2 -21.3 -21.8 -13.3 -3.3 0.1 Lithuania -6.4 -6.4 -5.8 -9.5 -12.8 -11.0 -3.2 -2.5 * actual Macro Outlook, The Baltic Region, January 2009 HANSABANK MARKETS The Baltic Outlook: Update
  • 2. 2 Estonia Estonia We have cut our expectations substantially due to the worsening global economic situation and the hostile financial environment. We expect the Estonian economy to fall 5-8% in 2009 with a slight recovery in 2010 (with a possible decline in the 1st half of that year). The economy is about to see monthly deflation turn into an annual price decrease in the 2nd half of 2009, a rapid correction of the current account deficit and growing unemployment. Contributions to Real GDP Grow th -15% -10% -5% 0% 5% 10% 15% 20% 25% 2006 2007 2008f 2009f 2010f Households Gov ernment Inv estments Net exports Errors Economic growth Source: ESA, HBM calculations and forecast The economy will decline in 2009, due to falling domestic demand,by6-9%ashouseholdspendingdeclinesby5-8%, government consumption by 2-3% and investments by 13- 16%. Exports are expected to fall, but imports’ decline will be deeper and net exports will contribute positively to GDP growth like what happened in 2008. In 2010 the economy is expected to grow 0.5-3% as investments are expected to show a recovery, household consumption to shift into slightly positive territory and net exports to contribute positively. The government’s contribution may be slightly positive or negative depending on policy choices they are about to do in 2009. Our forecast, which may look too positive regarding 2010, is based on several assumptions. First, we expect that foreign direct investments will start to increase in the 2nd half of 2009 as asset prices continue falling, making them attractive to investors. Falling wages and growing unemployment should support production transfers to Estonia (e.g. from Finland, Sweden, Germany) especially when taking into account the lower wage costs here (now ca EUR 7.5 per hour) and room for productivity improvement. However, those investments should take into account the long-term convergence process (e.g. diminishing labour supply which eventually results in higher wage level). The second factor, which we count as positively affecting the economy, is transfers from different EU funds. The amount available from this source is substantial, and if Brussels’ promise of earlier distribution of some funds along with diminishing its bureaucracy stands (contingent on the improvement of administrative work in Estonia), we can expect that 60-70% of EU funds currently planned in the budget will be used. However, this scenario also requires that the problem of finding co-financing of related projects can be solved. For this, different types of government actions are needed (e.g. extending guarantees for bank loans, etc). The third factor, which affects our economic processes negatively, but has very important implications for overall economic development, especially in 2009, is external financing through commercial banks. We are highly sceptical about forecasting that domestic banks will have to relay on domestic sources (i.e. deposits and back-payment of loans). This and an increasing level of bankruptcies will end up with domestic and external debt falling in 2009 and 2010. Interest rates will continue to fall but are to remain high due to the cost of funding and elevated risk assumptions, and that will make private investments difficult without governmental support. Poor access to loans and the high cost of borrowing will be one reason we expect that takeovers of domestic companies will increase in 2009-2010. The EU funds and FDI are sources which will gradually start to support investments. However, the decline in investments will be sharp as residential construction, which we now expect to remain minimal for 2-3 years, gained elevated shares during 2006-2007’s construction boom. Increasing competition and lower prices may end up with a real growth in public investment, although the sums available for investments will diminish (practically the only way to make public investments is from EU funding). Falling prices of construction should help investments, but investments into machinery and equipment require positive outlook besides finances. Recent months have deeply undermined companies’ confidence, which will affect investments in the 1st half of 2009 significantly. We expect the number of employed persons to decrease 4-6% and total wage payments to fall up to 15% in 2009. Still, we also expect non-activity to increase and labour outflow as well (e.g. to non-attractive Finnish regions; Current And Capital Account, % of GDP -25% -20% -15% -10% -5% 0% 5% 10% 2007 2008f 2009f 2010f Trade and serv ices Priv ate tranf ers, wages Gov ernment transf ers Other Reinv ested prof its Source: EP; HBM calculations and forecast
  • 3. 3Estonia mostly in 2010). Wage payments will decrease due to their loweringalongwithdiminishedworkinghours.Thisprocess (supported by changes in the labour market regulations from July 2009) is expected to improve the efficiency of production and grant the survival of stronger companies even in this extremely difficult economic situation. The build up of precautionary reserves, which started in late 2007 and early 2008, may stop at the most difficult times, but a few months after forecasts stabilize (i.e. not turning worse) households may start timidly increase their spending and savings as well. The stabilisation of unemployment rate (maybe in the 1st half ot 2010) should increase confidence, and the lower prices of goods and services will leave households with higher disposable income. Producer price deflation arrives already in early 2009 and construction prices are already falling, but consumer price deflation in annual comparison may arrive in the 3rd quarter of the year; cuts in heating tariffs (ca 40%) will contribute significantly to consumer price deflation and also to disposable income growth. The end of administrative price increases and lowering wages make possible, and weak demand and increasing competition will force companies to cut prices. Weakening currencies of Sweden, Poland and Russia will increase pressure on exporters and retail prices even more – so success in cutting prices might be a key to survival for many companies. Those developments are about to cut required profitability levels, which in 2006-2007 reached extraordinarily high levels, even remaining relatively high in the 3rd quarter of 2008 (6.8% in average on 12-month basis). The Estonian government is about to cut budget spending plans in February-April. This is not only because the government is targeting Euro adoption (and related to that the 3% of GDP budget deficit limit). Although the Estonian government has reserves, they are not big enough to cover the budget deficit for more than 1-2 years if existing spending plans are continued, as tax revenues are weak. Hence, borrowing is required, but with current lending terms it is difficult and economically unreasonable. Therefoe, one may say that the Estonian government is forced to cut spending to avoid a troubled financial situation in 2010-11. But we also expect that budget cuts will be made so that they improve the efficiency of public services, and spending will be increased in areas important for recovery (e.g. granting the use of EU funds, labour market activities, education, etc.). Supportive monetary policy measures would be highly welcome (e.g. lowering reserve and capital requirement). Maris Lauri Confidence (3-months average, s.a.) -70 -60 -50 -40 -30 -20 -10 0 10 20 30 40 50 Jul.02 Apr.03 Jan.04 Oct.04 Jul.05 Apr.06 Jan.07 Oct.07 Jul.08 Industry Consumer Construction Retail trade Serv ices Source: EKI; HBM calculations 2003 2004 2005 2006 2007 2008f 2009f 2010f Economic growth, % 7.1 7.5 9.2 10.4 6.3 -2.6 -7.0 1.0 GDP, EURm 8,693 9,651 11,091 13,104 15,270 15,860 15,000 15,900 GDP per capita, th kroons 100.5 111.9 128.9 152.6 178.1 185.0 180.0 180.0 euros 6,424 7,153 8,239 9,754 11,381 11,830 11,200 11,900 Growth of industrial production, % 11.0 10.5 10.9 10.0 6.8 -6.0 -10.0 2.0 Growth of GDP deflator, % 4.6 3.3 5.3 7.0 9.6 6.8 2.5 3.0 Growth of consumer prices, % 1.3 3.1 4.1 5.1 6.6 10.4* 1.0 1.2 Growth of harmonized consumer price index, % 1.4 3.0 4.1 4.5 6.7 10.6* 1.2 1.3 Growth of producer prices, % 0.2 2.9 2.1 4.5 8.3 7.2* -1.5 1.5 Harmonized unemployment rate (average), % 10.0 9.7 7.9 5.9 4.7 5.8 9.5 9.0 Real growth of average monthly gross wage, % 8.0 5.1 6.1 10.5 13.0 3.5 -3.0 1.0 Growth of exports of goods and services, % 9.3 16.8 26.0 19.2 6.9 6.8 -6.5 3.0 Growth of imports of goods and services, % 10.0 16.2 23.5 26.6 7.5 -2.0 -12.0 2.0 Balance of goods and services, % of GDP -7.4 -7.4 -6.4 -11.8 -11.3 -4.2 -1.0 -0.5 Balance of current and capital account, % of GDP -10.6 -11.0 -9.2 -14.6 -16.9 -8.5 -0.5 0.0 Inflow of FDI, % of GDP 9.5 7.4 20.8 14.6 12.8 8.0 7.8 7.0 Foreign gross debt, % of GDP 64.5 76.1 86.2 97.4 112.3 110.0 105.0 94.0 General government budget position, % of GDP 1.8 1.7 1.9 3.6 3.3 -1.8 -3.4 -2.5 General government debt, % of GDP 5.5 5.0 4.4 4.0 3.0 2.7 3.5 4.0 *actual
  • 4. 4 Latvia Latvia We foresee a deep and long recession. There will be no growth support from the exports side and deflation is inevitable. Our forecasts are based on the assumption that the world economy will start to recover in mid 2010. We expect GDP to fall ca 2% in 2008 and ca 10% in 2009 (we forecasted -1% and -4% before). In line with global developments, Latvian economy is expected to start recovering only in the 2nd half of 2010; however, growth for the whole of 2010 will still be negative. Productivity deterioration might continue in 2009, nevertheless, with weaker businesses going bankrupt, it will improve in 2010. It has to be noted that there are strong downside risks attached to this forecast. Contributions to GDP Annual Grow th, pp -30 -20 -10 0 10 20 30 2004 2005 2006 2007 2008f 2009f 2010f Households consumption Gov ernment consumption Gross capital f ormation Exports Imports GDP Source: CSBL; HBM calculations and forecast The fall in household consumption was deepened in the 4th quarter and will continue to do so throughout 2009. A slow recovery is expected only in the 2nd half of 2011. The share of household consumption in GDP went up to an unsustainable 72% in 2007 and we expect it to fall to the historical average of ca 60% by the end of current crisis. Thus a fall in household consumption by 16% will exceed the GDP decline. Consumption will be cut by: Delining employment - unemployment rate will● reach its peak in 2010 at ca 16%. Wage cuts for many of those who keep their● jobs, enabled by disappearing bargaining power of employees and a low degree of unionisation. The average fall in nominal wages will be ca 15% in 2009, partly through the virtual disappearance of bonuses. The fall will decelerate in 2010. Credit squeeze. Loan stock started to fall in● November and will probably continue to do so in 2009-2010, driven by pessimism, tighter loan conditions and high risk premiums. Government consumption will diminish in 2009-2010 as well, suppressed both by the terms of the IMF Stand-By Arrangement and weak tax revenues (see below). As margins and profits fall, credit is scarce and expensive, and demand outlook is unfavourable, businesses will be neither able nor willing to sustain investments at previous levels. In 2009 investments will fall by 30%. However, investments will recover ahead of household consumption, already by the 2nd half of 2010. Nevertheless, the overall number for 2010 will be negative. Construction activity is expected to be very low for several years. After surprisingly strong export performance in early 2008 it swiftly deteriorated as global crisis deepened. Imports were falling already in the 1st half of the year but the decline accelerated in the 3rd quarter. With decrease in world demand being bigger than anticipated before, appreciating EUR as well as credit squeeze, exports are expected to decline in 2009 and remain stable or grow slowly in 2010 in nominal terms. Falling domestic demand will accelerate the reduction of nominal imports in 2009 and, unlike for exports, the trend will remain negative also in 2010. Consequently, current account deficit is expected to improve swiftly, reaching ca 5.5% and 3% in 2009 and 2010, respectively. We expect external financing to remain limited in 2009 and 2010 due to global credit crunch. With current global deflationary pressures and planned wage cuts, deflation, mentioned as the November Outlook, is now very likely for the 2nd half of 2009. The year will start with double-digit annual inflation, yet it will decelerate even more sharply than in 2008 (except in January-February, due to tax changes). Thus average CPI growth in 2009 is forecast to be around 0%. World price decreases, depreciation of currencies in Latvia’s trade partner countries and fall in domestic consumption will force Latvian companies to cut prices and wages, as they are preconditions for restoring international competitiveness. In 2010 we forecast prices to remain stable on average; however, due to the base effect of 2009 adjustments, we expect prices also to fall on average in 2010. The exchange rate regime is expected to stay intact, making the implementation of activities set out in Stand- By Agreement crucial. Current Account, % of GDP -30 -25 -20 -15 -10 -5 0 5 10 1996 1997 1998 1999 2000 2001 2002 2003 2004 2005 2006 2007 2008f 2009f 2010f Trade in goods and serv ices Compensation of employ ees Interest (debt and portf olio) Div idends Transf ers Current account Source: LaB; HBM calculations and forecast
  • 5. 5Latvia Economic policy Latvia now faces two main issues to deal with: In the short run: removing the liquidity squeeze,● exacerbated by the Parex takeover. It is an urgent issue for both, the government and businesses. As the government at least has some access to finance, it should try to alleviate the situation of companies, for example, through tax postponements. In the medium and long run: regaining● competitiveness as well as moving the economy’s product mix towards goods and services demanded in external markets In order to improve competitiveness, both wage restraints or outright reductions as well as productivity gains and efficiency enhancements are necessary. While falling real incomes are undesirable, in the short run they are unavoidable as the other, more pleasant route — doing more with less – cannot be implemented rapidly enough. IMF Stand-By Arrangement* (SBA) was released in January, supplemented by EU and several neighbouring countries and totalling EUR 7.5b for the period of 27 months. SBA tackles liquidity problem by providing financing for rolling over commercial bank debt and financing the budget deficit. In order to make the currency peg sustainable, public payroll cost decreases and structural reforms are imposed as a pre-condition. The government implemented several other measures . For instance, changes in tax policy and aggressive cuts on other spending besides payroll, bringing the total impact on the earlier 2009 budget up to 7% of GDP. 1/3 of this adjustment is coming from the revenue side (e.g. VAT and excise increase, capital income tax from 2010) and 2/3 from cutting expenditures. The government is required to reduce public sector wage bill by ca 30% from 2008 level, of which ca. 5 pp is through lay-offs, 25 pp through wages, partly by elimination of bonuses. Most of the other current spending positions of the general government are to be cut by ca 25%. The program also requires the government to implement measures aimed at higher GDP growth in the future — to continue co-financing for EU structural funds, export promotions, more efficient insolvency regimes, and tighter bank supervision. In addition, there are several quantitative performance criteria to be constantly checked by the IMF (e.g. a floor on net international reserves), as well as structural benchmarks with specific deadlines (e.g. the development of a comprehensive debt restructuring strategy by April 30, 2009). The intended exit strategy is euro accession by 2012 made possible by rapid elimination of inflationary pressures; however, this will require strict budget policy under extraordinarily difficult circumstances. In our opinion, IMF forecast for 2009 is quite optimistic (regarding GDP and inflation), which puts 5% budget deficit target at risk and further expenditure cut is required. Mārtiņš Kazāks Ivonna Slapiņa Dainis Stikuts Lija Strašuna Pēteris Strautiņš * The full text of SBA: http://www.imf.org/external/pubs/cat/longres.cfm?sk=22586.0 Unemployment and Inflation -40 -20 0 20 40 60 80 2004 2005 2006 2007 2008f 2009f 2010f -10% -5% 0% 5% 10% 15% 20% Consumer price growth, y oy (r.s.) Rate of job seekers (r.s.) Inf lation expectations, end of y ear (l.s.) Unemploy ment expectations, end of y ear (l.s.) Source: CSBL, Eurostat; HBM calculations and forecast 2002 2003 2004 2005 2006 2007 2008f 2009f 2010f Economic growth, % 6.5 7.2 8.7 10.6 12.2 10.3 -2.2 -10.0 -2.0 GDP, mln euros 9,911 9,978 11,176 13,012 16,047 19,936 21,837 18,199 17,247 GDP per capita, euro 4,251 4,302 4,846 5,671 7,034 8,779 9,646 8,081 7,699 Growth of GDP deflator, % 3.6 3.6 7.0 10.2 9.9 13.3 12.0 -7.4 -3.3 Growth of consumer prices, % 2.0 2.9 6.2 6.7 6.6 10.1 15.4* 0.0 -6.5 Growth of harmonized consumer price index, % 2.0 2.9 6.2 6.9 6.6 10.1 15.4* 0.0 -6.5 Growth of producer prices, % 1.0 3.1 8.6 7.8 10.3 16.1 11.5* na na Harmonised unemployment level, % 12.2 10.5 10.4 8.9 6.8 6.0 7.0 13.5 16.0 Real growth of average net monthly wage, % 6.0 7.8 2.4 9.7 15.6 19.9 5.0 -15.0 -2.0 Growth of exports of goods and services, % 8.6 14.3 21.4 31.4 15.3 24.1 11.0 -14.0 0.0 Growth of imports of goods and services, % 9.0 19.5 27.0 27.4 31.3 23.5 -1.5 -25.0 -8.0 Balance of goods and services, % of GDP -10.0 -12.7 -15.8 -15.2 -22.2 -21.8 -14.6 -7.3 -3.2 Current account balance, % of GDP -6.6 -8.2 -12.8 -12.5 -22.5 -23.8 -15.0 -5.5 -2.7 Current and capital account balance, % of GDP -6.4 -7.5 -11.8 -11.2 -21.3 -21.8 -13.3 -3.3 0.1 Net FDI, % of GDP 2.7 2.3 3.8 3.6 7.5 7.1 6.0 2.0 2.0 Foreign gross debt, % of GDP 72.7 79.6 93.3 99.4 114.0 135.1 137.0 138.3 136.2 General government budget, % of GDP (ESA) -2.3 -1.6 -1.0 -0.4 -0.2 0.1 -3.5 -7.5 -6.0 General government debt, % of GDP 13.5 14.6 14.9 12.4 10.7 9.5 16.0 37.0 47.0 * fact
  • 6. 6 Lithuania Lithuania Economic downturn in Lithuania will be deeper and longer than assumed before, given a substantially weakening global environment, especially shrinking economies of the main trading partners of Lithuania, and fast changing downward processes in Lithuania itself. A decline in all components of the domestic demand is anticipated and positive effect of net exports will not be enough to compensate for it. We expect the economy to contract by ~6% this year (the previous expectation was in the range of -1.5-0.5%) and by ~3% next year. Thus, Lithuania is entering a protracted recession, which is forecast to continue next year. Declining demand in local markets and faltering external demand will halt companies’ investment plans. Household consumption will be impaired by lower incomes, unemployment fears and limited borrowing possibilities. We do not rule out a possibility, however, of an even sharper drop in economic growth in the next 1-2 years, considering the current business and consumer pessimism and uncertainty in the global environment. Confidence Indicators -80 -60 -40 -20 0 20 40 2004 2005 2006 2007 2008 Ov erall sentiment Industry Construction Retail trade Serv ices Consumer Source: LDS Household consumption will be negatively influenced by a rise in unemployment, negative growth of real wages and an increase in pessimism. An increase in expenditures on utilities and more expensive foodstuffs (especially meat) will force households to reduce consumption on non- essentials goods and services. We forecast household consumption to decrease ~7% (strong downside risks remain). The major factors that will discourage consumption are the following: Unemployment is expected to be ~9.5% in 2009● and ~12% in 2010. This means ca 65 thousand new unemployed this year and additional 40 thousand next year. Layoffs, which started in the 4Q 2008, will continue: almost half of local companies are planning to lay off workers, with the largest dismissals in industry and construction. The total cut in employment will be ~4-5%. We expect a ~3-4% decline of real net wage for● 2009-10. Despite a drop in wages in some companies, the average gross wage is expected to remain unchanged due to structural changes and layoffs of low-wage workers. The modest positive effect on nominal net wage growth this year will come from the personal income tax rate cut to 21% from 24%, starting in January, but this effect will be lessened by the changes in the general non-taxed minimum (LTL 320 before Jan. 1 2009). The decrease in gross salaries in the public sector (but an increase in net wages due a drop in personal income tax burden) will push the average wage growth slightly downward. Government consumption is expected to decrease by ca 5% this year. We forecast that the budget deficit will reach ~3% of GDP and thus fit under Maastricht criteria. The new government introduced the anti-crisis plan, which, among other measures, includes many tax changes, which are intended to reduce the budget deficit. VAT rate was increased from 18% to 19%, personal income tax was cut and excise duties for fuel, alcoholic beverages and cigarettes were raised even more than is required by the EU at the end of the given transitional period. The majority of income tax and VAT exemptions were repealed. The majority of measures of the plan are meant to eliminate distortions present in the previous tax system, broaden the tax base and target needed protection for the most vulnerable groups. Although all expenditure items are expected to fall in 2009, investments are expected to decline the most and thus contribute extensively to the fall in domestic demand. We forecast investment in fixed assets to contract by ~20% this year. The forecast is due to a sharp downturn in the construction sector, which was the most salient source of investment in the previous boom years, and credit conditions, which, although eased to a certain extent towards the end of 2008, will remain tight. New funding from parent banks is expected to decline from the elevated levels of recent years, and thus credit to the private sector will decrease substantially. Weakening demand both in Lithuania and its main trading partners will shrink profit margins and further limit business investment. We expect negative investment growth to continue in 2010. Economic Grow th and Inflation 4.2% 6.7% 6.9% 10.2% 7.4% 7.8% 7.8% 8.9% 3.2% -6.0% -3.0% -8% -6% -4% -2% 0% 2% 4% 6% 8% 10% 12% 2000 2002 2004 2006 2008 2010f GDP Inf lation Source: LDS, HBM forecast
  • 7. 7Lithuania After having peaked in the 1st half of the year, the current- account deficit narrowed in the 2nd half of last year owing to weakening demand and weaker global conditions, which slowed down import (and export) growth significantly. A sharper economic slowdown is expected to alleviate external imbalances even more this year: mainly due to the narrowing of the trade balance, the current account is forecast to reach ~ -5% of GDP in 2009. Even though the Lithuanian export outlook is certainly not reassuring, imports are expected to fall even more. Export prospects have declined significantly as the slowdown has become more severe than expected in Lithuania’s main trading partners. The export boom to CIS countries (Russia, Ukraine, Belarus) is likely to slow significantly due to a weaker global economy and lower commodity prices. On the positive side, the country’s competitiveness is going to improve through wage and employment cuts, which will improve productivity growth. Exports will decline by less next year as the global economy recovers; however, the correction in the external imbalances is not going to continue due to a substantial increase in imports for fossil fuels, as Ignalina NPP is to be closed at the end of the year. The services account will remain in surplus, but demand for transport services and tourism will weaken significantly. Inflows of EU structural funds should maintain the surplus on current transfers. Given the vulnerability of emerging market economies to the current economic downturn, we do not expect significant FDI and other investment flows. Nevertheless, in order to raise funds, the Lithuanian government has also announced its plans to sell the rest (9.98%) of Mazeikiu nafta shares to Poland’s PKN Orlen for approximately LTL 705 million (EUR 204.18 m.), which will, at 0.6% of GDP, be an important source to finance the CAD. Weakening domestic and external demand resulted in a decline of consumer price inflation from the 4th quarter of 2008. We expect the process to continue and anticipate that annual average inflation will moderate to ~5% this year. Sharper disinflation, however, is prevented by significant administrative price increases. Rises in energy prices alone - electricity by 12%, gas by 26%, and the termination of the VAT exemption on heating services in autumn could push inflation upwards by ~1-1.5% percentage points. An increase in excise duties on alcohol, cigarettes and fuel (although the effect of fuel excise tax increases could be mitigated by stabilization in oil prices) will further push inflation upwards. An increase in the standard VAT rate and termination of all preferential VAT rates could raise average annual inflation by ~3%, however, the effect is likely to be significantly smaller as price increases are not going to be passed onto consumers fully so as to prevent a critical fall in demand. We do expect, however, monthly deflation in some months of the second and third quarters. Next year, solely due to cost-push pressures, inflation will remain high and only mitigate to ~3%. Weak domestic demand will continue to exert a downward pressure; however, energy price increases together with the second-round effects will push inflation upwards. Lina Vrubliauskienė Ieva Vyšniauskaitė 2003 2004 2005 2006 2007 2008f 2009f 2010f Economic growth, % 10.2 7.4 7.8 7.8 8.9 3.2* -6.0 -3.0 GDP, mln euros 16,452 18,159 20,870 23,978 28,423 32,272* 31,095 30,765 GDP per capita, euros 4,776 5,285 6,113 7,065 8,420 9,606* 9,297 9,235 Growth of industrial sales, % 16.1 10.8 7.1 7.3 4.0 2.7* -2.0 -2.0 Growth of GDP deflator, % -0.8 2.5 6.6 6.5 8.8 10.0* 2.5 2.0 Growth of consumer prices, % -1.1 1.2 2.7 3.7 5.7 10.9* 5.0 3.0 Growth of harmonized consumer price index, % -1.1 1.2 2.7 3.8 5.8 11.1* 5.0 3.0 Growth of producer prices, % -0.5 6.0 11.5 7.4 7.0 18.2* -8.0 4.5 Harmonized unemployment level, % 12.4 11.4 8.3 5.6 4.3 5.6 9.5 12.0 Growth of real net wage, % 9.3 4.9 6.8 14.9 17.7 11.2 -4.0 -3.0 Growth of exports of goods and services, % 6.2 12.0 27.0 17.9 9.2 25.0 -4.0 -2.0 Growth of imports of goods and services, % 6.9 14.2 26.1 23.1 15.9 20.8 -12.7 -0.9 Balance of goods and services, % of GDP -5.7 -7.0 -7.2 -10.3 -13.4 -11.9 -5.7 -6.4 Current account, % of GDP -6.8 -7.7 -7.1 -10.6 -14.6 -12.8 -5.0 -5.5 Current and capital account, % of GDP -6.4 -6.4 -5.8 -9.5 -12.8 -11.0 -3.2 -2.5 FDI inflow, % of GDP 1.0 3.4 4.0 6.0 5.2 3.6 3.8 3.8 Foreign gross debt, % of GDP 40.5 42.4 50.7 60.2 72.3 73.8 76.7 76.0 General government budget position, % of GDP -1.3 -1.5 -0.5 -0.4 -1.2 -2.9* -3.0 -2.5 General government debt, % of GDP 21.1 19.4 18.4 18.0 17.0 17.2 19.5 20.0 * actual results Labour Market, annual grow th rates 12.4% 11.4% 8.3% 5.6% 4.3% 5.3% 9.5% 12.0% -8% -4% 0% 4% 8% 12% 16% 20% 24% 2003 2004 2005 2006 2007 2008f 2009f 2010f Unemploy ment rate Gross nominal wage Net real wage Source: LDS, HBM calculations
  • 8. Disclaimer: Hansabank Markets a brokerage division of AS Hansapank in Estonia, AS Hansabanka in Latvia and AB Bankas Hansabankas in Lithuania (hereinafter the above banks and any of their division or affiliate collectively referred to as Hansabank Group) is responsible for preparation of research reports. The opinions contained within this report are the opinions of the persons responsible for preparation of this report and may differ from those of Hansabank Group. Hansabank Group is regulated by the Financial Supervision Authorities in Estonia, Latvia and Lithuania. Hansabank Group may make a market in, or may, as principal or agent, buy or sell securities or derivatives of the companies mentioned in this report. Hansabank Group or its officers and employees may serve or have served as an officer, director or in an advisory capacity for any company mentioned in this report and from time to time, solicit, perform or have performed investment banking, underwriting or other services (including acting as an adviser, manager, underwriter or lender) within last 12 months for any company referred to in this report. Hansabank Group may receive or intend to seek compensation from investment banking services in the next three months from any issuer mentioned in this report. Hansabank Group may also perform or seek to perform banking services for those companies Neither Hansabank Group nor any of their directors, officers or employees will accept responsibility for any direct or indirect losses arising from the use of this report without limitation any loss of profits even if Hansabank Group has expressly advised of the possibility or likelihood of such loss. Hansabank Group or its directors, officers or employees may have financial interest in the companies mentioned in this report, including a long or short positions in their securities, and/or options, futures or other derivative instruments based thereon. Hansabank Group draws your attention to the fact that past performance does not necessarily indicate the future performance and the indications of future performance are based on assumptions, which may not be realized. The value of and income from your investment may change due to the changes of interest rates, changes of foreign exchange rates, securities prices or market indexes or other factors that may change the conditions of the securities market. This report is not a tender to buy or sell, nor is it a solicitation to buy or sell any securities. This report has been prepared without regard to the individual financial circumstances and objectives of persons who receive this report. Therefore, the report does not provide individual investment advice. The securities referred to in this report may not be suitable for all investors. Investors should independently and carefully evaluate every particular investment and seek the advice of financial adviser, if needed. The distribution of this report may be restricted in certain jurisdictions and persons into whose possession this report comes should inform themselves about and act pursuant to such restrictions. This report is based upon information available to the public. The information contained within this report has been compiled from sources deemed to be both expert and reliable, however no statement is made which guarantees the accuracy, completeness, nor the timeless of this information and this information should not be relied upon as such. Any opinions expressed herein reflect a professional judgement at the date of publication and are subject to change. Any company mentioned in this report may have an position in Hansabank Group. Also, any company mentioned in this report may have been provided with section of this report prior to its publication in order to verify its factual accuracy and the report may have been amended after that, if necessary. Hansabank Group may to the extent permitted by law, have acted upon or used the information contained herein, or the research or analysis on which it was based, before its publication. In preparation of this report different valuation methods have been used including but not limited to discounted free cash-flow and comparative analysis. The selection of methods depends on different circumstances. This report is amended periodically, once a month/quarter or more often if required. The research analysts responsible for the preparation of this report receive compensation, based upon various factors, including quality and accuracy of the research, client feedback, competitive factors and overall Hansabank Group revenues. Hansabank Group’s overall revenues include revenues from its investment banking and fixed income business units. The analysts do not own securities mentioned in this report. Maris Lauri +372 888 1202 maris.lauri@swedbank.ee Mārtiņš Kazāks +371 67 445 859 martins.kazaks@swedbank.lv Lina Vrubliauskienė +370 5 268 4275 lina.vrubliauskiene@swedbank.lt Hansabank Markets Tel.+372 6 131 670 , Fax. +372 6 132 099 Liivalaia 8, 15040, Tallinn, Estonia