The Estonian Economy, 2010 May
•
1 j'aime•1,288 vues

Swedbank was founded in 1820, as Sweden’s first savings bank was established. Today, our heritage is visible in that we truly are a bank for each and every one and in that we still strive to contribute to a sustainable development of society and our environment. We are strongly committed to society as a whole and keen to help bring about a sustainable form of societal development. Our Swedish operations hold an ISO 14001 environmental certification, and environmental work is an integral part of our business activities.

Recommandé
Contenu connexe
Tendances
Tendances (20)
En vedette
En vedette (12)
Similaire à The Estonian Economy, 2010 May
Similaire à The Estonian Economy, 2010 May (20)
Plus de Swedbank
Plus de Swedbank (20)
Dernier
Dernier (20)
The Estonian Economy, 2010 May
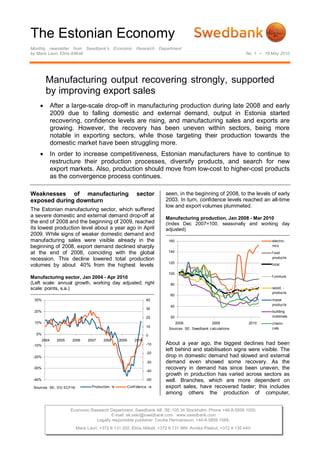
- 1. The Estonian Economy Monthly newsletter from Swedbank’s Economic Research Department by Maris Lauri, Elina Allikalt No. 1 • 19 May 2010 Economic Research Department. Swedbank AB. SE-105 34 Stockholm. Phone +46-8-5859 1000. E-mail: ek.sekr@swedbank.com www.swedbank.com Legally responsible publisher: Cecilia Hermansson, +46-8-5859 1588. Maris Lauri, +372 6 131 202. Elina Allikalt, +372 6 131 989. Annika Paabut, +372 6 135 440. Manufacturing output recovering strongly, supported by improving export sales After a large-scale drop-off in manufacturing production during late 2008 and early 2009 due to falling domestic and external demand, output in Estonia started recovering, confidence levels are rising, and manufacturing sales and exports are growing. However, the recovery has been uneven within sectors, being more notable in exporting sectors, while those targeting their production towards the domestic market have been struggling more. In order to increase competitiveness, Estonian manufacturers have to continue to restructure their production processes, diversify products, and search for new export markets. Also, production should move from low-cost to higher-cost products as the convergence process continues. Weaknesses of manufacturing sector exposed during downturn The Estonian manufacturing sector, which suffered a severe domestic and external demand drop-off at the end of 2008 and the beginning of 2009, reached its lowest production level about a year ago in April 2009. While signs of weaker domestic demand and manufacturing sales were visible already in the beginning of 2008, export demand declined sharply at the end of 2008, coinciding with the global recession. This decline lowered total production volumes by about 40% from the highest levels Manufacturing sector, Jan 2004 - Apr 2010 (Left scale: annual growth, working day adjusted; right scale: points, s.a.) -40% -30% -20% -10% 0% 10% 20% 30% 2004 2005 2006 2007 2008 2009 2010 -50 -40 -30 -20 -10 0 10 20 30 40 Production, ls Conf idence, rsSources: SE, DG ECFIN seen, in the beginning of 2008, to the levels of early 2003. In turn, confidence levels reached an all-time low and export volumes plummeted. Manufacturing production, Jan 2008 - Mar 2010 (Index Dec 2007=100, seasonally and working day adjusted) 20 40 60 80 100 120 140 160 2008 2009 2010 electro- nics f ood products total f urniture wood, - products metal products building materials chemi- calsSources: SE, Swedbank calculations About a year ago, the biggest declines had been left behind and stabilisation signs were visible. The drop in domestic demand had slowed and external demand even showed some recovery. As the recovery in demand has since been uneven, the growth in production has varied across sectors as well. Branches, which are more dependent on export sales, have recovered faster; this includes among others the production of computer,
- 2. The Estonian Economy Monthly newsletter from Swedbank’s Economic Research Department, continued Nr 1 • 19 May 2010 2 (5) electronics, and optical products, wood and timber products, and food products. As domestic demand has continued to be sluggish, industries such as the manufacturing of building materials have been taking more time to recover. Manufacturing sales, Jan 2006 - Mar 2010 (Annual change compared to same period in previous year) -40% -30% -20% -10% 0% 10% 20% 30% 2006 2007 2008 2009 2010 Total Export DomesticSource: SE During the downturn, manufacturing export sales suffered the most due to a sharp drop in Estonia’s main export markets (Finland, Sweden, and Germany). One can clearly see that the sharpest decline in Estonian manufacturing occurred due to a deterioration of production in those markets (see chart). This was a result of the large share of subcontracting in export production in Estonian manufacturing, particularly in the production of capital goods, which are more sensitive to the fluctuations of an economic cycle. The subcontracting and tight connections with high- technology firms are good for acquiring knowledge, developing business contacts, and production transfers. However, subcontracting can be problematic too, as Estonian companies saw during the recent boom-and-crisis years: global cost competition is harsh, and contracts tend to be short term, which means that market share is easy to lose. In addition, the convergence process, which intensified as expected when Estonia became a member of the EU, pushed up production costs, particularly labour costs (also because of declining labour supply), thus weakening the cost competitiveness of Estonian producers even more. Manufacturing production, Jan 2000 - Mar 2010 (Index 2005=100, 3-month averages, seasonally and calendar adjusted) 40 60 80 100 120 140 160 2000 2001 2002 2003 2004 2005 2006 2007 2008 2009 2010 Capital goods Durable goods Intermediate goods Nondurable consumer goods Source: SE, Swedbank calculations Manufacturing production, Jan 1997 - Mar 2010 (Index 2005=100, 3-month averages, seasonally adjusted) 50 60 70 80 90 100 110 120 130 1997 1998 1999 2000 2001 2002 2003 2004 2005 2006 2007 2008 2009 2010 Sweden Finland Germany Estonia Source: Reuters EcoWin, Swedbank calculations Of course, in addition to external demand factors, there were local problems too regarding businesses themselves as well as economic developments. For instance, producers did not focus enough on maintaining international competitiveness and investing in more advanced technologies and production. Instead, domestic demand in the overheating economy was preferred and production was expanded by using old technologies, while efficiency issues were neglected as a rule. Many companies started to invest in “popular” areas, like real estate, which afterwards become a source of difficulties or bankruptcy in the otherwise profitable main business area.
- 3. The Estonian Economy Monthly newsletter from Swedbank’s Economic Research Department, continued Nr 1 • 19 May 2010 3 (5) Manufacturing Survey: Competitive position, 1Q 2004 - 2Q 2010 (Balance of answers "better"/"worse", seasonally adjusted) -15 -10 -5 0 5 10 15 20 2004 2005 2006 2007 2008 2009 2010 Inside EU Outside EUSource: DG ECFIN Manufacturing Survey: Current export demand, 1Q 2006 - 1Q 2010 (Balance of answers "above/below regular level", 6- month average) -100 -80 -60 -40 -20 0 20 40 2006 2007 2008 2009 2010 Wood and -products Tele- communic. apparatus Food products Furniture Chemicals Textiles Metal products Source: EKI Demand in Estonia’s main export markets started recovering rather slowly in 2009, thus motivating Estonian companies to find new markets outside their main markets, and especially outside the EU, for which growth prospects are far weaker than for other regions of world, and to diversify their products accordingly. As the manufacturing survey shows (see chart), the competitive position of companies had always been higher inside the EU than outside but the levels evened up during 2009, and competitiveness outside the EU has overtaken competitiveness inside in 2010. Although the EU has remained the major export partner for Estonia (covering about 65-70% of total), the shares of Sweden and Finland have fallen in goods exports, and other EU countries and non-EU countries have strengthened their positions. This is a good development, as it diminishes Estonia’s dependence on only a few certain countries. Overall manufacturing confidence hit its lowest levels about a year ago in March 2009, when production levels were the lowest as well. Within a year, however, confidence has risen from -40 points to almost equilibrium. Production trends and order- book levels have been steadily improving, with production targeted to the export markets assessed as better than average. The stock of finished products, however, has been thought to be too low for the last half-year. Employment expectations turned positive in April, for the first time since February 2008. Manufacturing Confidence, Jan 2006 - Apr 2010 (Seasonally adjusted) -80 -60 -40 -20 0 20 40 2006 2007 2008 2009 2010 Total Order-book lev els Stocks of f inished products Production expectations Source: DG ECFIN All this gives reason to believe that the improvement in manufacturing will continue in 2010 and 2011. Of course, the main basis for future growth will come from recovering global demand, which is still connected with many uncertainties and poses several risks (especially inside the euro zone). Nevertheless, the elimination of extravagancies (e.g., overstaffing and a strong reliance on the domestic market) has made surviving companies stronger and benefited them in international competition. The domestic demand- oriented industries, however, are expected to improve more slower. At the same time, it is becoming more and more difficult to distinguish between domestic and exporting producers. Even the food industry, which traditionally is more domestically oriented, is about to produce more for export, as an increasing number of factories are going into the hands of Nordic consortia (the latest
- 4. The Estonian Economy Monthly newsletter from Swedbank’s Economic Research Department, continued Nr 1 • 19 May 2010 4 (5) being the candy-maker Kalev), and Nordic retailers are looking for producers of label products in Estonia. Competitiveness needs to improve even more Although the Estonian manufacturers have weathered the recent plunge quite well by restructuring their production, more needs to be done in order to increase competitiveness and to profit more from their different strengths and advantages - even more so because the Estonian manufacturing sector is very dependent on exports. Cost competitiveness in the Nordic region continues to favour Estonia. Although one cannot expect that costs will remain as low as they were or are now, the convergence process will take several years. Labour cost levels in Estonia are not the lowest in the eastern coast of the Baltic Sea; however, compared with its main economic partners (Sweden, Finland, and Germany), Estonia’s are substantially lower. Wages declined in 2009 and will continue to do so in 2010, as the internal devaluation process in the economy continues. Looking ahead, wage developments will mostly be dependent on labour supply, i.e. with unemployment rate eventually starting to fall, the wage growth will pick up too. In the long run, there are also risks for a situation of too low labour supply and unsustainable wage growth, as seen during boom-years, to repeat. Labour compensation per hour in selected countries, Manufacturing sector, 2008 (PPP-adjusted, USD) 0 10 20 30 40 Germany Netherlands Norway Austria France Finland Sweden Denmark Italy Spain Greece Slovak Rep Czech Rep Lithuania Estonia Source: OECD euro zone country Other production costs are also lower than in richer EU countries – this applies to transport costs (particularly compared with transport, e.g., from China, where production itself may be cheaper), energy (however, it is on the increase due to global processes, such as the opening of the electricity market and the closure of the Ignalina nuclear power station in Lithuania), land, water, services, etc. Consequently, the already low labour costs, together with the high availability of labour resources, should provide reasons for Nordic investors and producers to replace and/or expand their production in Estonia. Nevertheless, Estonia will have to move towards higher-value production in the long run, because the production cost during the convergence process will increase. It is also very important that the overall business climate continue to be favourable in order to attract more investments. The likelihood of euro adoption will increase confidence in Estonia, thus making it more attractive to possible investors, and will lower the risks for business partners. In addition, last year, during the low levels of production, the government strengthened several export support mechanisms and successfully increased the usage of several EU fund instruments to support companies. Other measures for boosting employment (e.g., “wage support” by the unemployment office, changes in social tax law to increase part-time employment), education (e.g., supporting the finishing of higher education by those who abandoned it during the boom years), and training are being implemented as well. R&D expenditure in selected countries, Business enterprise sector, 2008 (% of GDP) 0 0.5 1 1.5 2 2.5 3 Sweden Finland Germany EU27 Slov enia Czech Rep Estonia Slov akia Lithuania Poland Latvia Bulgaria Source: Eurostat Several researches have shown that the innovativeness of Estonian companies is very high and above EU average; even more, recent recession years have only strengthened that attitude. Although the R&D expenditure in Estonia is
- 5. The Estonian Economy Monthly newsletter from Swedbank’s Economic Research Department, continued Nr 1 • 19 May 2010 5 (5) below the EU average, it is among the highest in the CEE region (see chart). The government’s attitude towards supporting R&D in the business sector has been favourable so far and this needs to strengthen even more, as the manufacturing develops towards higher value-added production. A stable economic and political environment is also needed. Even though coalition governments have changed relatively frequently in Estonia, the overall economic policy has been the same starting from early 1990s – i.e., equal treatment of all business sectors and enterprises, diminishing differences in tax treatment, and the increasing application of simple procedures for businesses. We do not expect this approach to change, although minor shifts of course are possible depending on the coalition partners. Elina Allikalt Maris Lauri Swedbank Economic Research Department SE-105 34 Stockholm Phone +46-8-5859 1028 ek.sekr@swedbank.com www.swedbank.com Legally responsible publisher Cecilia Hermansson, +46-88-5859 1588 Maris Lauri +372 6 131 202 Elina Allikalt +372 6 131 989 Annika Paabut +372 6 135 440 Swedbank’s monthly newsletter The Estonian Economy is published as a service to our customers. We believe that we have used reliable sources and methods in the preparation of the analyses reported in this publication. However, we cannot guarantee the accuracy or completeness of the report and cannot be held responsible for any error or omission in the underlying material or its use. Readers are encouraged to base any (investment) decisions on other material as well. Neither Swedbank nor its employees may be held responsible for losses or damages, direct or indirect, owing to any errors or omissions in Swedbank’s monthly newsletter The Estonian Economy.