SlideShare une entreprise Scribd logo
1  sur  3
Télécharger pour lire hors ligne
The Lithuanian Economy
Monthly newsletter from Swedbank’s Economic Research Department
by Nerijus Mačiulis                                                                                       No. 01 • 31 January 2011


Industrial production is booming, but so are producer prices
             Lithuanian industrial production went up by 6.6% in 2010. Most of the increase may
              be attributed to the recovering manufacturing sector, which increased by 8.2% last
              year. Although industrial production is still behind its peak, it is expected to reach
              new highs this year.
             In 2010, manufacturing of paper products, chemicals, and pharmaceuticals
              recovered quickly, and exceeded pre-crisis levels. Manufacturing of wearing
              apparel and non-metallic mineral products, rubber and plastic products, and motor
              vehicles grew at the fastest pace, but still lagged behind boom-year levels.
             The producer price index in 2010 increased by more than 10%. The main factors
              behind this increase were rising prices of commodities and strong external demand.
              So far, this has had little impact on consumer prices in the local market;
              unfortunately, it is only a matter of time until the impact is felt.


Industrial production approaches pre-crisis                                 After a 14.6% decline in 2009, industrial production
level                                                                       recovered last year and is approaching the pre-
                                                                            crisis level. Compared with 2009, industry grew by
Industrial production in emerging markets is already                        6.6% in 2010, and manufacturing enjoyed a solid
some 15% above the pre-crisis levels reached in                             8.2% growth.
2008. However in euro zone countries and the US it
is still around 5% below peak levels. Industrial                            Growth of manufacturing, excluding refined
production in Lithuania, as in the latter countries, is                     petroleum products, was even faster in 2010,
still below its peak level (in 2010 it was 9.8% below                       reaching 10%. The continued contraction of the
the level reached in 2008); however, it is                                  supply of gas and electricity was slower (-5.7%)
approaching this level rapidly and should surpass it                        than in 2009 (-6.9%), and probably reflects higher
this year.                                                                  energy efficiency in manufacturing and saving in
                                                                            households. Furthermore, the biggest contraction in
Industrial production and manufacturing, 1Q 2005 – 4Q 2010                  the supply of gas and electricity was recorded in the
(Left scale: index, 2005=100; Right scale: LTL million)                     second and third quarters (10% and 12.9%,
 130                                                               18,000   respectively) — the period when one of the largest
 125                                                               16,000   factories in the chemical industry stopped most of
 120                                                               14,000   its operations.
                                                                   12,000
 115                                                                        The growth of industry in the last quarter of 2010
                                                                   10,000
 110                                                                        accelerated to 16.5% after 7.8% and 4.6%
                                                                   8,000
 105
                                                                            increases in the third and fourth quarters,
                                                                   6,000
                                                                            respectively. Manufacturing accelerated even faster
 100                                                               4,000
                                                                            and in the last quarter was 21% higher than a year
  95                                                               2,000    ago. The fourth-quarter growth of manufacturing,
  90                                                               0        excluding refined petroleum products, was a bit
       2005   2006       2007      2008      2009     2010                  more modest and was 19.9% higher than a year
                  Ref ined petroleum products
                  Electricity , gas, steam and air conditioning supply      ago.
                  Mining and quarry ing
                  Manuf acturing, except petroleum products
                  Manuf acturing, index (ls)                                Manufacturing growth to continue
                  Industry except construction, index (ls)
 Source: Statistics Lithuania                                               The performance of manufacturing in 2010,
                                                                            although strong, was uneven. Production of paper
                                                                            and paper products, pharmaceuticals, and chemical

                        Economic Research Department. Swedbank AB. SE-105 34 Stockholm. Phone +46-8-5859 1000
                                          E-mail: ek.sekr@swedbank.com www.swedbank.com
                                   Legally responsible publisher: Cecilia Hermansson, +46-8-5859 7720
                Nerijus Mačiulis + 370 5 258 2237. Lina Vrubliauskienė +370 5 258 2275. Ieva Vyšniauskaitė +370 5 258 2156.
The Lithuanian Economy

                                              Economic Research Department, Swedbank
                                                     Nr 01 • 31 January 2011


products exceeded or came close to previous                                 Manufacturing sectors, 1Q 2005 – 3Q 2010
highs. Some sectors, however, are still well below                          (Index, annual change, %)
their best years – including manufactures of motor                           160
vehicles, textiles, electrical equipment, and non-
                                                                             140
metallic mineral products. The speed of decline in
2009 and recovery in 2010 depended on the                                    120
orientation of the producers: in general, export-
oriented sectors overperformed those that are                                100
dependent on domestic demand.
                                                                              80

Leading manufacturing sectors, 1Q 2005 – 3Q 2010
                                                                              60
(Index, 2005=100)
 260                                                                          40
                                                                                   2005      2006       2007   2008      2009       2010
 240
                                                                                                                Rubber and plastic products
 220                                                                                                            Electrical equipment
                                                                                                                Furniture
 200                                                                                                            Food products
                                                                             Source: Statistics Lithuania       Wearing apparel
 180
 160
                                                                            Lithuania does not (and should not) aspire to be
 140
                                                                            recognized among leading industrial countries, but
 120
                                                                            in a medium term growth of the economy will have
 100
                                                                            to rely on manufacturing, which is expected to
  80                                                                        continue double digit growth in the first half of 2011.
       2005      2006       2007   2008       2009      2010
                                   Paper and paper products
                                                                            Producer prices reflect global
                                   Chemical products                        developments
                                   Pharmaceuticals
 Source: Statistics Lithuania      Machinery and equipment n.e.c.           After a16% spike in prices of industrial production in
                                                                            December, average annual producer price inflation
Other manufacturing sectors, such as rubber and                             in 2010 reached 10.3%. This is a significant
plastic products, electrical equipment, wood                                rebound after the 13.3% decline recorded in 2009.
products, furniture, and wearing apparel, have                              Prices of oil, gas, and other commodities in
grown at paces similar or exceeding those of the                            international markets are the main culprits, but a
boom years; however, due to a steep decline in                              strong pickup in demand for manufacturing
2009, they are still below their peak levels. For                           production also contributed to price increases. This
example, in the first three quarters of last year,                          is reflected in the differences in product prices for
manufacturing of transport vehicles, trailers, and                          Lithuanian and foreign consumers. The average
semitrailers increased by more than 80% compared                            annual increase in prices of industrial production
with the same period of 2009. However, the jump is                          sold in the Lithuanian market edged up by 4.1%,
mainly due to a very small comparative base.                                whereas prices of production sold in foreign
                                                                            markets increased by 16.9%.
One of the few sectors that continued to decline last
year was manufacturing of food products. Except                             Producer prices of food products sold in Lithuania
for manufacturing of refined petroleum products,                            declined by 0.3% (after declining by 4.6% in 2009),
which makes up one-third of total manufacturing                             whereas prices of food products sold in foreign
(but depends on a single company), the food sector                          markets rose by 12.3%. Probably, this partly
is still the largest and makes up one-sixth of total                        reflects the different structure of products sold in
manufacturing. The growth of the latter sector was                          Lithuania and abroad (higher added value), but also
muted due to weak domestic demand, on which it                              suggest that some of the price increases for local
heavily relies. However, producers of food and                              consumers were postponed due to very weak
beverages are slowly discovering new export                                 domestic demand. The same tendency is noticed in
markets and becoming less dependent on local                                other sectors; for example, last year prices of
consumers. Sometime in the not-too-distant future,                          rubber and plastic products in the local market
domestic demand for consumer staples will pick up                           declined by 3.4% but went up by 5.7% in foreign
and provide a strong boost for the manufacturing                            markets.
sector.
                                                                            A different tendency is noticed in producer prices of
                                                                            pharmaceuticals. Although these prices were
                                                                            increasing in both 2009 and 2010 (8.4% and 11.2%,


                                                                    2 (3)
The Lithuanian Economy

                                             Economic Research Department, Swedbank
                                                    Nr 01 • 31 January 2011


respectively), the burden was heavier for local than                    electrical and equipment, and motor vehicles,
foreign     consumers.      Producer      prices   of                   producer prices were still declining in 2010. This
pharmaceutical products and preparations in the                         reflects a positive consequence of increased
Lithuanian market went up by 14.4% last year,                           productivity through lower labour costs.
compared with only a 5.5% price increase of
products sold in foreign markets. Rising                                Manufacturing and consumer prices, Jan 2005 – Dec 2010
pharmaceutical prices during the recession                              (Annual change, %)
confirms the theory that this sector is immune to (or                    20
even enjoys) downturns. However the reasons
                                                                         15
behind the differences in producer prices of
pharmaceuticals sold in Lithuania and abroad may                         10
be a little more subtle. Since 2010, it has been
                                                                          5
forbidden for doctors to indicate a specific brand of
medicine on prescriptions – only the active                               0
chemical within it can be stated. This may have
                                                                          -5
caused some consumers of pharmaceuticals to
switch to cheaper generics (which are more often                         -10
produced in Lithuania) and have created a
favourable environment for producers to increase                         -15
                                                                               2005       2006       2007      2008        2009   2010
their prices.
                                                                                      Manuf acturing prices
                                                                                      Consumer prices, lagged 2 quarters
Prices of industrial production, Jan 2005 – Dec 2010                     Source:Statistics Lithuania and Swedbank calculations
(Annual change, %)
  40
                                                                        The strong pickup in producer prices poses two
  30                                                                    main threats. First, relatively more expensive
                                                                        production is less competitive abroad and will cause
  20                                                                    a slowdown in exports and manufacturing itself.
  10
                                                                        Even if competitiveness has not suffered so far,
                                                                        sectors operating at close to full capacity and
  0                                                                     experiencing some shortages of specific skilled
                                                                        labour may start raising wages, which will place
 -10
                                                                        more upward pressure on prices and dent
 -20                                                                    competitiveness. Second, higher producer prices in
                                                                        the Lithuanian market are already starting to be
 -30
                                                                        reflected in rising consumer prices. This does not
       2005    2006       2007   2008     2009      2010
                                        Total market
                                                                        bode well for lower-income households, which have
                                        Lithuanian market               not yet recovered from the hit on their disposable
 Source: Statistics Lithuania           Non Lithuanian market           income.

Average annual inflation of manufacturing prices in
2010 was 11.3%, after a 15.8% decline in 2009. Not                                                                           Nerijus Mačiulis
surprisingly, an above-average price increase was
recorded in manufacturing of refined petroleum
products, chemicals and chemical products, and
pharmaceuticals. However, in many sectors, such
as the manufacture of wearing apparel, machinery,

Swedbank
Economic Research Department                Swedbank’s monthly newsletter The Lithuanian Economy is published as a service to our
SE-105 34 Stockholm                         customers. We believe that we have used reliable sources and methods in the preparation
Phone +46-8-5859 1028                       of the analyses reported in this publication. However, we cannot guarantee the accuracy or
ek.sekr@swedbank.com                        completeness of the report and cannot be held responsible for any error or omission in the
www.swedbank.com                            underlying material or its use. Readers are encouraged to base any (investment) decisions
                                            on other material as well. Neither Swedbank nor its employees may be held responsible for
Legally responsible publisher
                                            losses or damages, direct or indirect, owing to any errors or omissions in Swedbank’s
Cecilia Hermansson, +46-8-5859 7720.
                                            monthly newsletter The Lithuanian Economy.
Nerijus Mačiulis, +370 5 2582237.
Lina Vrubliauskienė, +370 5 268 4275.


                                                                3 (3)

Contenu connexe

Tendances

Tendances (20)

The Lithuanian Economy - No 9, December 2, 2011
The Lithuanian Economy - No 9, December 2,  2011The Lithuanian Economy - No 9, December 2,  2011
The Lithuanian Economy - No 9, December 2, 2011
 
Arthur D. Little - Global Automotive Market Report March 2021
Arthur D. Little - Global Automotive Market Report March 2021Arthur D. Little - Global Automotive Market Report March 2021
Arthur D. Little - Global Automotive Market Report March 2021
 
The saturday economist manufacturing update October 2015
The saturday economist   manufacturing update October 2015The saturday economist   manufacturing update October 2015
The saturday economist manufacturing update October 2015
 
Future Watch: Asia trade deals
Future Watch: Asia trade dealsFuture Watch: Asia trade deals
Future Watch: Asia trade deals
 
Arthur D. Little Automotive Report May 2021
Arthur D. Little Automotive Report May 2021Arthur D. Little Automotive Report May 2021
Arthur D. Little Automotive Report May 2021
 
Before the Open June 19 2017
Before the Open June 19 2017Before the Open June 19 2017
Before the Open June 19 2017
 
03-Manufacturing-1.pdf
03-Manufacturing-1.pdf03-Manufacturing-1.pdf
03-Manufacturing-1.pdf
 
merged_document_8
merged_document_8merged_document_8
merged_document_8
 
Dr Dev Kambhampati | Recent Economic Trends in Manufacturing
Dr Dev Kambhampati | Recent Economic Trends in ManufacturingDr Dev Kambhampati | Recent Economic Trends in Manufacturing
Dr Dev Kambhampati | Recent Economic Trends in Manufacturing
 
Lithuanian Economy, No. 3 - April 10, 2012
Lithuanian Economy, No. 3 - April 10, 2012Lithuanian Economy, No. 3 - April 10, 2012
Lithuanian Economy, No. 3 - April 10, 2012
 
Promoting a stronger and more inclusive economy OECD Economic Survey Hungary ...
Promoting a stronger and more inclusive economy OECD Economic Survey Hungary ...Promoting a stronger and more inclusive economy OECD Economic Survey Hungary ...
Promoting a stronger and more inclusive economy OECD Economic Survey Hungary ...
 
Scania interim report january june 2017
Scania interim report january june 2017Scania interim report january june 2017
Scania interim report january june 2017
 
Globālās ekonomikas tendences
Globālās ekonomikas tendencesGlobālās ekonomikas tendences
Globālās ekonomikas tendences
 
The Saturday Economist, UK Economic Outlook June 2016
The Saturday Economist, UK Economic Outlook June 2016The Saturday Economist, UK Economic Outlook June 2016
The Saturday Economist, UK Economic Outlook June 2016
 
The Saturday Economist UK Economic Outlook December 2015
The Saturday Economist UK Economic Outlook December 2015The Saturday Economist UK Economic Outlook December 2015
The Saturday Economist UK Economic Outlook December 2015
 
Finnish technology industry, December 2021
Finnish technology industry, December 2021Finnish technology industry, December 2021
Finnish technology industry, December 2021
 
Prezentācija "Globālās ekonomikas tendences"
Prezentācija "Globālās ekonomikas tendences"Prezentācija "Globālās ekonomikas tendences"
Prezentācija "Globālās ekonomikas tendences"
 
Finnish technology industry, September 2017
Finnish technology industry, September 2017Finnish technology industry, September 2017
Finnish technology industry, September 2017
 
Russia Ukraine war impact on LV economy
Russia Ukraine war impact on LV economyRussia Ukraine war impact on LV economy
Russia Ukraine war impact on LV economy
 
[En] pdf
[En] pdf[En] pdf
[En] pdf
 

En vedette

En vedette (9)

The Lithuanian Economy, No.2, 9 March/2011
The Lithuanian Economy, No.2, 9 March/2011The Lithuanian Economy, No.2, 9 March/2011
The Lithuanian Economy, No.2, 9 March/2011
 
Swedbank Baltic Sea Analysis No. 29
Swedbank Baltic Sea Analysis No. 29Swedbank Baltic Sea Analysis No. 29
Swedbank Baltic Sea Analysis No. 29
 
Swedbanks Baltic Sea Region Report 2011
Swedbanks Baltic Sea Region Report 2011Swedbanks Baltic Sea Region Report 2011
Swedbanks Baltic Sea Region Report 2011
 
Swedbank's Global Economic Outlook, August 2011
Swedbank's Global Economic Outlook, August 2011Swedbank's Global Economic Outlook, August 2011
Swedbank's Global Economic Outlook, August 2011
 
Swedbanks delårsrapport för kvartal 2 2014
Swedbanks delårsrapport för kvartal 2 2014Swedbanks delårsrapport för kvartal 2 2014
Swedbanks delårsrapport för kvartal 2 2014
 
Kvartalsrapport andra kvartalet 2015
Kvartalsrapport andra kvartalet 2015Kvartalsrapport andra kvartalet 2015
Kvartalsrapport andra kvartalet 2015
 
Swedbanks bokslutskommuniké 2014
Swedbanks bokslutskommuniké 2014Swedbanks bokslutskommuniké 2014
Swedbanks bokslutskommuniké 2014
 
Energy & Commodities, No.4, 15 April 2011
Energy & Commodities, No.4, 15 April 2011 Energy & Commodities, No.4, 15 April 2011
Energy & Commodities, No.4, 15 April 2011
 
Swedbank Interim Report Q1, 2015
Swedbank Interim Report Q1, 2015Swedbank Interim Report Q1, 2015
Swedbank Interim Report Q1, 2015
 

Similaire à The Lithuanian Economy, No. 1/2011

Lithuanian Economy - No 1, January 4, 2012
Lithuanian Economy - No 1, January 4,  2012Lithuanian Economy - No 1, January 4,  2012
Lithuanian Economy - No 1, January 4, 2012
Swedbank
 
Lithuanian Economy, No. 4 - June 1,
Lithuanian Economy, No. 4 - June 1, Lithuanian Economy, No. 4 - June 1,
Lithuanian Economy, No. 4 - June 1,
Swedbank
 
The Lithuanian Economy - No 6, September 2, 2011
The Lithuanian Economy - No 6, September 2,  2011The Lithuanian Economy - No 6, September 2,  2011
The Lithuanian Economy - No 6, September 2, 2011
Swedbank
 
2008:Botswana – Recent Economic Developments and Prospects
2008:Botswana – Recent Economic Developments and Prospects2008:Botswana – Recent Economic Developments and Prospects
2008:Botswana – Recent Economic Developments and Prospects
econsultbw
 
Miroslav Strokendl: Conference on Foreign Investments 23rd November
Miroslav Strokendl: Conference on Foreign Investments 23rd November Miroslav Strokendl: Conference on Foreign Investments 23rd November
Miroslav Strokendl: Conference on Foreign Investments 23rd November
Italoblog
 
The Estonian Economy, No. 3 - August 14, 2012
The Estonian Economy, No. 3 - August 14, 2012The Estonian Economy, No. 3 - August 14, 2012
The Estonian Economy, No. 3 - August 14, 2012
Swedbank
 

Similaire à The Lithuanian Economy, No. 1/2011 (20)

Flash comment: Estonia - December 9, 2011
Flash comment: Estonia - December 9, 2011Flash comment: Estonia - December 9, 2011
Flash comment: Estonia - December 9, 2011
 
Lithuanian Economy, No. 2 - March 9, 2012
Lithuanian Economy, No. 2 - March 9,  2012Lithuanian Economy, No. 2 - March 9,  2012
Lithuanian Economy, No. 2 - March 9, 2012
 
Lithuanian Economy - No 1, January 4, 2012
Lithuanian Economy - No 1, January 4,  2012Lithuanian Economy - No 1, January 4,  2012
Lithuanian Economy - No 1, January 4, 2012
 
Flash comment: Estonia - February 10, 2012
Flash comment: Estonia - February 10, 2012Flash comment: Estonia - February 10, 2012
Flash comment: Estonia - February 10, 2012
 
The Estonian Economy, No 7, November 28, 2011
The Estonian Economy, No 7, November 28, 2011The Estonian Economy, No 7, November 28, 2011
The Estonian Economy, No 7, November 28, 2011
 
The Estonian Economy, No. 1 - June 21, 2012
The Estonian Economy, No. 1 - June 21, 2012The Estonian Economy, No. 1 - June 21, 2012
The Estonian Economy, No. 1 - June 21, 2012
 
Lithuanian Economy, No. 4 - June 1,
Lithuanian Economy, No. 4 - June 1, Lithuanian Economy, No. 4 - June 1,
Lithuanian Economy, No. 4 - June 1,
 
Business at a glance may 2018 Circulo de Empresarios
Business at  a glance may 2018 Circulo de EmpresariosBusiness at  a glance may 2018 Circulo de Empresarios
Business at a glance may 2018 Circulo de Empresarios
 
growth and_investment
growth and_investmentgrowth and_investment
growth and_investment
 
Swedbank Baltic Sea Analysis No. 27
Swedbank Baltic Sea Analysis No. 27Swedbank Baltic Sea Analysis No. 27
Swedbank Baltic Sea Analysis No. 27
 
The Lithuanian Economy - No 7, October 4, 2011
The Lithuanian Economy - No 7, October 4,  2011The Lithuanian Economy - No 7, October 4,  2011
The Lithuanian Economy - No 7, October 4, 2011
 
Flash comment: Estonia - September 7, 2012
Flash comment: Estonia - September 7, 2012Flash comment: Estonia - September 7, 2012
Flash comment: Estonia - September 7, 2012
 
The Lithuanian Economy - 2010, May
The Lithuanian Economy - 2010, MayThe Lithuanian Economy - 2010, May
The Lithuanian Economy - 2010, May
 
The Lithuanian Economy - 2010, May
The Lithuanian Economy - 2010, MayThe Lithuanian Economy - 2010, May
The Lithuanian Economy - 2010, May
 
The Lithuanian Economy - No 6, September 2, 2011
The Lithuanian Economy - No 6, September 2,  2011The Lithuanian Economy - No 6, September 2,  2011
The Lithuanian Economy - No 6, September 2, 2011
 
2008:Botswana – Recent Economic Developments and Prospects
2008:Botswana – Recent Economic Developments and Prospects2008:Botswana – Recent Economic Developments and Prospects
2008:Botswana – Recent Economic Developments and Prospects
 
Miroslav Strokendl: Conference on Foreign Investments 23rd November
Miroslav Strokendl: Conference on Foreign Investments 23rd November Miroslav Strokendl: Conference on Foreign Investments 23rd November
Miroslav Strokendl: Conference on Foreign Investments 23rd November
 
Lyes Boudiaf
Lyes Boudiaf Lyes Boudiaf
Lyes Boudiaf
 
The Estonian Economy, No. 3 - August 14, 2012
The Estonian Economy, No. 3 - August 14, 2012The Estonian Economy, No. 3 - August 14, 2012
The Estonian Economy, No. 3 - August 14, 2012
 
Flash comment: Estonia - August 14, 2012
Flash comment: Estonia - August 14, 2012Flash comment: Estonia - August 14, 2012
Flash comment: Estonia - August 14, 2012
 

Plus de Swedbank

Plus de Swedbank (20)

Swedbank corporate presentation April 25 2017
Swedbank corporate presentation April 25 2017Swedbank corporate presentation April 25 2017
Swedbank corporate presentation April 25 2017
 
Swedbank foretagspresentation 25 april 2017
Swedbank foretagspresentation 25 april 2017Swedbank foretagspresentation 25 april 2017
Swedbank foretagspresentation 25 april 2017
 
Delårsrapport kv1 2017
Delårsrapport kv1 2017Delårsrapport kv1 2017
Delårsrapport kv1 2017
 
Interim report q1 2017
Interim report q1 2017Interim report q1 2017
Interim report q1 2017
 
Year end report 2016
Year end report 2016Year end report 2016
Year end report 2016
 
Bokslutskommuniké 2016
Bokslutskommuniké 2016Bokslutskommuniké 2016
Bokslutskommuniké 2016
 
Swedbank företagspresentation, 2 februari 2017
Swedbank företagspresentation, 2 februari 2017Swedbank företagspresentation, 2 februari 2017
Swedbank företagspresentation, 2 februari 2017
 
Swedbank corporate presentation, February 2 2017
Swedbank corporate presentation, February 2 2017Swedbank corporate presentation, February 2 2017
Swedbank corporate presentation, February 2 2017
 
Swedbank Corporate Presentation, October 25 2016
Swedbank Corporate Presentation, October 25 2016Swedbank Corporate Presentation, October 25 2016
Swedbank Corporate Presentation, October 25 2016
 
Swedbank företagspresentation, 25 oktober 2016
Swedbank företagspresentation, 25 oktober 2016Swedbank företagspresentation, 25 oktober 2016
Swedbank företagspresentation, 25 oktober 2016
 
Swedbank Corporate Presentation, June 30 2016
Swedbank Corporate Presentation, June 30 2016Swedbank Corporate Presentation, June 30 2016
Swedbank Corporate Presentation, June 30 2016
 
Swedbank företagspresentation, 30 juni 2016
Swedbank företagspresentation, 30 juni 2016Swedbank företagspresentation, 30 juni 2016
Swedbank företagspresentation, 30 juni 2016
 
Swedbank corporate presentation Q1, 2016
Swedbank corporate presentation Q1, 2016Swedbank corporate presentation Q1, 2016
Swedbank corporate presentation Q1, 2016
 
Swedbank företagspresentation kvartal 1, 2016.
Swedbank företagspresentation kvartal 1, 2016.Swedbank företagspresentation kvartal 1, 2016.
Swedbank företagspresentation kvartal 1, 2016.
 
Swedbank corporate presentation Q4, 2015
Swedbank corporate presentation Q4, 2015Swedbank corporate presentation Q4, 2015
Swedbank corporate presentation Q4, 2015
 
Swedbank företagspresentation kvartal 4,2015
Swedbank företagspresentation kvartal 4,2015Swedbank företagspresentation kvartal 4,2015
Swedbank företagspresentation kvartal 4,2015
 
Year end report 2015
Year end report 2015Year end report 2015
Year end report 2015
 
Bokslutskommuniké 2015
Bokslutskommuniké 2015Bokslutskommuniké 2015
Bokslutskommuniké 2015
 
Swedbank Företagspresentation, September 2015
Swedbank Företagspresentation, September 2015Swedbank Företagspresentation, September 2015
Swedbank Företagspresentation, September 2015
 
Swedbank Corporate Presentation, September 2015
Swedbank Corporate Presentation, September 2015Swedbank Corporate Presentation, September 2015
Swedbank Corporate Presentation, September 2015
 

The Lithuanian Economy, No. 1/2011

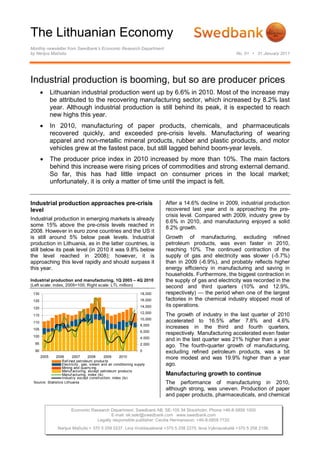
  • 1. The Lithuanian Economy Monthly newsletter from Swedbank’s Economic Research Department by Nerijus Mačiulis No. 01 • 31 January 2011 Industrial production is booming, but so are producer prices  Lithuanian industrial production went up by 6.6% in 2010. Most of the increase may be attributed to the recovering manufacturing sector, which increased by 8.2% last year. Although industrial production is still behind its peak, it is expected to reach new highs this year.  In 2010, manufacturing of paper products, chemicals, and pharmaceuticals recovered quickly, and exceeded pre-crisis levels. Manufacturing of wearing apparel and non-metallic mineral products, rubber and plastic products, and motor vehicles grew at the fastest pace, but still lagged behind boom-year levels.  The producer price index in 2010 increased by more than 10%. The main factors behind this increase were rising prices of commodities and strong external demand. So far, this has had little impact on consumer prices in the local market; unfortunately, it is only a matter of time until the impact is felt. Industrial production approaches pre-crisis After a 14.6% decline in 2009, industrial production level recovered last year and is approaching the pre- crisis level. Compared with 2009, industry grew by Industrial production in emerging markets is already 6.6% in 2010, and manufacturing enjoyed a solid some 15% above the pre-crisis levels reached in 8.2% growth. 2008. However in euro zone countries and the US it is still around 5% below peak levels. Industrial Growth of manufacturing, excluding refined production in Lithuania, as in the latter countries, is petroleum products, was even faster in 2010, still below its peak level (in 2010 it was 9.8% below reaching 10%. The continued contraction of the the level reached in 2008); however, it is supply of gas and electricity was slower (-5.7%) approaching this level rapidly and should surpass it than in 2009 (-6.9%), and probably reflects higher this year. energy efficiency in manufacturing and saving in households. Furthermore, the biggest contraction in Industrial production and manufacturing, 1Q 2005 – 4Q 2010 the supply of gas and electricity was recorded in the (Left scale: index, 2005=100; Right scale: LTL million) second and third quarters (10% and 12.9%, 130 18,000 respectively) — the period when one of the largest 125 16,000 factories in the chemical industry stopped most of 120 14,000 its operations. 12,000 115 The growth of industry in the last quarter of 2010 10,000 110 accelerated to 16.5% after 7.8% and 4.6% 8,000 105 increases in the third and fourth quarters, 6,000 respectively. Manufacturing accelerated even faster 100 4,000 and in the last quarter was 21% higher than a year 95 2,000 ago. The fourth-quarter growth of manufacturing, 90 0 excluding refined petroleum products, was a bit 2005 2006 2007 2008 2009 2010 more modest and was 19.9% higher than a year Ref ined petroleum products Electricity , gas, steam and air conditioning supply ago. Mining and quarry ing Manuf acturing, except petroleum products Manuf acturing, index (ls) Manufacturing growth to continue Industry except construction, index (ls) Source: Statistics Lithuania The performance of manufacturing in 2010, although strong, was uneven. Production of paper and paper products, pharmaceuticals, and chemical Economic Research Department. Swedbank AB. SE-105 34 Stockholm. Phone +46-8-5859 1000 E-mail: ek.sekr@swedbank.com www.swedbank.com Legally responsible publisher: Cecilia Hermansson, +46-8-5859 7720 Nerijus Mačiulis + 370 5 258 2237. Lina Vrubliauskienė +370 5 258 2275. Ieva Vyšniauskaitė +370 5 258 2156.
  • 2. The Lithuanian Economy Economic Research Department, Swedbank Nr 01 • 31 January 2011 products exceeded or came close to previous Manufacturing sectors, 1Q 2005 – 3Q 2010 highs. Some sectors, however, are still well below (Index, annual change, %) their best years – including manufactures of motor 160 vehicles, textiles, electrical equipment, and non- 140 metallic mineral products. The speed of decline in 2009 and recovery in 2010 depended on the 120 orientation of the producers: in general, export- oriented sectors overperformed those that are 100 dependent on domestic demand. 80 Leading manufacturing sectors, 1Q 2005 – 3Q 2010 60 (Index, 2005=100) 260 40 2005 2006 2007 2008 2009 2010 240 Rubber and plastic products 220 Electrical equipment Furniture 200 Food products Source: Statistics Lithuania Wearing apparel 180 160 Lithuania does not (and should not) aspire to be 140 recognized among leading industrial countries, but 120 in a medium term growth of the economy will have 100 to rely on manufacturing, which is expected to 80 continue double digit growth in the first half of 2011. 2005 2006 2007 2008 2009 2010 Paper and paper products Producer prices reflect global Chemical products developments Pharmaceuticals Source: Statistics Lithuania Machinery and equipment n.e.c. After a16% spike in prices of industrial production in December, average annual producer price inflation Other manufacturing sectors, such as rubber and in 2010 reached 10.3%. This is a significant plastic products, electrical equipment, wood rebound after the 13.3% decline recorded in 2009. products, furniture, and wearing apparel, have Prices of oil, gas, and other commodities in grown at paces similar or exceeding those of the international markets are the main culprits, but a boom years; however, due to a steep decline in strong pickup in demand for manufacturing 2009, they are still below their peak levels. For production also contributed to price increases. This example, in the first three quarters of last year, is reflected in the differences in product prices for manufacturing of transport vehicles, trailers, and Lithuanian and foreign consumers. The average semitrailers increased by more than 80% compared annual increase in prices of industrial production with the same period of 2009. However, the jump is sold in the Lithuanian market edged up by 4.1%, mainly due to a very small comparative base. whereas prices of production sold in foreign markets increased by 16.9%. One of the few sectors that continued to decline last year was manufacturing of food products. Except Producer prices of food products sold in Lithuania for manufacturing of refined petroleum products, declined by 0.3% (after declining by 4.6% in 2009), which makes up one-third of total manufacturing whereas prices of food products sold in foreign (but depends on a single company), the food sector markets rose by 12.3%. Probably, this partly is still the largest and makes up one-sixth of total reflects the different structure of products sold in manufacturing. The growth of the latter sector was Lithuania and abroad (higher added value), but also muted due to weak domestic demand, on which it suggest that some of the price increases for local heavily relies. However, producers of food and consumers were postponed due to very weak beverages are slowly discovering new export domestic demand. The same tendency is noticed in markets and becoming less dependent on local other sectors; for example, last year prices of consumers. Sometime in the not-too-distant future, rubber and plastic products in the local market domestic demand for consumer staples will pick up declined by 3.4% but went up by 5.7% in foreign and provide a strong boost for the manufacturing markets. sector. A different tendency is noticed in producer prices of pharmaceuticals. Although these prices were increasing in both 2009 and 2010 (8.4% and 11.2%, 2 (3)
  • 3. The Lithuanian Economy Economic Research Department, Swedbank Nr 01 • 31 January 2011 respectively), the burden was heavier for local than electrical and equipment, and motor vehicles, foreign consumers. Producer prices of producer prices were still declining in 2010. This pharmaceutical products and preparations in the reflects a positive consequence of increased Lithuanian market went up by 14.4% last year, productivity through lower labour costs. compared with only a 5.5% price increase of products sold in foreign markets. Rising Manufacturing and consumer prices, Jan 2005 – Dec 2010 pharmaceutical prices during the recession (Annual change, %) confirms the theory that this sector is immune to (or 20 even enjoys) downturns. However the reasons 15 behind the differences in producer prices of pharmaceuticals sold in Lithuania and abroad may 10 be a little more subtle. Since 2010, it has been 5 forbidden for doctors to indicate a specific brand of medicine on prescriptions – only the active 0 chemical within it can be stated. This may have -5 caused some consumers of pharmaceuticals to switch to cheaper generics (which are more often -10 produced in Lithuania) and have created a favourable environment for producers to increase -15 2005 2006 2007 2008 2009 2010 their prices. Manuf acturing prices Consumer prices, lagged 2 quarters Prices of industrial production, Jan 2005 – Dec 2010 Source:Statistics Lithuania and Swedbank calculations (Annual change, %) 40 The strong pickup in producer prices poses two 30 main threats. First, relatively more expensive production is less competitive abroad and will cause 20 a slowdown in exports and manufacturing itself. 10 Even if competitiveness has not suffered so far, sectors operating at close to full capacity and 0 experiencing some shortages of specific skilled labour may start raising wages, which will place -10 more upward pressure on prices and dent -20 competitiveness. Second, higher producer prices in the Lithuanian market are already starting to be -30 reflected in rising consumer prices. This does not 2005 2006 2007 2008 2009 2010 Total market bode well for lower-income households, which have Lithuanian market not yet recovered from the hit on their disposable Source: Statistics Lithuania Non Lithuanian market income. Average annual inflation of manufacturing prices in 2010 was 11.3%, after a 15.8% decline in 2009. Not Nerijus Mačiulis surprisingly, an above-average price increase was recorded in manufacturing of refined petroleum products, chemicals and chemical products, and pharmaceuticals. However, in many sectors, such as the manufacture of wearing apparel, machinery, Swedbank Economic Research Department Swedbank’s monthly newsletter The Lithuanian Economy is published as a service to our SE-105 34 Stockholm customers. We believe that we have used reliable sources and methods in the preparation Phone +46-8-5859 1028 of the analyses reported in this publication. However, we cannot guarantee the accuracy or ek.sekr@swedbank.com completeness of the report and cannot be held responsible for any error or omission in the www.swedbank.com underlying material or its use. Readers are encouraged to base any (investment) decisions on other material as well. Neither Swedbank nor its employees may be held responsible for Legally responsible publisher losses or damages, direct or indirect, owing to any errors or omissions in Swedbank’s Cecilia Hermansson, +46-8-5859 7720. monthly newsletter The Lithuanian Economy. Nerijus Mačiulis, +370 5 2582237. Lina Vrubliauskienė, +370 5 268 4275. 3 (3)