Energy & Commodities, No. 5 - May 11, 2012
•
0 j'aime•261 vues

Energy & Commodities, No. 5 - May 11, 2012: Lower commodity prices as the economic recovery loses speed

Recommandé
Recommandé
Contenu connexe
Tendances
Tendances (20)
En vedette
En vedette (8)
Similaire à Energy & Commodities, No. 5 - May 11, 2012
Similaire à Energy & Commodities, No. 5 - May 11, 2012 (19)
Plus de Swedbank
Plus de Swedbank (20)
Dernier
Dernier (20)
Energy & Commodities, No. 5 - May 11, 2012
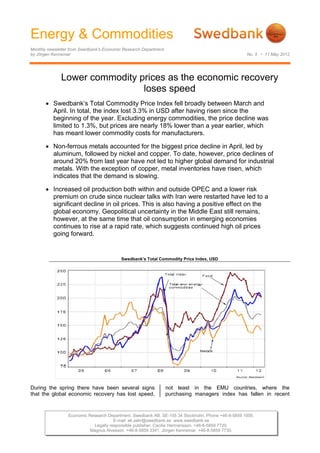
- 1. Energy & Commodities Monthly newsletter from Swedbank’s Economic Research Department by Jörgen Kennemar No. 5 • 11 May 2012 Lower commodity prices as the economic recovery loses speed Swedbank’s Total Commodity Price Index fell broadly between March and April. In total, the index lost 3.3% in USD after having risen since the beginning of the year. Excluding energy commodities, the price decline was limited to 1.3%, but prices are nearly 18% lower than a year earlier, which has meant lower commodity costs for manufacturers. Non-ferrous metals accounted for the biggest price decline in April, led by aluminum, followed by nickel and copper. To date, however, price declines of around 20% from last year have not led to higher global demand for industrial metals. With the exception of copper, metal inventories have risen, which indicates that the demand is slowing. Increased oil production both within and outside OPEC and a lower risk premium on crude since nuclear talks with Iran were restarted have led to a significant decline in oil prices. This is also having a positive effect on the global economy. Geopolitical uncertainty in the Middle East still remains, however, at the same time that oil consumption in emerging economies continues to rise at a rapid rate, which suggests continued high oil prices going forward. Swedbank’s Total Commodity Price Index, USD During the spring there have been several signs not least in the EMU countries, where the that the global economic recovery has lost speed, purchasing managers index has fallen in recent Economic Research Department. Swedbank AB. SE-105 34 Stockholm. Phone +46-8-5859 1000. E-mail: ek.sekr@swedbank.se www.swedbank.se Legally responsible publisher: Cecilia Hermansson. +46-8-5859 7720. Magnus Alvesson. +46-8-5859 3341. Jörgen Kennemar. +46-8-5859 7730.
- 2. Energy & Commodities Monthly newsletter from Swedbank’s Economic Research Department, continued No. 5 • 11 May 2012 months. In the US, industrial activity continues to For copper inventories, the opposite has been true. strengthen, while the labor and housing markets Based on data from the London Metall Exchange remain weak. Falling bond yields may also indicate (LME), inventories outside China have reached their an uncertain economic outlook. Investor interest in lowest level in over three years, not least due to government bonds is growing at the expense of declining production in South America, which commodity-related investments. accounts for one third of global copper extraction. The cyclical commodity markets fell broadly in April. Despite tight supply conditions, prices have been For the first time since December Swedbank’s Total pushed lower. This is probably more the result of an Commodity Price Index declined. Between March expectation of lower Chinese demand due to high and April the index lost 3.3% in both USD and SEK. copper inventories held by Chinese companies. At The biggest price drop was for industrial metals, the same time the Chinese housing market is which fell by 4.3% on average, which means that gradually slowing, due to which imports of copper the price index for non-ferrous metals is about 20% are expected to be weaker in the months ahead. lower in USD year-on-year. Of the metal From a fundamental perspective, however, we feel commodities, aluminum and nickel posted the that copper has a greater price upside than biggest price declines at 6.2% and 4.4%, aluminum, zinc and nickel. In addition to tight respectively, measured in USD. The price decline supplies, copper consumption per capita in for copper was limited to 2.3%, followed by zinc (- emerging economies is low compared with mature 1.8%). Lead prices held their ground, with price industrial countries. levels remaining largely unchanged compared with the previous month. Price trend for non-ferrous metals 2011-2012, USD The market for basic metals is being affected at the same time by growing inventories, an indication that global demand is slowing. The biggest inventory increases have been for zinc and nickel, which is probably the result of a slower increase in steel production. The slowdown is from record levels, however, with global steel production having passed 1,527 million tons last year, about half of which China accounted for. This year the increase in global steel production is expected to slow to just over 3.5%, compared with 5.6% last year, especially as China’s expansion slows. Metal inventories, millions of tons Iron ore and scrap prices are trending slightly higher after a substantial decline during the second half of 2011. Since the beginning of the year the price of iron ore has risen by 4-5% in USD, though it remains nearly 14% lower than the same period last year, when prices reached record-high levels (just over USD 180 dollar a ton). In SEK, the price is between 5-7% lower than last year's levels. We expect that weaker growth in global steel production, especially in China, will reduce demand for iron ore products in 2012 and affect prices. At the same time per capita steel consumption has reached the same level in China as in several Western European countries. In 2010 per capita consumption was 427 kg in China, exceeding the EU average of 327 kg. Of course, it is natural that steel consumption is higher during a build-up stage 2 (5)
- 3. Energy & Commodities Monthly newsletter from Swedbank’s Economic Research Department, continued No. 5 • 11 May 2012 before eventually slowing when purchasing power Japan, which have taken measures to reduce or and service production increase. In countries such stop oil imports from Iran. The painful economic as India and Indonesia, with a combined population sanctions that are scheduled to take effect on July 1 of around 1.5 billion, steel consumption is could be eased, however, if the political talks make significantly lower (under 60 kg per capita), i.e., progress. there is major long-term growth potential here if the A major increase in oil production in Saudi Arabia slowdown in Chinese demand proves long-lasting. and other oil producers during the first quarter has led to higher supplies. Among producers, Saudi Steel production (% change) and share of global Arabia still has the largest production potential. production by country Since the beginning of the year its crude production Share (%) 2011 2012 2013 has risen by 6% to 11 million barrels a day, the EU-27 11,1 5,4 -1,2 3,3 highest level in over 30 years. Expectations of NAFTA 8,8 9,1 5,2 5,1 further production increases from Saudi Arabia CIS 3,9 12,1 4,1 5,1 have received support from official statements that China 55,1 6,2 4,0 4,0 the current price level could hurt the global World 5,6 3,6 4,5 economic recovery. This policy is opposed by Source: Worldsteel several other OPEC countries, however, which means that tension within the organization could increase. The OPEC summit in June could be a test Oil prices reverse course of how unified the cartel really is. The index for energy commodities, which includes Growing oil inventories in OECD countries suggest crude and coal, fell by 4.3% in April in USD after that the balance between supply and demand has having steadily risen since late last year. At the time improved since last winter. Inventories are rising in of writing the price of Brent crude was fluctuating the US, among other places. Weaker growth around USD 112 a barrel after having peaked at numbers from emerging economies, which account USD 130 in early March. This could also have a for most of the increase in global consumption, are positive effect on the global economy, although the keeping the price of oil in check. A bigger slowdown risk of higher oil prices still remains. in China could have major implications for prices. Due to continued geopolitical uncertainty in the Crude oil prices and Global PMI Middle East and strong oil imports from emerging economies, we are maintaining our average oil price forecast of USD 119 a barrel in 2012, which is also the average price so far this year. This means that the prices should trend higher than today's level in the second half of 2012 as global growth gradually strengthens. On the other hand, another fiscal crisis in the EMU and significantly weaker growth in China could push the price lower from today's levels. Lower food prices, but from high levels The price decline for food commodities is continuing, although the correction is from last year's high levels. In April Swedbank’s commodity price index for foods fell by 1.4% compared with March, which means that it is 18% lower year-on- year. Tropical beverages and tobacco have had the weakest trends this year. For oilseeds, including soybeans, prices have risen by no less than 26% on What is the cause of the major price drop? The risk average since the start of 2012. Increased global premium on crude, which had risen substantially at demand, especially from China, and supply the start of 2011, has fallen in recent weeks ahead shortages have driven up prices to the highest of the upcoming nuclear talks with Iran. This has levels since early 2011. The price index for grain, probably also reduced the risk that Iran will act on which reached record highs during the first half of its threats to close the Strait of Hormuz, where 20- 2011, is not yet showing any signs of turning higher 30% of global oil shipments pass. At the same time and remains lower than a year ago. There are Iran is under pressure from the EU, the US and variations between different types of grain, 3 (5)
- 4. Energy & Commodities Monthly newsletter from Swedbank’s Economic Research Department, continued No. 5 • 11 May 2012 however, with barley having risen by 7-8%, while Fluctuating food prices in recent years indicate that wheat prices have fallen by 5% in USD. changes in supply or demand can have a major impact on prices. A growing population, increasing Price trend for food commodities purchasing power and changing eating habits are also increasing the need for efficient agricultural production. Our forecast of a recovery in food prices remains firm, although the trend during the first four months of 2012 has been slightly weaker than expected. Among agricultural commodities, pulp has seen the biggest price improvement. In April it rose by 1.5% to USD 850 a ton after having reached USD 829 in early 2012. The price trend for cotton has been exceptional. Between the third quarter of 2010 and the first quarter of 2011 it more than doubled, from USD 80 a pound to USD 200, due to global supply shortages. Increased supplies over the course of 2011 quickly sent prices lower, however, back to the levels of over two years ago. Jörgen Kennemar 4 (5)
- 5. Energy & Commodities Monthly newsletter from Swedbank’s Economic Research Department, continued No. 5 • 11 May 2012 Swedbank Commodity Index - US$ - Swedbank Commodity Index - SKr - Basis 2000 = 1oo 14/ 05/ 12 Basis 2000 = 1oo 14/ 05/ 12 2.2012 3.2012 4.2012 2.2012 3.2012 4.2012 T otal index 385.4 397.9 384.8 T otal index 279.0 290.6 282.3 Per cent change month ago 4.5 3.2 -3.3 Per cent change month ago 1.6 4.2 -2.9 Per cent change year ago 12.9 8.7 -1.1 Per cent change year ago 17.0 15.2 7.7 T otal index exclusive energy 276.9 276.5 273.0 T otal index exclusive energy 200.4 202.0 200.3 Per cent change month ago 2.0 -0.1 -1.3 Per cent change month ago -0.9 0.8 -0.8 Per cent change year ago -13.2 -12.3 -17.6 Per cent change year ago -10.1 -7.1 -10.3 Food, tropical beverages 266.1 261.5 257.7 Food, tropical beverages 192.6 191.0 189.1 Per cent change month ago 0.5 -1.7 -1.4 Per cent change month ago -2.3 -0.8 -1.0 Per cent change year ago -16.2 -16.3 -17.9 Per cent change year ago -13.2 -11.2 -10.6 Cereals 277.6 280.1 272.3 Cereals 201.0 204.6 199.8 Per cent change month ago 0.8 0.9 -2.8 Per cent change month ago -2.0 1.8 -2.4 Per cent change year ago -11.7 -7.8 -16.2 Per cent change year ago -8.6 -2.3 -8.8 T ropical beverages and tobacco 274.2 260.1 248.3 T ropical beverages and tobacco 198.5 190.0 182.2 Per cent change month ago -1.0 -5.1 -4.5 Per cent change month ago -3.8 -4.3 -4.1 Per cent change year ago -18.8 -22.8 -25.6 Per cent change year ago -15.9 -18.2 -19.0 Coffee 182.1 167.6 160.4 Coffee 131.8 122.4 117.7 Per cent change month ago -3.5 -8.0 -4.3 Per cent change month ago -6.2 -7.1 -3.9 Per cent change year ago -15.7 -25.3 -30.4 Per cent change year ago -12.6 -20.8 -24.3 Oilseeds and oil 241.0 252.3 268.6 Oilseeds and oil 174.5 184.3 197.1 Per cent change month ago 4.2 4.7 6.5 Per cent change month ago 1.3 5.6 6.9 Per cent change year ago -12.7 -4.5 2.1 Per cent change year ago -9.6 1.3 11.1 Industrial raw materials 280.0 280.9 277.4 Industrial raw materials 202.7 205.2 203.5 Per cent change month ago 2.4 0.3 -1.2 Per cent change month ago -0.5 1.2 -0.8 Per cent change year ago -12.3 -11.2 -17.6 Per cent change year ago -9.2 -5.9 -10.3 Agricultural raw materials 171.6 173.7 174.6 Agricultural raw materials 124.2 126.9 128.1 Per cent change month ago 2.9 1.2 0.5 Per cent change month ago 0.0 2.1 1.0 Per cent change year ago -17.1 -14.4 -16.9 Per cent change year ago -14.1 -9.3 -9.5 Cotton 92.0 89.8 90.4 Cotton 66.6 65.6 66.3 Per cent change month ago -4.5 -2.4 0.7 Per cent change month ago -7.1 -1.5 1.2 Per cent change year ago -50.5 -55.3 -53.2 Per cent change year ago -48.7 -52.6 -49.0 Softwood 131.4 133.4 135.6 Softwood 95.1 97.4 99.5 Per cent change month ago 1.3 1.5 1.6 Per cent change month ago -1.5 2.4 2.1 Per cent change year ago -9.1 -9.1 -10.6 Per cent change year ago -5.9 -3.7 -2.7 W oodpulp 829.0 837.0 849.6 W oodpulp 600.1 611.4 623.3 Per cent change month ago -0.3 1.0 1.5 Per cent change month ago -3.1 1.9 2.0 Per cent change year ago -12.7 -13.2 -14.4 Per cent change year ago -9.5 -8.0 -6.8 Non-ferrous metals 253.6 249.9 239.2 Non-ferrous metals 183.6 182.5 175.5 Per cent change month ago 4.1 -1.5 -4.3 Per cent change month ago 1.2 -0.6 -3.9 Per cent change year ago -15.6 -15.7 -20.8 Per cent change year ago -12.5 -10.6 -13.8 Copper 8415.2 8456.6 8258.8 Copper 6091.9 6177.0 6059.4 Per cent change month ago 4.9 0.5 -2.3 Per cent change month ago 2.0 1.4 -1.9 Per cent change year ago -14.7 -11.3 -12.9 Per cent change year ago -11.7 -5.9 -5.1 Aluminium 2202.8 2182.6 2046.7 Aluminium 1594.6 1594.2 1501.7 Per cent change month ago 3.1 -0.9 -6.2 Per cent change month ago 0.3 0.0 -5.8 Per cent change year ago -12.2 -14.5 -23.1 Per cent change year ago -9.0 -9.4 -16.3 Lead 2124.9 2061.0 2062.4 Lead 1538.2 1505.4 1513.2 Per cent change month ago 1.7 -3.0 0.1 Per cent change month ago -1.1 -2.1 0.5 Per cent change year ago -17.8 -21.4 -24.4 Per cent change year ago -14.9 -16.7 -17.7 Z inc 2056.4 2034.2 1997.0 Z inc 1488.7 1485.9 1465.2 Per cent change month ago 4.2 -1.1 -1.8 Per cent change month ago 1.3 -0.2 -1.4 Per cent change year ago -16.6 -13.4 -15.5 Per cent change year ago -13.6 -8.2 -8.0 Nickel 20446.1 18705.6 17877.8 Nickel 14801.2 13663.2 13116.9 Per cent change month ago 3.5 -8.5 -4.4 Per cent change month ago 0.7 -7.7 -4.0 Per cent change year ago -27.6 -30.2 -32.1 Per cent change year ago -25.0 -26.0 -26.1 Iron ore, steel scrap 631.5 642.1 647.7 Iron ore, steel scrap 457.2 469.0 475.2 Per cent change month ago 0.2 1.7 0.9 Per cent change month ago -2.6 2.6 1.3 Per cent change year ago -4.3 -3.1 -14.5 Per cent change year ago -0.9 2.7 -6.9 Energy raw materials 433.6 451.7 434.3 Energy raw materials 313.9 330.0 318.7 Per cent change month ago 5.3 4.2 -3.8 Per cent change month ago 2.4 5.1 -3.4 Per cent change year ago 23.4 16.2 4.8 Per cent change year ago 27.9 23.2 14.1 Coking coal 437.8 406.5 393.8 Coking coal 316.9 296.9 288.9 Per cent change month ago -0.2 -7.1 -3.1 Per cent change month ago -2.9 -6.3 -2.7 Per cent change year ago -8.7 -15.1 -16.5 Per cent change year ago -5.4 -10.0 -9.1 Crude oil 433.4 453.8 436.2 Crude oil 313.7 331.5 320.0 Per cent change month ago 5.6 4.7 -3.9 Per cent change month ago 2.6 5.7 -3.4 Per cent change year ago 25.5 18.0 5.9 Per cent change year ago 30.0 25.1 15.3 Source : SW EDBAN K and HW W A-Institute for Economic Research Hamburg Source : SW EDBAN K and HW W A-Institute for Economic Research Hamburg Swedbank Economic Research Department Swedbank’s monthly Energy & Commodities newsletter is published as a service to our customers. We believe that we have used reliable sources and methods in the preparation SE-105 34 Stockholm, Sweden of the analyses reported in this publication. However, we cannot guarantee the accuracy or Phone +46-8-5859 7740 completeness of the report and cannot be held responsible for any error or omission in the ek.sekr@swedbank.se underlying material or its use. Readers are encouraged to base any (investment) decisions www.swedbank.se on other material as well. Neither Swedbank nor its employees may be held responsible for Legally responsible publisher losses or damages, direct or indirect, owing to any errors or omissions in Swedbank’s Cecilia Hermansson, +46-88-5859 7720 monthly Energy & Commodities newsletter. Magnus Alvesson, +46-8-5859 3341 Jörgen Kennemar, +46-8-5859 7730 5 (5)