Housing Affordability Index for Baltics - September 11, 2012
•
0 j'aime•371 vues

Housing Affordability Index for Baltics - September 11, 2012: The housing affordability index (HAI) increased to 164.5 in Tallinn, 109.8 in Vilnius, and 138.3 in Riga

Recommandé
Recommandé
Contenu connexe
En vedette
En vedette (14)
Plus de Swedbank
Plus de Swedbank (20)
Dernier
Dernier (20)
Housing Affordability Index for Baltics - September 11, 2012
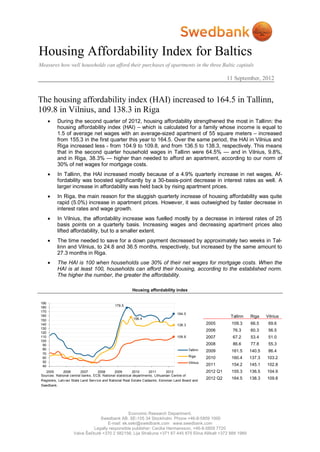
- 1. Housing Affordability Index for Baltics Measures how well households can afford their purchases of apartments in the three Baltic capitals 11 September, 2012 The housing affordability index (HAI) increased to 164.5 in Tallinn, 109.8 in Vilnius, and 138.3 in Riga During the second quarter of 2012, housing affordability strengthened the most in Tallinn: the housing affordability index (HAI) – which is calculated for a family whose income is equal to 1.5 of average net wages with an average-sized apartment of 55 square meters – increased from 155.3 in the first quarter this year to 164.5. Over the same period, the HAI in Vilnius and Riga increased less - from 104.9 to 109.8, and from 136.5 to 138.3, respectively. This means that in the second quarter household wages in Tallinn were 64.5% — and in Vilnius, 9.8%, and in Riga, 38.3% — higher than needed to afford an apartment, according to our norm of 30% of net wages for mortgage costs. In Tallinn, the HAI increased mostly because of a 4.9% quarterly increase in net wages. Af- fordability was boosted significantly by a 30-basis-point decrease in interest rates as well. A larger increase in affordability was held back by rising apartment prices. In Riga, the main reason for the sluggish quarterly increase of housing affordability was quite rapid (5.0%) increase in apartment prices. However, it was outweighed by faster decrease in interest rates and wage growth. In Vilnius, the affordability increase was fuelled mostly by a decrease in interest rates of 25 basis points on a quarterly basis. Increasing wages and decreasing apartment prices also lifted affordability, but to a smaller extent. The time needed to save for a down payment decreased by approximately two weeks in Tal- linn and Vilnius, to 24.8 and 36.5 months, respectively, but increased by the same amount to 27.3 months in Riga. The HAI is 100 when households use 30% of their net wages for mortgage costs. When the HAI is at least 100, households can afford their housing, according to the established norm. The higher the number, the greater the affordability. Housing affordability index 190 179.5 180 170 164.5 160 Tallinn Riga Vilnius 150 156.4 140 138.3 2005 109.3 66.5 69.6 130 2006 76.3 60.3 56.5 120 110 109.8 2007 67.2 53.4 51.0 100 90 2008 86.6 77.8 55.3 80 Tallinn 2009 161.5 140.5 86.4 70 60 Riga 2010 160.4 137.3 103.2 50 Vilnius 40 2011 154.2 145.1 102.8 2005 2006 2007 2008 2009 2010 2011 2012 2012 Q1 155.3 136.5 104.9 Sources: National central banks, ECB, National statistical departments, Lithuanian Centre of Registers, Latv ian State Land Serv ice and National Real Estate Cadastre, Estonian Land Board and 2012 Q2 164.5 138.3 109.8 Swedbank. Economic Research Department. Swedbank AB. SE-105 34 Stockholm. Phone +46-8-5859 1000 E-mail: ek.sekr@swedbank.com www.swedbank.com Legally responsible publisher: Cecilia Hermansson, +46-8-5859 7720 Vaiva Šečkutė +370 2 582156; Lija Strašuna +371 67 445 875 Elina Allikalt +372 888 1989
- 2. Components of the HAI: apartment prices, interest rates, and wages Apartment prices From the first to the second quarter of 2012, the price of apartments in Riga grew by 5.0%, and in Tal- linn, by 2.7%; however, in Vilnius, it fell by 1.2%. On an annual basis, the price of an average-sized, 55 sq. m. apartment grew the most in Riga (12.7%), followed by Tallinn (6.9%) and Vilnius (3.6%). In the second quarter of 2012, this standard apartment was the most expensive in Vilnius, where its price reached EUR 61,141. This same apartment cost EUR 60,734 in Tallinn and EUR 45,099 in Riga. In the second quarter, apartment prices in Riga were 46.8% lower than those seen during the peak. Prices in Vilnius and Tallinn were, respectively, 33.5% and 33.4% lower than their peak; the price cor- rection was smaller in Vilnius and the prices in Tallinn recovered the fastest from their trough. In Latvia, where apartment prices are still at the lowest level compared with their peak, price growth accelerated further from 8.8% annual growth in the first quarter this year to 12.7% in the second quar- ter. This was the fastest annual growth among the Baltic capitals. However, this growth is mostly driven by price increases for newly built houses and for apartments in the centre of Riga (partly sup- ported by demand of nonresidents). The number of such deals is still very low, though. Meanwhile, prices of Soviet-era blockhouse apartments are not yet rising. Although annual apartment price growth in Tallinn decreased from 13.9% to 6.9%, this was only due to the base effect, as quarterly growth continued to be high; the strong recovery of real estate prices in Tallinn can be linked to increasing demand, including from nonresident buyers. Annual price growth in Vilnius declined from 5.7% to 3.6% as prices contracted by 1.2% in a quarter. This was caused by weaker demand than in the other two Baltic countries. The growth in the number of deals in the second quarter of this year was 2.6%, compared with 31.2% in Tallinn and 14% in Riga. The downward pressure on apartment prices in Vilnius was also created by the larger supply of new apartments. The number of completed apartments in Vilnius County rose from almost 100 in the first half of 2011 to 500 in the first half of 2012. Apartment prices, EUR/m2 1,800 1,671 EUR 1,700 1,657 EUR 1,600 Tallinn 1,541 EUR 1,500 Riga 1,400 Vilnius 1,300 1,200 1,112 EUR 1,100 1,104 EUR 1,000 900 800 820 EUR 700 600 2005 2006 2007 2008 2009 2010 2011 2012 Sources: Lithuanian Centre of Registers, Latv ian State Land Serv ice and National Real Estate Cadastre, Estonian Land Board and Swedbank. Interest rates on mortgages Interest rates decreased on a quarterly basis in all three countries. In Lithuania and Latvia, they de- clined by 25 basis points to 3.35% and 3.83% respectively; in Estonia, they fell by 30 basis points, to 3.20%. Mortgage interest rates have been declining, mostly due to the falling euro interbank offered rate (EURIBOR). The three-month EURIBOR decreased from 1.04% in the first quarter to 0.69% in the second quarter this year. Interest rate differentials in the second quarter this year, contrary to the last four quarters, were not the main reason apartments were more affordable in Tallinn than in Riga. This was because the ratio of wages to apartment prices continued worsening in Riga in the second quarter. Meanwhile, in Tallinn this ratio improved from the first quarter of this year. Wages in Vilnius are the lowest in relation to apartment prices in the Baltic countries. 2 Housing Affordability Index for Baltics • 11 September, 2012
- 3. Annual percentage rate of charge for new mortgages to households 8.0% 7.8% 7.5% 7.0% 6.5% 6.5% 6.0% Estonia 6.4% 5.5% Latv ia Lithuania 5.0% 4.5% 4.0% 3.83% 3.5% 3.35% 3.20% 3.0% 2005 2006 2007 2008 2009 2010 2011 2012 Sources: National central banks and ECB. Average net wages From the first quarter to the second quarter of this year, the average net wages of households in- creased the most in Tallinn, where they were 4.9% higher. Riga households experienced a 3.2% rise, and wages in Vilnius picked up by 0.3%. In an annual comparison, wages rose the most in Tallinn, where growth reached 5.1% and the net wages earned by an average household was EUR 1,224 in the second quarter. In Riga, net wages increased by 3.2% to EUR 826, and, in Vilnius, by 2.5% to EUR 838. The difference in affordability between Tallinn and Vilnius is mostly dependent on wage differences. In Tallinn, households earned 46.1% more than in Vilnius, while apartment prices in the Estonian capital were 0.7% lower in the second quarter of this year. Housing in Riga is also considerably more afford- able than in Vilnius, as Vilnius households earn only 1.5% more than their counterparts in Riga, but pay 35.6% more in apartment prices. Average net wage, EUR 850 816 800 750 700 650 600 559 550 551 500 450 Tallinn 400 Riga 350 Vilnius 300 250 2005 2006 2007 2008 2009 2010 2011 2012 Sources: National statistical departments. The HAI value of 164.5 in Tallinn means that household net wages in this city are 64.5% higher than required to afford an apartment, according to our norm (mortgage costs account for 30% of net wages of a household that earns 1.5 of the average net wage). In Latvia, meanwhile, household net wages are 38.3% higher, and in Vilnius 9.8% higher than required to fulfil this norm. In the second quarter, mortgage costs amounted to 18.2% of households’ net wages in Tallinn, 21.7% in Riga, and 27.3% in Vilnius. Compared with the previous quarter, these are decreases of 1.1, 0.3, and 1.3 percentage points, respectively. Net wages of households in Vilnius need to be at least EUR 763 to meet the norm of affordability (de- fined above). This requirement for household net wages is EUR 744 in Tallinn, which is lower mostly 3 Housing Affordability Index for Baltics • 11 September, 2012
- 4. due to lower interest rates. Meanwhile, households in Riga, which enjoy the lowest apartment prices, have to earn only EUR 597 to afford an apartment – this is roughly one-fourth less than in the other capitals. Compared with a year ago, the income margin when purchasing an apartment – or the HAI value – decreased by 8.3 points in Riga. As apartment prices jumped by 12.7% in a year, favourable but smaller changes in net wages (3.2%) and interest rates (-24 basis points were not enough to keep affordability from falling. Meanwhile, the income margins in Tallinn and Vilnius widened by 7.6 and 6 points in a year respectively. Affordability was mostly supported by falling interest rates in these two cities (-52 basis points in Tallinn and -54 basis points in Vilnius). Housing prices in Tallinn increased more than in Vilnius (6.9% versus 3.6%), but wages increased faster in Tallinn (5.1% versus 2.5%). Months to save for a down payment In Tallinn and Vilnius, the number of months needed to save for a down payment, which equals 15% of an apartment price, decreased by approximately 2 weeks to 24.8 months and to 36.5 months, re- spectively, from the first to the second quarter of this year. In Riga, the saving time expanded by 2 weeks to 27.3 months over the same period. This was because in Tallinn wages increased more than apartment prices and in Vilnius apartment prices fell. Meanwhile, in Riga, the growth of apartment prices outpaced the increase in wages. It is assumed that a household saves 30% of its net wages every month for a down payment. Months to save for a down payment 70 63.5 60.3 Vilnius 60 Riga 48.2 Tallinn 50 40 36.6 30 27.3 24.8 20 10 2005 2006 2007 2008 2009 2010 2011 2012 Sources: National statistical departments, Lithuanian Centre of Registers, Latv ian State Land Serv ice and National Real Estate Cadastre, Estonian Land Board and Swedbank. Sensitivity analysis Sensitivity analysis shows that, if apartment prices were to rise by 10%, the affordability margin would disappear in Vilnius, and households’ net wages would be too low, by 0.2%, to afford an apartment. An increase in apartment prices of 10% would cause the margin to decrease by 12.6 points in Riga and by 15 points in Tallinn, but the HAI would remain above 100 – at 125.7 and 149.6 in the respec- tive capitals. The margins would disappear in each of the three Baltic capitals if apartment prices were to increase by more than 9.8% in Vilnius, 38.3% in Riga, and 64.5% in Tallinn – i.e., by the amount of the current margins. Households would no longer be able to afford apartments if interest rates were to increase by more than 0.76 percentage points in Vilnius, by more than 2.89 percentage points in Riga, and by more than 4.48 percentage points in Tallinn, if other variables remained unchanged. 4 Housing Affordability Index for Baltics • 11 September, 2012
- 5. Housing affordability index: method Purpose Measure changes in household buying power, primarily as this relates to apartment purchases but also an indicator for existing housing. Norm Household mortgage costs, according to our definition, should not exceed 30% of net wages of a household. Definition of housing affordability index Actual income in relation to income required to meet the “norm,” where mortgage costs account for 30% of net wages of a household. If the index = 100, households are using 30% of their net wages. If the index > 100, household buying power exceeds the norm. And if the index < 100, house- hold buying power is below the norm. The index is calculated according to the following formula: AverageINC HAI *100 NINC where PMT NINC . 30% HAI – housing affordability index AverageINC – 1.5 of average monthly net wages NINC – net wages that would satisfy the “norm” PMT – monthly mortgage payment Variables Three-month average prices of apartments of average size (55 sq. m.) in capitals. Average net wages of a household, equal to 1.5 of average monthly net wages in capital cities. Three-month average interest rates and other related charges (or an- nual percentage rate of charge - a rate that comprises an interest com- ponent and a component of other charges) for new housing loans to households issued in euros for Latvia and Estonia and weighted against different currencies (the litas and the euro) in Lithuania-- produce the monthly mortgage cost, assuming a 15% down payment and 30-year term. Limits The housing affordability index includes mortgage costs but excludes taxes and subsidies, including property tax and interest deductions. The index provides an indication of the situation for households composed of one or two working people, who, combined, earn one-and-a-half times the aver- age monthly wage; however, it does not reflect conditions for individual households. The index does not provide any direct guidance for business decisions, including lending and interest rate decisions. It reflects house- hold buying power, based on apartment purchases that have been made, but says nothing about opportunities for apartment sales. The housing affordability index is of an informative nature and reflects mac- roeconomic developments, rather than banks' decisions and lending poli- cies or possible decisions made by individual households. Periodicity Quarterly Geography Vilnius, Riga, Tallinn 5 Housing Affordability Index for Baltics • 11 September, 2012
- 6. Appendix 1 Housing affordability Months to save for the index down payment Tallinn Riga Vilnius Tallinn Riga Vilnius 2005 Q1 113.7 64.4 72.6 32.7 50.0 46.7 2005 Q2 118.4 66.7 69.8 32.7 53.1 53.1 2005 Q3 105.2 66.4 75.2 37.4 53.5 50.9 2005 Q4 100.1 68.3 60.5 38.6 52.5 58.9 2006 Q1 84.2 60.0 58.6 44.0 57.6 62.8 2006 Q2 81.2 63.4 55.8 44.0 53.5 63.5 2006 Q3 70.4 57.9 58.6 48.2 56.3 58.3 2006 Q4 69.5 60.0 53.1 46.9 52.0 62.1 2007 Q1 65.5 53.0 54.4 47.8 57.4 59.1 2007 Q2 67.4 52.0 51.1 45.3 56.7 59.6 2007 Q3 62.6 47.5 50.0 46.9 60.3 59.1 2007 Q4 73.2 61.1 48.5 39.5 46.0 59.9 2008 Q1 80.5 70.5 54.1 37.3 40.7 55.3 2008 Q2 87.1 75.4 53.5 34.0 36.4 54.4 2008 Q3 83.3 80.0 54.4 33.5 31.9 51.7 2008 Q4 95.4 85.3 59.0 29.8 28.8 48.4 2009 Q1 129.6 116.8 68.8 25.6 25.1 44.1 2009 Q2 160.0 148.3 87.7 22.3 22.0 38.1 2009 Q3 179.5 140.7 93.9 20.6 25.1 36.3 2009 Q4 176.9 156.4 95.5 21.3 22.8 35.6 2010 Q1 160.5 138.5 100.6 23.1 26.3 35.3 2010 Q2 162.9 137.2 102.6 23.1 26.4 35.8 2010 Q3 157.3 134.8 104.9 23.9 27.2 34.9 2010 Q4 160.9 138.6 104.6 23.8 26.7 35.4 2011 Q1 161.3 143.8 102.4 23.7 25.4 36.4 2011 Q2 156.9 146.6 103.8 24.4 25.0 36.1 2011 Q3 144.0 144.3 103.4 26.4 25.1 36.1 2011 Q4 154.5 145.7 101.8 24.9 24.9 36.7 2012 Q1 155.3 136.5 104.9 25.3 26.8 37.0 2012 Q2 164.5 138.3 109.8 24.8 27.3 36.5 High 179.5 156.4 109.8 48.2 60.3 63.5 Low 62.6 47.5 48.5 20.6 22.0 34.9 Average 119.4 99.9 77.1 32.4 38.1 47.3 Sources: National central banks, National statistical departments, Lithuanian Centre of Registers, Latvian State Land Service and National Real Estate Cadastre, Estonian Land Board, Swedbank. 6 Housing Affordability Index for Baltics • 11 September, 2012
- 7. Economic Research Department Sweden Cecilia Hermansson +46 8 5859 7720 cecilia.hermansson@swedbank.se Group Chief Economist Chief Economist, Sweden Magnus Alvesson +46 8 5859 3341 magnus.alvesson@swedbank.se Head of Economic Forecasting Jörgen Kennemar +46 8 5859 7730 jorgen.kennemar@swedbank.se Senior Economist Anna Ibegbulem +46 8 5859 7740 anna.ibegbulem@swedbank.se Assistant Estonia Elina Allikalt +372 888 1989 elina.allikalt@swedbank.ee Senior Economist Teele Reivik +372 888 7925 teele.reivik@swedbank.ee Economist Latvia Mārtiņš Kazāks +371 67 445 859 martins.kazaks@swedbank.lv Deputy Group Chief Economist Chief Economist, Latvia Lija Strašuna +371 67 445 875 lija.strasuna@swedbank.lv Senior Economist Kristilla Skūzkalne +371 67 445 844 kristilla.skuzkalne@swedbank.lv Economist Lithuania Nerijus Mačiulis +370 5 258 2237 nerijus.maciulis@swedbank.lt Chief Economist, Lithuania Vaiva Šečkutė +370 5 258 2156 vaiva.seckute@swedbank.lt Senior Economist 7 Housing Affordability Index for Baltics • 11 September, 2012
- 8. Disclaimer This research report has been prepared by economists of Swedbank’s Economic Research Department. The Economic Research Depart- ment consists of research units in Estonia, Latvia, Lithuania, and Sweden, is independent of other departments of Swedbank AB (publ) (“Swedbank”) and responsible for preparing reports on global and home market economic developments. The activities of this research department differ from the activities of other departments of Swedbank, and therefore the opinions expressed in the reports are independ- ent from interests and opinions that might be expressed by other employees of Swedbank. This report is based on information available to the public, which is deemed to be reliable, and reflects the economists’ personal and professional opinions of such information. It reflects the economists’ best understanding of the information at the moment the research was prepared and due to change of circumstances such understanding might change accordingly. This report has been prepared pursuant to the best skills of the economists and with respect to their best knowledge this report is correct and accurate, however neither Swedbank nor any enterprise belonging to Swedbank or Swedbank directors, officers, or other employees or affiliates shall be liable for any loss or damage, direct or indirect, based on any flaws or faults within this report. Enterprises belonging to Swedbank might have holdings in the enterprises mentioned in this report and provide financial services (issue loans, among others) to them. Aforementioned circumstances might influence the economic activities of such companies and the prices of securities issued by them. The research presented to you is of an informative nature. This report should in no way be interpreted as a promise or confirmation of Swedbank or any of its directors, officers, or employees that the events described in the report shall take place or that the forecasts turn out to be accurate. This report is not a recommendation to invest into securities or in any other way enter into any financial transactions based on the report. Swedbank and its directors, officers, or employees shall not be liable for any loss that you may suffer as a result of relying on this report. We stress that forecasting the developments of the economic environment is somewhat speculative in nature, and the real situation might turn out different from what this report presumes. IF YOU DECIDE TO OPERATE ON THE BASIS OF THIS REPORT, THEN YOU ACT SOLELY ON YOUR OWN RISK AND ARE OBLIGED TO VERIFY AND ESTIMATE THE ECONOMIC REASONABILITY AND THE RISKS OF SUCH ACTION INDE- PENDENTLY 8 Housing Affordability Index for Baltics • 11 September, 2012