SlideShare une entreprise Scribd logo
1  sur  4
Télécharger pour lire hors ligne
Purchasing Managers’ Index – Services                                                        August 4, 2011


Services PMI climbs to 54.7 in July: growth continues.
 The purchasing managers’ index for services (Services PMI) rose from 53.8 in June to 54.7
  in July. The downward trend observed since April has thus leveled off. The index remains
  within the growth zone, which indicates continued growth in the private services sector.

 The component index for new orders contributed the most to the increase in the Services
  PMI, landing in the growth zone yet again. Supplier delivery times also made a positive
  contribution with the index level of 56.1 in July indicating continued strong demand pressure
  within the sector.

 The rate of increase in service companies’ business activity moderated in July, and the
  employment index dropped marginally. The index for planned business activity rose
  somewhat, indicating a positive outlook for growth in the services sector.

 The index for suppliers’ intermediate goods prices dropped from 58.1 in June to 54.8 in July.
  Prices continue to rise, though the pressure decreased somewhat.


                                                                                                     Services PMI
                                                                                                     (Services Purchasing
                                                                                                       Managers’ Index)
                                                                                                Seasonally adjusted
                                                                                                2011 Jul. 54.7
                                                                                                     Jun. 53.8
                                                                                                     May 56.7
                                                                                                     Apr. 60.9
                                                                                                     Mar. 60.8
                                                                                                     Feb. 62.0
                                                                                                     Jan. 65.6
                                                                                                2010 Dec. 65.8
                                                                                                     Nov. 64.0
                                                                                                     Oct. 63.6
                                                                                                     Sep. 60.8
                                                                                                     Aug. 63.7
                                                                                                     Jul. 63.5


                Next publication of Services Purchasing Managers’ Index: Monday, September 5, 2011
Silf/Swedbank’s Purchasing Managers’ Index Service Sector. seasonally adjusted
                            Components of PMI                          Other indicies            Forecast

              Total index    Business    Delivery    New     Employ-     Back-log       Prices    Planned
                              activity    times     orders    ment       of orders               business
                                                                                                   activity
  2006 jan       59.0          64.5       53.4      59.4      57.1         60.2         45.6       68.1
       feb       58.6          65.6       52.5      58.2      56.7         54.4         48.1       62.3
       mar       62.3          69.7       53.7      63.6      59.2         63.6         48.7       64.8
       apr       56.9          60.5       53.2      59.2      52.3         52.3         52.0       67.4
       maj       60.6          65.1       52.1      64.1      57.4         58.9         54.2       72.1
       jun       67.2          72.8       58.0      72.1      61.0         64.6         59.8       71.2
       jul       63.6          66.2       60.4      64.2      62.5         62.2         52.1       67.6
       aug       64.4          69.2       54.6      66.5      64.7         60.8         54.6       69.8
       sep       61.6          68.5       52.5      65.3      55.6         63.0         55.8       66.7
       okt       61.0          67.1       54.9      61.7      58.3         55.8         54.4       67.0
       nov       63.7          65.2       61.5      62.9      65.5         59.9         55.6       72.7
       dec       67.3          71.6       59.6      68.4      67.9         58.6         53.2       75.2
  2007 jan       66.2          70.8       60.9      67.7      63.0         63.3         57.9       73.9
       feb       62.7          70.7       59.9      62.6      55.7         61.5         60.1       70.2
       mar       59.3          60.5       54.9      61.5      58.2         56.7         56.0       68.8
       apr       66.0          73.1       60.0      69.4      57.2         64.6         57.9       66.7
       maj       60.8          62.2       59.7      61.9      58.4         66.2         60.3       67.0
       jun       62.9          63.0       57.7      65.5      63.7         63.0         55.9       64.5
       jul       60.8          64.4       61.7      61.5      54.0         60.6         59.2       65.8
       aug       56.8          57.6       59.0      55.0      56.7         52.8         57.9       60.7
       sep       58.0          59.0       57.1      54.8      63.2         57.1         52.3       62.0
       okt       57.0          55.7       56.6      56.1      60.3         53.0         57.0       68.8
       nov       60.7          66.9       54.8      61.0      58.0         58.7         61.3       54.4
       dec       62.1          66.7       56.9      61.3      62.9         64.7         62.1       60.2
  2008 jan       57.8          59.9       52.6      56.7      62.1         56.2         63.3       67.5
       feb       56.4          57.2       54.1      58.5      53.8         58.6         61.2       64.4
       mar       54.4          53.9       52.5      53.7      58.3         52.5         59.4       71.5
       apr       52.5          53.3       49.2      49.4      60.5         53.1         56.1       61.9
       maj       60.7          68.6       50.7      57.4      66.5         55.8         56.6       64.3
       jun       52.9          56.5       50.1      48.4      59.1         46.3         64.4       64.6
       jul       53.8          58.1       45.9      49.8      63.0         45.4         67.0       60.5
       aug       50.3          52.6       49.5      45.5      56.5         48.9         56.8       60.5
       sep       51.9          56.2       47.5      46.7      60.1         38.7         57.6       56.3
       okt       42.2          43.9       45.6      34.9      49.6         44.1         57.7       47.9
       nov       43.7          43.7       49.5      36.9      49.9         35.8         53.4       42.5
       dec       38.1          37.5       39.7      36.8      39.5         37.0         45.2       40.3
  2009 jan       35.3          33.2       42.3      35.5      30.5         28.3         48.7       33.9
       feb       38.2          37.3       38.6      35.9      42.7         34.6         47.4       41.0
       mar       40.6          43.9       41.6      42.2      32.5         39.1         48.3       36.8
       apr       40.0          41.1       39.0      39.8      40.0         39.0         42.6       46.5
       maj       40.7          44.3       42.7      43.6      29.1         38.3         41.0       44.5
       juni      42.3          44.0       40.5      46.9      33.8         44.7         35.9       52.2
       juli      43.2          45.6       38.7      47.7      36.6         43.2         40.9       55.8
       aug       45.5          50.9       40.9      50.5      34.4         47.2         45.1       55.5
       sep       48.5          52.6       45.6      55.0      34.8         54.2         48.8       58.7
       okt       54.9          61.8       47.1      62.2      41.2         62.5         44.7       61.0
       nov       51.2          56.5       47.7      56.7      38.4         57.0         44.5       67.4
       dec       47.5          52.3       46.6      49.7      38.4         48.5         52.4       61.3
  2010 jan       55.2          59.4       50.7      59.2      47.4         56.2         48.7       61.8
       feb       60.9          64.0       53.8      67.5      52.4         60.7         46.4       75.4
       mar       61.4          65.0       58.5      63.6      55.7         60.3         56.0       71.9
       apr       62.3          66.3       60.9      64.3      55.2         61.1         60.3       74.1
       maj       59.4          60.4       59.7      60.5      55.8         58.9         62.8       69.5
       juni      60.2          61.9       62.5      61.7      53.0         61.8         62.6       69.8
       juli      63.5          67.1       61.6      66.4      55.9         63.6         63.8       72.2
       aug       63.7          65.9       62.0      67.7      55.7         63.6         61.6       70.2
       sep       60.8          59.4       64.3      63.4      54.6         60.1         63.1       73.4
       okt       63.6          64.9       61.6      67.0      57.8         61.2         60.0       76.2
       nov       64.0          64.9       58.6      67.5      62.1         63.9         65.6       77.7
       dec       65.8          69.5       64.4      65.7      62.8         60.7         63.6       76.9
  2011 jan       65.6          70.6       61.2      66.0      62.9         64.7         67.2       77.9
       feb       62.0          62.6       62.4      61.2      62.0         58.3         69.0       69.7
       mar       60.8          64.4       60.6      58.8      60.0         55.7         64.7       69.7
       apr       60.9          62.9       60.2      61.2      58.9         58.2         65.2       67.6
       maj       56.7          56.2       58.4      55.4      57.9         50.5         60.3       67.6
       juni      53.8          59.0       55.0      48.4      55.4         48.5         58.1       62.9
       juli      54.7          55.6       56.1      52.8      55.2         53.8         54.8       63.0
Purchasing Managers Index - Services
                                                                 June 2011, continued


Silf/Swedbank’s Purchasing Managers’ Index Service Sector, orginal
                             Components of PMI                                    Other indicies                   Forecast

             Total index      Business     Delivery       New      Employ-          Back-log       Prices           Planned
                               activity     times        orders     ment            of orders                      business
                                                                                                                     activity
 2006 jan            53.7           57.0          50.8      53.9        52.3               54.0             46.9        65.6
      feb            57.6           63.8          52.6      57.8        54.3               56.9             49.1        63.2
      mar            63.6           72.6          51.2      66.7        59.5               66.7             48.8        65.5
      apr            59.6           63.6          52.7      63.6        54.6               55.6             53.6        70.9
      maj            63.6           69.2          52.9      67.3        60.6               62.5             56.7        76.0
      jun            72.3           78.8          61.0      76.8        67.5               68.3             61.0        73.8
      jul            58.9           58.1          62.8      55.8        61.6               54.7             52.3        67.4
      aug            66.5           71.6          53.4      69.3        68.2               63.6             54.5        69.3
      sep            64.0           72.6          53.5      68.6        55.8               64.0             57.0        66.3
      okt            60.8           67.0          56.1      61.2        57.1               55.0             53.0        66.0
      nov            62.2           64.1          62.0      59.8        64.1               56.5             52.2        69.6
      dec            63.6           67.4          57.4      64.9        62.8               56.4             48.9        71.3
 2007 jan            60.9           63.3          58.3      62.2        58.2               57.1             59.2        71.4
      feb            61.7           68.9          60.0      62.2        53.3               64.0             61.1        71.1
      mar            60.6           63.4          52.4      64.6        58.5               59.8             56.1        69.5
      apr            68.7           76.2          59.5      73.8        59.5               67.9             59.5        70.2
      maj            63.8           66.3          60.5      65.1        61.6               69.8             62.8        70.9
      jun            68.0           69.0          60.7      70.2        70.2               66.7             57.1        67.1
      jul            56.1           56.3          64.1      53.1        53.1               53.1             59.4        65.6
      aug            58.8           60.0          57.8      57.8        60.2               55.6             57.8        60.2
      sep            60.4           63.1          58.1      58.1        63.4               58.1             53.5        61.6
      okt            56.7           55.6          57.8      55.6        59.1               52.2             55.6        67.8
      nov            59.1           65.8          55.3      57.9        56.6               55.3             57.9        51.3
      dec            58.4           62.5          54.7      57.8        57.8               62.5             57.8        56.3
 2008 jan            52.5           52.4          50.0      51.2        57.3               50.0             64.6        65.0
      feb            55.3           55.4          54.2      58.1        51.4               61.1             62.2        65.3
      mar            55.8           56.8          50.0      56.8        58.6               55.6             59.5        72.2
      apr            55.2           56.4          48.7      53.8        62.8               56.4             57.7        65.4
      maj            63.6           72.7          51.5      60.6        69.7               59.4             59.1        68.2
      jun            58.0           62.5          53.1      53.1        65.6               50.0             65.6        67.2
      jul            49.1           50.0          48.3      41.4        62.1               37.9             67.2        60.3
      aug            52.3           55.0          48.3      48.3        60.0               51.7             56.7        60.0
      sep            54.3           60.3          48.5      50.0        60.3               39.7             58.8        55.9
      okt            42.0           43.8          46.8      34.4        48.4               43.3             56.3        46.9
      nov            42.2           42.6          50.0      33.8        48.5               32.4             50.0        39.4
      dec            34.4           33.3          37.5      33.3        34.4               34.8             40.9        36.4
 2009 jan            30.0           25.7          39.7      30.0        25.7               22.1             50.0        31.4
      feb            37.1           35.5          38.7      35.5        40.3               37.1             48.4        41.9
      mar            41.9           46.8          39.1      45.3        32.8               42.2             48.4        37.5
      apr            42.7           44.2          38.5      44.2        42.3               42.3             44.2        50.0
      maj            43.6           48.4          43.5      46.8        32.3               41.9             43.5        48.4
      juni           47.3           50.0          43.5      51.6        40.3               48.4             37.1        54.8
      juli           38.5           37.5          41.1      39.3        35.7               35.7             41.1        55.6
      aug            47.5           53.3          39.7      53.3        37.9               50.0             45.0        55.0
      sep            50.9           56.7          46.6      58.3        35.0               55.2             50.0        58.3
      okt            54.7           61.7          48.3      61.7        40.0               61.7             43.3        60.0
      nov            49.7           55.4          48.2      53.6        37.0               53.6             41.1        64.3
      dec            43.7           48.1          44.4      46.2        33.3               46.3             48.1        57.4
 2010 jan            49.9           51.9          48.1      53.7        42.6               50.0             50.0        59.3
      feb            59.8           62.2          53.9      67.1        50.0               63.2             47.4        76.3
      mar            62.7           67.9          56.0      66.7        56.0               63.4             56.1        72.6
      apr            65.0           69.4          60.4      68.7        57.5               64.4             61.9        77.6
      maj            62.3           64.5          60.5      63.7        59.0               62.5             65.3        73.4
      juni           65.2           67.9          65.5      66.4        59.5               65.5             63.8        72.4
      juli           58.9           59.0          64.0      58.0        55.0               56.1             64.0        72.0
      aug            65.8           68.3          60.8      70.5        59.2               66.4             61.5        69.7
      sep            63.2           63.5          65.3      66.7        54.8               61.1             64.3        73.0
      okt            63.4           64.8          62.8      66.5        56.6               60.4             58.6        75.2
      nov            62.5           63.8          59.1      64.4        60.7               60.5             62.2        74.6
      dec            62.1           65.3          62.2      62.2        57.7               58.5             59.3        73.0
 2011 jan            60.3           63.1          58.6      60.5        58.1               58.5             68.5        75.4
      feb            60.9           60.8          62.5      60.8        59.6               60.8             70.0        70.6
      mar            62.2           67.3          58.1      61.9        60.3               58.8             64.8        70.4
      apr            63.6           66.0          59.7      65.6        61.2               61.5             66.8        71.1
      maj            59.6           60.3          59.2      58.6        61.1               54.1             62.8        71.5
      juni           58.8           65.0          58.0      53.1        61.9               52.2             59.3        65.5
      juli           50.0           47.5          58.5      44.4        54.3               46.3             55.0        62.8


                           Magnus Alvesson, Swedbank, Economic Research Department, Tel. +46 (0)8-5859 4133
                                      Administration, Tel. +46 (0)8-5859 7740, ek.sekr@swedbank.se
                                     Sebastian Bergfelt, Silf, +46 (0)73-944 6450, professionals@silf.se
Silf/Swedbank’s
Purchasing Managers’ Index – Services
- objectives and methodology
History                             Silf and Swedbank AB publ. made the first joint – internal – calculation of the
                                    “Purchasing Managers’ Index” for the service sector of the four indexes (PMI) during
                                    2005. The model for PMI – Services is the U.S. based Non-Manufacturing Index and
                                    the Swedish PMI, which has been published since November 1994

Participants                        About 200 purchasing managers in the service sector.

Publication                         Third weekday of each month, 8:30 am.

Analysis Period                     Comparison with previous month.

Composition
of PMI – Services (%)               New orders (within the company)                              35
                                    Business activity (within the company)                       25
                                    Employment (within the company)                              20
                                    Suppliers’ Delivery Times                                    20


Other leading indicators
(not included in PMI – Services) Backlog of Orders
                                 Suppliers’ intermediate goods prices
                                 Planned business activity next six months

Objective                           Quick economic indicator
                                    Simple statistics
                                    Statistics with relatively short publication intervals
                                    Constant contact with a well-informed professional group

Calculation                         According to “diffusion index”. Positive changes are noted in percent for the four sub
                                    indexes. The percentage of unchanged replies, multiplied by 0.5, is added to this
                                    figure. Then the different sub indexes are weighted as described above to reach the
                                    total index. The Purchasing Managers’ Index – Services does not indicate activity
                                    levels but rather monthly changes in activity in the service sector.

“Break-even”                        The dividing line between growth and decline – in line with US praxis – has been
                                    drawn at a total index of 50. However, this boundary or “neutral growth zone” should
                                    not be applied excessively. Rather, “Break-even” at 50 indicates a target value.


  We believe we have used reliable sources and procedures to generate and analyze the Purchasing Managers’ Index (PMI –
  Services). However, Swedbank AB (publ) and SILF (earlier Organisationen för Inköp och Logistik, /I&L/ – The Organization
  for Purchasing and Logistics) cannot guarantee the accuracy or completeness of the analyses and cannot be responsible for
  any errors or omissions in the basic data or processing thereof. The reader should base any decisions on other background
  material as well.
  Swedbank AB (publ), SILF. their employees, and other coworkers accept no liability whatsoever for any direct or
  consequential loss or injury of any kind arising from any errors or omissions in the analyses presented in the Purchasing
  Managers’ Index – Services.

Contenu connexe

Tendances

Purchasing Managers´Index Report, September 2011
Purchasing Managers´Index Report, September 2011Purchasing Managers´Index Report, September 2011
Purchasing Managers´Index Report, September 2011
Swedbank
 
Purchasing Managers' Index
Purchasing Managers' IndexPurchasing Managers' Index
Purchasing Managers' Index
Swedbank
 
Energy & Commodities
Energy & CommoditiesEnergy & Commodities
Energy & Commodities
Swedbank
 
Purchasing Managers´Index Report, August 2011
Purchasing Managers´Index Report, August 2011Purchasing Managers´Index Report, August 2011
Purchasing Managers´Index Report, August 2011
Swedbank
 
Purchasing Managers´Index Report, November 2011
Purchasing Managers´Index Report, November 2011Purchasing Managers´Index Report, November 2011
Purchasing Managers´Index Report, November 2011
Swedbank
 
Mortgages
MortgagesMortgages
Mortgages
ukabuka
 

Tendances (20)

Purchasing Managers´Index Report, June 2011
Purchasing Managers´Index Report, June 2011Purchasing Managers´Index Report, June 2011
Purchasing Managers´Index Report, June 2011
 
Purchasing Managers´Index Report, May 2011
Purchasing Managers´Index Report, May 2011Purchasing Managers´Index Report, May 2011
Purchasing Managers´Index Report, May 2011
 
Purchasing Managers´Index Report, March 2011
Purchasing Managers´Index Report, March 2011Purchasing Managers´Index Report, March 2011
Purchasing Managers´Index Report, March 2011
 
Purchasing Managers´Index Report, September 2011
Purchasing Managers´Index Report, September 2011Purchasing Managers´Index Report, September 2011
Purchasing Managers´Index Report, September 2011
 
Purchasing Managers´Index Report, July 2011
Purchasing Managers´Index Report, July 2011Purchasing Managers´Index Report, July 2011
Purchasing Managers´Index Report, July 2011
 
Purchasing Managers' Index
Purchasing Managers' IndexPurchasing Managers' Index
Purchasing Managers' Index
 
Energy & Commodities
Energy & CommoditiesEnergy & Commodities
Energy & Commodities
 
Purchasing Managers´Index Report, August 2011
Purchasing Managers´Index Report, August 2011Purchasing Managers´Index Report, August 2011
Purchasing Managers´Index Report, August 2011
 
Purchasing Managers´Index Report, February 2011
Purchasing Managers´Index Report, February 2011Purchasing Managers´Index Report, February 2011
Purchasing Managers´Index Report, February 2011
 
Purchasing Managers' Index
Purchasing Managers' IndexPurchasing Managers' Index
Purchasing Managers' Index
 
Purchasing Managers´ Index Services, May 2011
Purchasing Managers´ Index Services, May 2011Purchasing Managers´ Index Services, May 2011
Purchasing Managers´ Index Services, May 2011
 
Purchasing Managers´Index Report, November 2011
Purchasing Managers´Index Report, November 2011Purchasing Managers´Index Report, November 2011
Purchasing Managers´Index Report, November 2011
 
Purchasing Managers´Index Report, December 2011
Purchasing Managers´Index Report, December 2011Purchasing Managers´Index Report, December 2011
Purchasing Managers´Index Report, December 2011
 
Purchasing Managers' Index February 2012
Purchasing Managers' Index February 2012Purchasing Managers' Index February 2012
Purchasing Managers' Index February 2012
 
P3
P3P3
P3
 
Purchasing Managers' Index March 2012
Purchasing Managers' Index March 2012Purchasing Managers' Index March 2012
Purchasing Managers' Index March 2012
 
Purchasing Managers' Index August 1, 2012
Purchasing Managers' Index August 1, 2012Purchasing Managers' Index August 1, 2012
Purchasing Managers' Index August 1, 2012
 
Performance profiles indomobil sukses internasional tbk
Performance profiles indomobil sukses internasional tbkPerformance profiles indomobil sukses internasional tbk
Performance profiles indomobil sukses internasional tbk
 
Mortgages
MortgagesMortgages
Mortgages
 
Hdfc 12 12
Hdfc 12 12Hdfc 12 12
Hdfc 12 12
 

En vedette

The Swedish Economy No.2 - March 29, 2012
The Swedish Economy No.2 - March 29, 2012 The Swedish Economy No.2 - March 29, 2012
The Swedish Economy No.2 - March 29, 2012
Swedbank
 

En vedette (8)

The Latvian Economy - No 7, September 14, 2011
The Latvian Economy - No 7, September 14, 2011The Latvian Economy - No 7, September 14, 2011
The Latvian Economy - No 7, September 14, 2011
 
The Global Economy No. 5 - August 7, 2012
The Global Economy No. 5 -  August 7, 2012The Global Economy No. 5 -  August 7, 2012
The Global Economy No. 5 - August 7, 2012
 
Purchasing Managers' Index - September 3, 2012
Purchasing Managers' Index - September 3, 2012Purchasing Managers' Index - September 3, 2012
Purchasing Managers' Index - September 3, 2012
 
Lithuanian Economy, No. 6 - September 5, 2012
Lithuanian Economy, No. 6 - September 5, 2012 Lithuanian Economy, No. 6 - September 5, 2012
Lithuanian Economy, No. 6 - September 5, 2012
 
The Global Economy No. 7 - October 31, 2011
The Global Economy No. 7 -  October 31, 2011The Global Economy No. 7 -  October 31, 2011
The Global Economy No. 7 - October 31, 2011
 
The Swedish Economy No.2 - March 29, 2012
The Swedish Economy No.2 - March 29, 2012 The Swedish Economy No.2 - March 29, 2012
The Swedish Economy No.2 - March 29, 2012
 
Swedbank's Third Quarter 2011 Results Presentation
Swedbank's Third Quarter 2011 Results PresentationSwedbank's Third Quarter 2011 Results Presentation
Swedbank's Third Quarter 2011 Results Presentation
 
Purchasing Managers' Index Services January 2012
Purchasing Managers' Index Services January 2012Purchasing Managers' Index Services January 2012
Purchasing Managers' Index Services January 2012
 

Similaire à Purchasing Managers´ Index Services, July 2011

Purchasing Managers´Index Report, May 2011
Purchasing Managers´Index Report, May 2011Purchasing Managers´Index Report, May 2011
Purchasing Managers´Index Report, May 2011
Swedbank
 
Characteristics of the labor market and employment in Krasnoyarsk territory
Characteristics of the labor market and employment in Krasnoyarsk territoryCharacteristics of the labor market and employment in Krasnoyarsk territory
Characteristics of the labor market and employment in Krasnoyarsk territory
zubova_rita
 

Similaire à Purchasing Managers´ Index Services, July 2011 (15)

Purchasing Managers' Index December 2010
Purchasing Managers' Index December 2010Purchasing Managers' Index December 2010
Purchasing Managers' Index December 2010
 
Purchasing Managers' Index Report April 2010
Purchasing Managers' Index Report April 2010Purchasing Managers' Index Report April 2010
Purchasing Managers' Index Report April 2010
 
Purchasing Managers Index Report 2010 January
Purchasing Managers Index Report 2010 JanuaryPurchasing Managers Index Report 2010 January
Purchasing Managers Index Report 2010 January
 
Purchasing Managers' Index Report 2010 February
Purchasing Managers' Index Report 2010 FebruaryPurchasing Managers' Index Report 2010 February
Purchasing Managers' Index Report 2010 February
 
Purchasing Managers' Index Report December 2009
Purchasing Managers' Index Report December 2009Purchasing Managers' Index Report December 2009
Purchasing Managers' Index Report December 2009
 
Purchasing Managers´Index Report, May 2011
Purchasing Managers´Index Report, May 2011Purchasing Managers´Index Report, May 2011
Purchasing Managers´Index Report, May 2011
 
Purchasing Managers' Index Report May 2009
Purchasing Managers' Index Report May 2009Purchasing Managers' Index Report May 2009
Purchasing Managers' Index Report May 2009
 
Purchasing Managers' Index, 2010 March
Purchasing Managers' Index, 2010 MarchPurchasing Managers' Index, 2010 March
Purchasing Managers' Index, 2010 March
 
Purchasing Managers´Index Report, October 2011
Purchasing Managers´Index Report, October 2011Purchasing Managers´Index Report, October 2011
Purchasing Managers´Index Report, October 2011
 
Purchasing Managers' Index Report November 2009
Purchasing Managers' Index Report November 2009Purchasing Managers' Index Report November 2009
Purchasing Managers' Index Report November 2009
 
Purchasing Managers' Index Report August 2009
Purchasing Managers' Index Report August 2009Purchasing Managers' Index Report August 2009
Purchasing Managers' Index Report August 2009
 
Purchasing Managers' Index Report October 2009
Purchasing Managers' Index Report October 2009Purchasing Managers' Index Report October 2009
Purchasing Managers' Index Report October 2009
 
Purchasing Managers' Index Report May 2010
Purchasing Managers' Index Report May 2010Purchasing Managers' Index Report May 2010
Purchasing Managers' Index Report May 2010
 
Purchasing Managers' Index Report July 2009
Purchasing Managers' Index Report July 2009Purchasing Managers' Index Report July 2009
Purchasing Managers' Index Report July 2009
 
Characteristics of the labor market and employment in Krasnoyarsk territory
Characteristics of the labor market and employment in Krasnoyarsk territoryCharacteristics of the labor market and employment in Krasnoyarsk territory
Characteristics of the labor market and employment in Krasnoyarsk territory
 

Plus de Swedbank

Plus de Swedbank (20)

Swedbank corporate presentation April 25 2017
Swedbank corporate presentation April 25 2017Swedbank corporate presentation April 25 2017
Swedbank corporate presentation April 25 2017
 
Swedbank foretagspresentation 25 april 2017
Swedbank foretagspresentation 25 april 2017Swedbank foretagspresentation 25 april 2017
Swedbank foretagspresentation 25 april 2017
 
Delårsrapport kv1 2017
Delårsrapport kv1 2017Delårsrapport kv1 2017
Delårsrapport kv1 2017
 
Interim report q1 2017
Interim report q1 2017Interim report q1 2017
Interim report q1 2017
 
Year end report 2016
Year end report 2016Year end report 2016
Year end report 2016
 
Bokslutskommuniké 2016
Bokslutskommuniké 2016Bokslutskommuniké 2016
Bokslutskommuniké 2016
 
Swedbank företagspresentation, 2 februari 2017
Swedbank företagspresentation, 2 februari 2017Swedbank företagspresentation, 2 februari 2017
Swedbank företagspresentation, 2 februari 2017
 
Swedbank corporate presentation, February 2 2017
Swedbank corporate presentation, February 2 2017Swedbank corporate presentation, February 2 2017
Swedbank corporate presentation, February 2 2017
 
Swedbank Corporate Presentation, October 25 2016
Swedbank Corporate Presentation, October 25 2016Swedbank Corporate Presentation, October 25 2016
Swedbank Corporate Presentation, October 25 2016
 
Swedbank företagspresentation, 25 oktober 2016
Swedbank företagspresentation, 25 oktober 2016Swedbank företagspresentation, 25 oktober 2016
Swedbank företagspresentation, 25 oktober 2016
 
Swedbank Corporate Presentation, June 30 2016
Swedbank Corporate Presentation, June 30 2016Swedbank Corporate Presentation, June 30 2016
Swedbank Corporate Presentation, June 30 2016
 
Swedbank företagspresentation, 30 juni 2016
Swedbank företagspresentation, 30 juni 2016Swedbank företagspresentation, 30 juni 2016
Swedbank företagspresentation, 30 juni 2016
 
Swedbank corporate presentation Q1, 2016
Swedbank corporate presentation Q1, 2016Swedbank corporate presentation Q1, 2016
Swedbank corporate presentation Q1, 2016
 
Swedbank företagspresentation kvartal 1, 2016.
Swedbank företagspresentation kvartal 1, 2016.Swedbank företagspresentation kvartal 1, 2016.
Swedbank företagspresentation kvartal 1, 2016.
 
Swedbank corporate presentation Q4, 2015
Swedbank corporate presentation Q4, 2015Swedbank corporate presentation Q4, 2015
Swedbank corporate presentation Q4, 2015
 
Swedbank företagspresentation kvartal 4,2015
Swedbank företagspresentation kvartal 4,2015Swedbank företagspresentation kvartal 4,2015
Swedbank företagspresentation kvartal 4,2015
 
Year end report 2015
Year end report 2015Year end report 2015
Year end report 2015
 
Bokslutskommuniké 2015
Bokslutskommuniké 2015Bokslutskommuniké 2015
Bokslutskommuniké 2015
 
Swedbank Företagspresentation, September 2015
Swedbank Företagspresentation, September 2015Swedbank Företagspresentation, September 2015
Swedbank Företagspresentation, September 2015
 
Swedbank Corporate Presentation, September 2015
Swedbank Corporate Presentation, September 2015Swedbank Corporate Presentation, September 2015
Swedbank Corporate Presentation, September 2015
 

Dernier

VIP Independent Call Girls in Bandra West 🌹 9920725232 ( Call Me ) Mumbai Esc...
VIP Independent Call Girls in Bandra West 🌹 9920725232 ( Call Me ) Mumbai Esc...VIP Independent Call Girls in Bandra West 🌹 9920725232 ( Call Me ) Mumbai Esc...
VIP Independent Call Girls in Bandra West 🌹 9920725232 ( Call Me ) Mumbai Esc...
dipikadinghjn ( Why You Choose Us? ) Escorts
 

Dernier (20)

Call Girls Koregaon Park Call Me 7737669865 Budget Friendly No Advance Booking
Call Girls Koregaon Park Call Me 7737669865 Budget Friendly No Advance BookingCall Girls Koregaon Park Call Me 7737669865 Budget Friendly No Advance Booking
Call Girls Koregaon Park Call Me 7737669865 Budget Friendly No Advance Booking
 
The Economic History of the U.S. Lecture 23.pdf
The Economic History of the U.S. Lecture 23.pdfThe Economic History of the U.S. Lecture 23.pdf
The Economic History of the U.S. Lecture 23.pdf
 
(Vedika) Low Rate Call Girls in Pune Call Now 8250077686 Pune Escorts 24x7
(Vedika) Low Rate Call Girls in Pune Call Now 8250077686 Pune Escorts 24x7(Vedika) Low Rate Call Girls in Pune Call Now 8250077686 Pune Escorts 24x7
(Vedika) Low Rate Call Girls in Pune Call Now 8250077686 Pune Escorts 24x7
 
The Economic History of the U.S. Lecture 21.pdf
The Economic History of the U.S. Lecture 21.pdfThe Economic History of the U.S. Lecture 21.pdf
The Economic History of the U.S. Lecture 21.pdf
 
Independent Call Girl Number in Kurla Mumbai📲 Pooja Nehwal 9892124323 💞 Full ...
Independent Call Girl Number in Kurla Mumbai📲 Pooja Nehwal 9892124323 💞 Full ...Independent Call Girl Number in Kurla Mumbai📲 Pooja Nehwal 9892124323 💞 Full ...
Independent Call Girl Number in Kurla Mumbai📲 Pooja Nehwal 9892124323 💞 Full ...
 
The Economic History of the U.S. Lecture 18.pdf
The Economic History of the U.S. Lecture 18.pdfThe Economic History of the U.S. Lecture 18.pdf
The Economic History of the U.S. Lecture 18.pdf
 
VIP Independent Call Girls in Bandra West 🌹 9920725232 ( Call Me ) Mumbai Esc...
VIP Independent Call Girls in Bandra West 🌹 9920725232 ( Call Me ) Mumbai Esc...VIP Independent Call Girls in Bandra West 🌹 9920725232 ( Call Me ) Mumbai Esc...
VIP Independent Call Girls in Bandra West 🌹 9920725232 ( Call Me ) Mumbai Esc...
 
(ANIKA) Budhwar Peth Call Girls Just Call 7001035870 [ Cash on Delivery ] Pun...
(ANIKA) Budhwar Peth Call Girls Just Call 7001035870 [ Cash on Delivery ] Pun...(ANIKA) Budhwar Peth Call Girls Just Call 7001035870 [ Cash on Delivery ] Pun...
(ANIKA) Budhwar Peth Call Girls Just Call 7001035870 [ Cash on Delivery ] Pun...
 
The Economic History of the U.S. Lecture 22.pdf
The Economic History of the U.S. Lecture 22.pdfThe Economic History of the U.S. Lecture 22.pdf
The Economic History of the U.S. Lecture 22.pdf
 
Stock Market Brief Deck (Under Pressure).pdf
Stock Market Brief Deck (Under Pressure).pdfStock Market Brief Deck (Under Pressure).pdf
Stock Market Brief Deck (Under Pressure).pdf
 
TEST BANK For Corporate Finance, 13th Edition By Stephen Ross, Randolph Weste...
TEST BANK For Corporate Finance, 13th Edition By Stephen Ross, Randolph Weste...TEST BANK For Corporate Finance, 13th Edition By Stephen Ross, Randolph Weste...
TEST BANK For Corporate Finance, 13th Edition By Stephen Ross, Randolph Weste...
 
The Economic History of the U.S. Lecture 25.pdf
The Economic History of the U.S. Lecture 25.pdfThe Economic History of the U.S. Lecture 25.pdf
The Economic History of the U.S. Lecture 25.pdf
 
Dharavi Russian callg Girls, { 09892124323 } || Call Girl In Mumbai ...
Dharavi Russian callg Girls, { 09892124323 } || Call Girl In Mumbai ...Dharavi Russian callg Girls, { 09892124323 } || Call Girl In Mumbai ...
Dharavi Russian callg Girls, { 09892124323 } || Call Girl In Mumbai ...
 
Log your LOA pain with Pension Lab's brilliant campaign
Log your LOA pain with Pension Lab's brilliant campaignLog your LOA pain with Pension Lab's brilliant campaign
Log your LOA pain with Pension Lab's brilliant campaign
 
(INDIRA) Call Girl Mumbai Call Now 8250077686 Mumbai Escorts 24x7
(INDIRA) Call Girl Mumbai Call Now 8250077686 Mumbai Escorts 24x7(INDIRA) Call Girl Mumbai Call Now 8250077686 Mumbai Escorts 24x7
(INDIRA) Call Girl Mumbai Call Now 8250077686 Mumbai Escorts 24x7
 
00_Main ppt_MeetupDORA&CyberSecurity.pptx
00_Main ppt_MeetupDORA&CyberSecurity.pptx00_Main ppt_MeetupDORA&CyberSecurity.pptx
00_Main ppt_MeetupDORA&CyberSecurity.pptx
 
The Economic History of the U.S. Lecture 19.pdf
The Economic History of the U.S. Lecture 19.pdfThe Economic History of the U.S. Lecture 19.pdf
The Economic History of the U.S. Lecture 19.pdf
 
Call US 📞 9892124323 ✅ Kurla Call Girls In Kurla ( Mumbai ) secure service
Call US 📞 9892124323 ✅ Kurla Call Girls In Kurla ( Mumbai ) secure serviceCall US 📞 9892124323 ✅ Kurla Call Girls In Kurla ( Mumbai ) secure service
Call US 📞 9892124323 ✅ Kurla Call Girls In Kurla ( Mumbai ) secure service
 
02_Fabio Colombo_Accenture_MeetupDora&Cybersecurity.pptx
02_Fabio Colombo_Accenture_MeetupDora&Cybersecurity.pptx02_Fabio Colombo_Accenture_MeetupDora&Cybersecurity.pptx
02_Fabio Colombo_Accenture_MeetupDora&Cybersecurity.pptx
 
Booking open Available Pune Call Girls Talegaon Dabhade 6297143586 Call Hot ...
Booking open Available Pune Call Girls Talegaon Dabhade  6297143586 Call Hot ...Booking open Available Pune Call Girls Talegaon Dabhade  6297143586 Call Hot ...
Booking open Available Pune Call Girls Talegaon Dabhade 6297143586 Call Hot ...
 

Purchasing Managers´ Index Services, July 2011

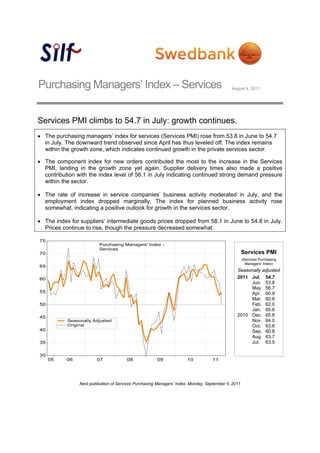
  • 1. Purchasing Managers’ Index – Services August 4, 2011 Services PMI climbs to 54.7 in July: growth continues.  The purchasing managers’ index for services (Services PMI) rose from 53.8 in June to 54.7 in July. The downward trend observed since April has thus leveled off. The index remains within the growth zone, which indicates continued growth in the private services sector.  The component index for new orders contributed the most to the increase in the Services PMI, landing in the growth zone yet again. Supplier delivery times also made a positive contribution with the index level of 56.1 in July indicating continued strong demand pressure within the sector.  The rate of increase in service companies’ business activity moderated in July, and the employment index dropped marginally. The index for planned business activity rose somewhat, indicating a positive outlook for growth in the services sector.  The index for suppliers’ intermediate goods prices dropped from 58.1 in June to 54.8 in July. Prices continue to rise, though the pressure decreased somewhat. Services PMI (Services Purchasing Managers’ Index) Seasonally adjusted 2011 Jul. 54.7 Jun. 53.8 May 56.7 Apr. 60.9 Mar. 60.8 Feb. 62.0 Jan. 65.6 2010 Dec. 65.8 Nov. 64.0 Oct. 63.6 Sep. 60.8 Aug. 63.7 Jul. 63.5 Next publication of Services Purchasing Managers’ Index: Monday, September 5, 2011
  • 2. Silf/Swedbank’s Purchasing Managers’ Index Service Sector. seasonally adjusted Components of PMI Other indicies Forecast Total index Business Delivery New Employ- Back-log Prices Planned activity times orders ment of orders business activity 2006 jan 59.0 64.5 53.4 59.4 57.1 60.2 45.6 68.1 feb 58.6 65.6 52.5 58.2 56.7 54.4 48.1 62.3 mar 62.3 69.7 53.7 63.6 59.2 63.6 48.7 64.8 apr 56.9 60.5 53.2 59.2 52.3 52.3 52.0 67.4 maj 60.6 65.1 52.1 64.1 57.4 58.9 54.2 72.1 jun 67.2 72.8 58.0 72.1 61.0 64.6 59.8 71.2 jul 63.6 66.2 60.4 64.2 62.5 62.2 52.1 67.6 aug 64.4 69.2 54.6 66.5 64.7 60.8 54.6 69.8 sep 61.6 68.5 52.5 65.3 55.6 63.0 55.8 66.7 okt 61.0 67.1 54.9 61.7 58.3 55.8 54.4 67.0 nov 63.7 65.2 61.5 62.9 65.5 59.9 55.6 72.7 dec 67.3 71.6 59.6 68.4 67.9 58.6 53.2 75.2 2007 jan 66.2 70.8 60.9 67.7 63.0 63.3 57.9 73.9 feb 62.7 70.7 59.9 62.6 55.7 61.5 60.1 70.2 mar 59.3 60.5 54.9 61.5 58.2 56.7 56.0 68.8 apr 66.0 73.1 60.0 69.4 57.2 64.6 57.9 66.7 maj 60.8 62.2 59.7 61.9 58.4 66.2 60.3 67.0 jun 62.9 63.0 57.7 65.5 63.7 63.0 55.9 64.5 jul 60.8 64.4 61.7 61.5 54.0 60.6 59.2 65.8 aug 56.8 57.6 59.0 55.0 56.7 52.8 57.9 60.7 sep 58.0 59.0 57.1 54.8 63.2 57.1 52.3 62.0 okt 57.0 55.7 56.6 56.1 60.3 53.0 57.0 68.8 nov 60.7 66.9 54.8 61.0 58.0 58.7 61.3 54.4 dec 62.1 66.7 56.9 61.3 62.9 64.7 62.1 60.2 2008 jan 57.8 59.9 52.6 56.7 62.1 56.2 63.3 67.5 feb 56.4 57.2 54.1 58.5 53.8 58.6 61.2 64.4 mar 54.4 53.9 52.5 53.7 58.3 52.5 59.4 71.5 apr 52.5 53.3 49.2 49.4 60.5 53.1 56.1 61.9 maj 60.7 68.6 50.7 57.4 66.5 55.8 56.6 64.3 jun 52.9 56.5 50.1 48.4 59.1 46.3 64.4 64.6 jul 53.8 58.1 45.9 49.8 63.0 45.4 67.0 60.5 aug 50.3 52.6 49.5 45.5 56.5 48.9 56.8 60.5 sep 51.9 56.2 47.5 46.7 60.1 38.7 57.6 56.3 okt 42.2 43.9 45.6 34.9 49.6 44.1 57.7 47.9 nov 43.7 43.7 49.5 36.9 49.9 35.8 53.4 42.5 dec 38.1 37.5 39.7 36.8 39.5 37.0 45.2 40.3 2009 jan 35.3 33.2 42.3 35.5 30.5 28.3 48.7 33.9 feb 38.2 37.3 38.6 35.9 42.7 34.6 47.4 41.0 mar 40.6 43.9 41.6 42.2 32.5 39.1 48.3 36.8 apr 40.0 41.1 39.0 39.8 40.0 39.0 42.6 46.5 maj 40.7 44.3 42.7 43.6 29.1 38.3 41.0 44.5 juni 42.3 44.0 40.5 46.9 33.8 44.7 35.9 52.2 juli 43.2 45.6 38.7 47.7 36.6 43.2 40.9 55.8 aug 45.5 50.9 40.9 50.5 34.4 47.2 45.1 55.5 sep 48.5 52.6 45.6 55.0 34.8 54.2 48.8 58.7 okt 54.9 61.8 47.1 62.2 41.2 62.5 44.7 61.0 nov 51.2 56.5 47.7 56.7 38.4 57.0 44.5 67.4 dec 47.5 52.3 46.6 49.7 38.4 48.5 52.4 61.3 2010 jan 55.2 59.4 50.7 59.2 47.4 56.2 48.7 61.8 feb 60.9 64.0 53.8 67.5 52.4 60.7 46.4 75.4 mar 61.4 65.0 58.5 63.6 55.7 60.3 56.0 71.9 apr 62.3 66.3 60.9 64.3 55.2 61.1 60.3 74.1 maj 59.4 60.4 59.7 60.5 55.8 58.9 62.8 69.5 juni 60.2 61.9 62.5 61.7 53.0 61.8 62.6 69.8 juli 63.5 67.1 61.6 66.4 55.9 63.6 63.8 72.2 aug 63.7 65.9 62.0 67.7 55.7 63.6 61.6 70.2 sep 60.8 59.4 64.3 63.4 54.6 60.1 63.1 73.4 okt 63.6 64.9 61.6 67.0 57.8 61.2 60.0 76.2 nov 64.0 64.9 58.6 67.5 62.1 63.9 65.6 77.7 dec 65.8 69.5 64.4 65.7 62.8 60.7 63.6 76.9 2011 jan 65.6 70.6 61.2 66.0 62.9 64.7 67.2 77.9 feb 62.0 62.6 62.4 61.2 62.0 58.3 69.0 69.7 mar 60.8 64.4 60.6 58.8 60.0 55.7 64.7 69.7 apr 60.9 62.9 60.2 61.2 58.9 58.2 65.2 67.6 maj 56.7 56.2 58.4 55.4 57.9 50.5 60.3 67.6 juni 53.8 59.0 55.0 48.4 55.4 48.5 58.1 62.9 juli 54.7 55.6 56.1 52.8 55.2 53.8 54.8 63.0
  • 3. Purchasing Managers Index - Services June 2011, continued Silf/Swedbank’s Purchasing Managers’ Index Service Sector, orginal Components of PMI Other indicies Forecast Total index Business Delivery New Employ- Back-log Prices Planned activity times orders ment of orders business activity 2006 jan 53.7 57.0 50.8 53.9 52.3 54.0 46.9 65.6 feb 57.6 63.8 52.6 57.8 54.3 56.9 49.1 63.2 mar 63.6 72.6 51.2 66.7 59.5 66.7 48.8 65.5 apr 59.6 63.6 52.7 63.6 54.6 55.6 53.6 70.9 maj 63.6 69.2 52.9 67.3 60.6 62.5 56.7 76.0 jun 72.3 78.8 61.0 76.8 67.5 68.3 61.0 73.8 jul 58.9 58.1 62.8 55.8 61.6 54.7 52.3 67.4 aug 66.5 71.6 53.4 69.3 68.2 63.6 54.5 69.3 sep 64.0 72.6 53.5 68.6 55.8 64.0 57.0 66.3 okt 60.8 67.0 56.1 61.2 57.1 55.0 53.0 66.0 nov 62.2 64.1 62.0 59.8 64.1 56.5 52.2 69.6 dec 63.6 67.4 57.4 64.9 62.8 56.4 48.9 71.3 2007 jan 60.9 63.3 58.3 62.2 58.2 57.1 59.2 71.4 feb 61.7 68.9 60.0 62.2 53.3 64.0 61.1 71.1 mar 60.6 63.4 52.4 64.6 58.5 59.8 56.1 69.5 apr 68.7 76.2 59.5 73.8 59.5 67.9 59.5 70.2 maj 63.8 66.3 60.5 65.1 61.6 69.8 62.8 70.9 jun 68.0 69.0 60.7 70.2 70.2 66.7 57.1 67.1 jul 56.1 56.3 64.1 53.1 53.1 53.1 59.4 65.6 aug 58.8 60.0 57.8 57.8 60.2 55.6 57.8 60.2 sep 60.4 63.1 58.1 58.1 63.4 58.1 53.5 61.6 okt 56.7 55.6 57.8 55.6 59.1 52.2 55.6 67.8 nov 59.1 65.8 55.3 57.9 56.6 55.3 57.9 51.3 dec 58.4 62.5 54.7 57.8 57.8 62.5 57.8 56.3 2008 jan 52.5 52.4 50.0 51.2 57.3 50.0 64.6 65.0 feb 55.3 55.4 54.2 58.1 51.4 61.1 62.2 65.3 mar 55.8 56.8 50.0 56.8 58.6 55.6 59.5 72.2 apr 55.2 56.4 48.7 53.8 62.8 56.4 57.7 65.4 maj 63.6 72.7 51.5 60.6 69.7 59.4 59.1 68.2 jun 58.0 62.5 53.1 53.1 65.6 50.0 65.6 67.2 jul 49.1 50.0 48.3 41.4 62.1 37.9 67.2 60.3 aug 52.3 55.0 48.3 48.3 60.0 51.7 56.7 60.0 sep 54.3 60.3 48.5 50.0 60.3 39.7 58.8 55.9 okt 42.0 43.8 46.8 34.4 48.4 43.3 56.3 46.9 nov 42.2 42.6 50.0 33.8 48.5 32.4 50.0 39.4 dec 34.4 33.3 37.5 33.3 34.4 34.8 40.9 36.4 2009 jan 30.0 25.7 39.7 30.0 25.7 22.1 50.0 31.4 feb 37.1 35.5 38.7 35.5 40.3 37.1 48.4 41.9 mar 41.9 46.8 39.1 45.3 32.8 42.2 48.4 37.5 apr 42.7 44.2 38.5 44.2 42.3 42.3 44.2 50.0 maj 43.6 48.4 43.5 46.8 32.3 41.9 43.5 48.4 juni 47.3 50.0 43.5 51.6 40.3 48.4 37.1 54.8 juli 38.5 37.5 41.1 39.3 35.7 35.7 41.1 55.6 aug 47.5 53.3 39.7 53.3 37.9 50.0 45.0 55.0 sep 50.9 56.7 46.6 58.3 35.0 55.2 50.0 58.3 okt 54.7 61.7 48.3 61.7 40.0 61.7 43.3 60.0 nov 49.7 55.4 48.2 53.6 37.0 53.6 41.1 64.3 dec 43.7 48.1 44.4 46.2 33.3 46.3 48.1 57.4 2010 jan 49.9 51.9 48.1 53.7 42.6 50.0 50.0 59.3 feb 59.8 62.2 53.9 67.1 50.0 63.2 47.4 76.3 mar 62.7 67.9 56.0 66.7 56.0 63.4 56.1 72.6 apr 65.0 69.4 60.4 68.7 57.5 64.4 61.9 77.6 maj 62.3 64.5 60.5 63.7 59.0 62.5 65.3 73.4 juni 65.2 67.9 65.5 66.4 59.5 65.5 63.8 72.4 juli 58.9 59.0 64.0 58.0 55.0 56.1 64.0 72.0 aug 65.8 68.3 60.8 70.5 59.2 66.4 61.5 69.7 sep 63.2 63.5 65.3 66.7 54.8 61.1 64.3 73.0 okt 63.4 64.8 62.8 66.5 56.6 60.4 58.6 75.2 nov 62.5 63.8 59.1 64.4 60.7 60.5 62.2 74.6 dec 62.1 65.3 62.2 62.2 57.7 58.5 59.3 73.0 2011 jan 60.3 63.1 58.6 60.5 58.1 58.5 68.5 75.4 feb 60.9 60.8 62.5 60.8 59.6 60.8 70.0 70.6 mar 62.2 67.3 58.1 61.9 60.3 58.8 64.8 70.4 apr 63.6 66.0 59.7 65.6 61.2 61.5 66.8 71.1 maj 59.6 60.3 59.2 58.6 61.1 54.1 62.8 71.5 juni 58.8 65.0 58.0 53.1 61.9 52.2 59.3 65.5 juli 50.0 47.5 58.5 44.4 54.3 46.3 55.0 62.8 Magnus Alvesson, Swedbank, Economic Research Department, Tel. +46 (0)8-5859 4133 Administration, Tel. +46 (0)8-5859 7740, ek.sekr@swedbank.se Sebastian Bergfelt, Silf, +46 (0)73-944 6450, professionals@silf.se
  • 4. Silf/Swedbank’s Purchasing Managers’ Index – Services - objectives and methodology History Silf and Swedbank AB publ. made the first joint – internal – calculation of the “Purchasing Managers’ Index” for the service sector of the four indexes (PMI) during 2005. The model for PMI – Services is the U.S. based Non-Manufacturing Index and the Swedish PMI, which has been published since November 1994 Participants About 200 purchasing managers in the service sector. Publication Third weekday of each month, 8:30 am. Analysis Period Comparison with previous month. Composition of PMI – Services (%) New orders (within the company) 35 Business activity (within the company) 25 Employment (within the company) 20 Suppliers’ Delivery Times 20 Other leading indicators (not included in PMI – Services) Backlog of Orders Suppliers’ intermediate goods prices Planned business activity next six months Objective Quick economic indicator Simple statistics Statistics with relatively short publication intervals Constant contact with a well-informed professional group Calculation According to “diffusion index”. Positive changes are noted in percent for the four sub indexes. The percentage of unchanged replies, multiplied by 0.5, is added to this figure. Then the different sub indexes are weighted as described above to reach the total index. The Purchasing Managers’ Index – Services does not indicate activity levels but rather monthly changes in activity in the service sector. “Break-even” The dividing line between growth and decline – in line with US praxis – has been drawn at a total index of 50. However, this boundary or “neutral growth zone” should not be applied excessively. Rather, “Break-even” at 50 indicates a target value. We believe we have used reliable sources and procedures to generate and analyze the Purchasing Managers’ Index (PMI – Services). However, Swedbank AB (publ) and SILF (earlier Organisationen för Inköp och Logistik, /I&L/ – The Organization for Purchasing and Logistics) cannot guarantee the accuracy or completeness of the analyses and cannot be responsible for any errors or omissions in the basic data or processing thereof. The reader should base any decisions on other background material as well. Swedbank AB (publ), SILF. their employees, and other coworkers accept no liability whatsoever for any direct or consequential loss or injury of any kind arising from any errors or omissions in the analyses presented in the Purchasing Managers’ Index – Services.