Purchasing Managers' Index Services - September 5, 2012
•
0 j'aime•368 vues

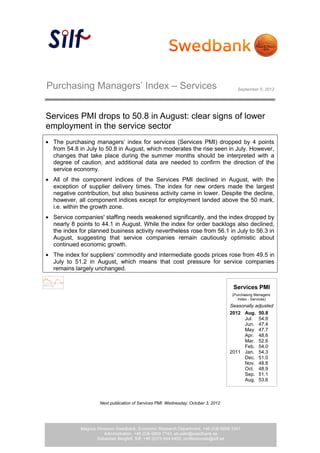
The Services PMI dropped from 54.8 in July to 50.8 in August, moderating the rise seen in July. All component indices declined except supplier delivery times. The employment index dropped significantly to 44.1, indicating weaker staffing needs among service companies. Despite the decline, indices except employment remained above 50, in the growth zone. Service companies remain cautiously optimistic about continued economic growth as the planned business activity index rose slightly.

Recommandé
Recommandé
Contenu connexe
Tendances
Tendances (20)
En vedette
En vedette (8)
Similaire à Purchasing Managers' Index Services - September 5, 2012
Similaire à Purchasing Managers' Index Services - September 5, 2012 (12)
Plus de Swedbank
Plus de Swedbank (20)
Dernier
Dernier (20)
Purchasing Managers' Index Services - September 5, 2012
- 1. Purchasing Managers’ Index – Services September 5, 2012 Services PMI drops to 50.8 in August: clear signs of lower employment in the service sector The purchasing managers’ index for services (Services PMI) dropped by 4 points from 54.8 in July to 50.8 in August, which moderates the rise seen in July. However, changes that take place during the summer months should be interpreted with a degree of caution, and additional data are needed to confirm the direction of the service economy. All of the component indices of the Services PMI declined in August, with the exception of supplier delivery times. The index for new orders made the largest negative contribution, but also business activity came in lower. Despite the decline, however, all component indices except for employment landed above the 50 mark, i.e. within the growth zone. Service companies' staffing needs weakened significantly, and the index dropped by nearly 8 points to 44.1 in August. While the index for order backlogs also declined, the index for planned business activity nevertheless rose from 56.1 in July to 56.3 in August, suggesting that service companies remain cautiously optimistic about continued economic growth. The index for suppliers’ commodity and intermediate goods prices rose from 49.5 in July to 51.2 in August, which means that cost pressure for service companies remains largely unchanged. Services PMI (Purchasing Managers’ Index - Services) Seasonally adjusted 2012 Aug. 50.8 Jul. 54.8 Jun. 47.4 May 47.7 Apr. 48.6 Mar. 52.6 Feb. 54.0 2011 Jan. 54.3 Dec. 51.0 Nov. 48.8 Oct. 48.9 Sep. 51.1 Aug. 53.6 Next publication of Services PMI: Wednesday, October 3, 2012 Magnus Alvesson Swedbank, Economic Research Department, +46 (0)8-5859 3341 1 (4) Administration, +46 (0)8-5859 7740, ek.sekr@swedbank.se Sebastian Bergfelt, Silf, +46 (0)73-944 6450, professionals@silf.se
- 2. Silf/Swedbank’s Purchasing Managers’ Index Service Sector. seasonally adjusted Components of PMI Other indicies Forecast Total index Business Delivery New Employ- Back -log Prices Planned activity times orders ment of orders business 2007 jan 65.6 70.4 60.9 66.7 62.5 62.1 57.6 73.7 feb 62.2 69.8 60.0 62.0 55.2 61.6 59.9 69.6 mar 58.9 60.0 54.5 61.1 58.0 56.2 55.7 67.9 apr 66.1 73.5 59.6 69.7 57.2 64.5 57.7 66.3 may 61.0 62.4 59.4 62.4 58.4 66.7 60.1 66.5 jun 63.1 63.0 57.6 65.7 64.2 63.3 55.6 64.3 jul 59.6 63.0 61.3 60.0 53.1 59.0 58.9 65.2 aug 57.2 57.9 59.0 55.0 58.5 53.1 58.6 61.5 sep 58.5 59.6 57.5 55.7 63.1 57.6 52.8 62.7 oct 57.6 56.6 56.9 57.2 60.3 53.7 57.4 69.9 nov 61.2 67.4 55.4 61.7 58.3 59.3 61.4 55.2 dec 62.1 66.9 57.1 61.2 62.8 64.8 62.0 60.3 2008 jan 57.2 59.5 52.6 55.7 61.6 55.0 63.0 67.3 feb 55.8 56.3 54.2 57.9 53.3 58.7 61.0 63.8 mar 54.0 53.4 52.1 53.3 58.1 52.0 59.1 70.6 apr 52.7 53.7 48.8 49.7 60.5 53.0 55.9 61.5 may 60.8 68.8 50.4 57.9 66.5 56.3 56.4 63.8 jun 53.0 56.5 50.0 48.6 59.6 46.6 64.1 64.4 jul 52.6 56.7 45.5 48.3 62.1 43.8 66.7 59.9 aug 50.7 52.9 49.5 45.5 58.3 49.2 57.5 61.3 sep 52.4 56.8 47.9 47.6 60.0 39.2 58.1 57.0 oct 42.9 44.8 45.9 36.0 49.6 44.8 58.1 49.0 nov 44.3 44.2 50.1 37.6 50.2 36.4 53.5 43.3 dec 38.1 37.7 39.9 36.7 39.4 37.1 45.1 40.4 2009 jan 34.7 32.8 42.3 34.5 30.0 27.1 48.4 33.7 feb 37.6 36.4 38.7 35.3 42.2 34.7 47.2 40.4 mar 40.2 43.4 41.2 41.8 32.3 38.6 48.0 35.9 apr 40.1 41.5 38.6 40.1 40.0 38.9 42.4 46.1 may 40.9 44.5 42.4 44.1 29.1 38.8 40.8 44.0 jun 42.4 44.0 40.4 47.1 34.3 45.0 35.6 52.0 jul 42.0 44.2 38.3 46.2 35.7 41.6 40.6 55.2 aug 45.9 51.2 40.9 50.5 36.2 47.5 45.8 56.3 sep 49.0 53.2 46.0 55.9 34.7 54.7 49.3 59.4 oct 55.6 62.7 47.4 63.3 41.2 63.2 45.1 62.1 nov 51.7 57.0 48.3 57.4 38.7 57.6 44.6 68.2 dec 47.5 52.5 46.8 49.6 38.3 48.6 52.3 61.4 2010 jan 54.7 59.0 50.7 58.2 46.9 55.0 48.4 61.6 feb 60.3 63.1 53.9 66.9 51.9 60.8 46.2 74.8 mar 60.9 64.5 58.1 63.2 55.5 59.8 55.7 71.0 apr 62.4 66.7 60.5 64.6 55.2 61.0 60.1 73.7 may 59.5 60.6 59.4 61.0 55.8 59.4 62.6 69.0 jun 60.3 61.9 62.4 61.9 53.5 62.1 62.3 69.6 jul 62.4 65.7 61.2 64.9 55.0 62.0 63.5 71.6 aug 64.1 66.2 62.0 67.7 57.5 63.9 62.3 71.0 sep 61.3 60.0 64.7 64.3 54.5 60.6 63.6 74.1 oct 64.2 65.8 61.9 68.1 57.8 61.9 60.4 77.3 nov 64.5 65.4 59.2 68.2 62.4 64.5 65.7 78.5 dec 65.9 69.7 64.6 65.6 62.7 60.8 63.5 77.0 2011 jan 65.0 70.2 61.2 65.0 62.4 63.5 66.9 77.7 feb 61.4 61.7 62.5 60.6 61.5 58.4 68.8 69.1 mar 60.4 63.9 60.2 58.4 59.8 55.2 64.4 68.8 apr 61.1 63.3 59.8 61.5 58.9 58.1 65.0 67.2 may 56.9 56.4 58.1 55.9 57.9 51.0 60.1 67.1 jun 53.9 59.0 54.9 48.6 55.9 48.8 57.8 62.7 jul 53.5 54.2 55.7 51.3 54.3 52.2 54.5 62.4 aug 53.6 53.5 55.5 53.2 52.6 49.2 55.1 59.8 sep 51.1 52.2 51.6 48.0 54.5 47.7 54.1 57.2 oct 48.9 48.7 50.9 45.3 53.5 45.6 52.7 53.5 nov 48.8 49.9 49.2 46.8 50.8 45.7 53.5 54.3 dec 51.0 50.6 50.5 50.6 52.7 47.6 54.2 57.7 2012 jan 54.3 54.3 50.7 56.4 54.3 55.5 54.9 58.8 feb 54.0 57.2 50.0 54.1 53.8 48.1 53.7 60.6 mar 52.6 54.3 52.6 52.4 50.9 51.4 53.7 61.1 apr 48.6 47.8 51.5 47.3 49.1 48.0 51.9 56.7 may 47.7 48.8 49.8 45.5 48.2 44.6 50.9 56.4 jun 47.4 49.4 48.3 46.9 44.9 45.2 50.8 54.0 jul 54.8 57.7 49.2 57.4 52.0 55.9 49.5 56.1 aug 50.8 55.0 50.0 52.2 44.1 50.8 51.2 56.3 2 (4)
- 3. Silf/Swedbank’s Purchasing Managers’ Index Service Sector, orginal Components of PMI Other indicies Forecast Total index Business Delivery New Employ- Back -log Prices Planned activity times orders ment of orders business activity 2007 jan 60.9 63.3 58.3 62.2 58.2 57.1 59.2 71.4 feb 61.7 68.9 60.0 62.2 53.3 64.0 61.1 71.1 mar 60.6 63.4 52.4 64.6 58.5 59.8 56.1 69.5 apr 68.7 76.2 59.5 73.8 59.5 67.9 59.5 70.2 may 63.8 66.3 60.5 65.1 61.6 69.8 62.8 70.9 jun 68.0 69.0 60.7 70.2 70.2 66.7 57.1 67.1 jul 56.1 56.3 64.1 53.1 53.1 53.1 59.4 65.6 aug 58.8 60.0 57.8 57.8 60.2 55.6 57.8 60.2 sep 60.4 63.1 58.1 58.1 63.4 58.1 53.5 61.6 oct 56.7 55.6 57.8 55.6 59.1 52.2 55.6 67.8 nov 59.1 65.8 55.3 57.9 56.6 55.3 57.9 51.3 dec 58.4 62.5 54.7 57.8 57.8 62.5 57.8 56.3 2008 jan 52.5 52.4 50.0 51.2 57.3 50.0 64.6 65.0 feb 55.3 55.4 54.2 58.1 51.4 61.1 62.2 65.3 mar 55.8 56.8 50.0 56.8 58.6 55.6 59.5 72.2 apr 55.2 56.4 48.7 53.8 62.8 56.4 57.7 65.4 may 63.6 72.7 51.5 60.6 69.7 59.4 59.1 68.2 jun 58.0 62.5 53.1 53.1 65.6 50.0 65.6 67.2 jul 49.1 50.0 48.3 41.4 62.1 37.9 67.2 60.3 aug 52.3 55.0 48.3 48.3 60.0 51.7 56.7 60.0 sep 54.3 60.3 48.5 50.0 60.3 39.7 58.8 55.9 oct 42.0 43.8 46.8 34.4 48.4 43.3 56.3 46.9 nov 42.2 42.6 50.0 33.8 48.5 32.4 50.0 39.4 dec 34.4 33.3 37.5 33.3 34.4 34.8 40.9 36.4 2009 jan 30.0 25.7 39.7 30.0 25.7 22.1 50.0 31.4 feb 37.1 35.5 38.7 35.5 40.3 37.1 48.4 41.9 mar 41.9 46.8 39.1 45.3 32.8 42.2 48.4 37.5 apr 42.7 44.2 38.5 44.2 42.3 42.3 44.2 50.0 may 43.6 48.4 43.5 46.8 32.3 41.9 43.5 48.4 jun 47.3 50.0 43.5 51.6 40.3 48.4 37.1 54.8 jul 38.5 37.5 41.1 39.3 35.7 35.7 41.1 55.6 aug 47.5 53.3 39.7 53.3 37.9 50.0 45.0 55.0 sep 50.9 56.7 46.6 58.3 35.0 55.2 50.0 58.3 oct 54.7 61.7 48.3 61.7 40.0 61.7 43.3 60.0 nov 49.7 55.4 48.2 53.6 37.0 53.6 41.1 64.3 dec 43.7 48.1 44.4 46.2 33.3 46.3 48.1 57.4 2010 jan 49.9 51.9 48.1 53.7 42.6 50.0 50.0 59.3 feb 59.8 62.2 53.9 67.1 50.0 63.2 47.4 76.3 mar 62.7 67.9 56.0 66.7 56.0 63.4 56.1 72.6 apr 65.0 69.4 60.4 68.7 57.5 64.4 61.9 77.6 may 62.3 64.5 60.5 63.7 59.0 62.5 65.3 73.4 jun 65.2 67.9 65.5 66.4 59.5 65.5 63.8 72.4 jul 58.9 59.0 64.0 58.0 55.0 56.1 64.0 72.0 aug 65.8 68.3 60.8 70.5 59.2 66.4 61.5 69.7 sep 63.2 63.5 65.3 66.7 54.8 61.1 64.3 73.0 oct 63.4 64.8 62.8 66.5 56.6 60.4 58.6 75.2 nov 62.5 63.8 59.1 64.4 60.7 60.5 62.2 74.6 dec 62.1 65.3 62.2 62.2 57.7 58.5 59.3 73.0 2011 jan 60.3 63.1 58.6 60.5 58.1 58.5 68.5 75.4 feb 60.9 60.8 62.5 60.8 59.6 60.8 70.0 70.6 mar 62.2 67.3 58.1 61.9 60.3 58.8 64.8 70.4 apr 63.6 66.0 59.7 65.6 61.2 61.5 66.8 71.1 may 59.6 60.3 59.2 58.6 61.1 54.1 62.8 71.5 jun 58.8 65.0 58.0 53.1 61.9 52.2 59.3 65.5 jul 50.0 47.5 58.5 44.4 54.3 46.3 55.0 62.8 aug 55.2 55.6 54.3 56.0 54.3 51.7 54.3 58.5 sep 53.0 55.7 52.2 50.4 54.8 48.2 54.8 56.1 oct 48.0 47.7 51.8 43.7 52.3 44.1 50.9 51.4 nov 46.8 48.3 49.1 43.0 49.1 41.7 50.0 50.4 dec 47.2 46.2 48.1 47.2 47.7 45.3 50.0 53.7 2012 jan 49.6 47.2 48.1 51.9 50.0 50.5 56.5 56.5 feb 53.5 56.3 50.0 54.3 51.9 50.5 54.9 62.1 mar 54.4 57.7 50.5 55.9 51.4 55.0 54.1 62.7 apr 51.2 50.5 51.4 51.4 51.4 51.4 53.7 60.6 may 50.5 52.7 50.9 48.2 51.4 47.7 53.6 60.8 jun 52.3 55.4 51.4 51.4 50.9 48.6 52.3 56.8 jul 51.2 51.0 52.0 50.5 52.0 50.0 50.0 56.5 aug 52.3 57.1 48.8 55.0 45.8 53.3 50.4 55.0 3 (4)
- 4. Silf/Swedbank’s Purchasing Managers’ Index – Services - objectives and methodology History Silf and Swedbank AB publ. made the first joint – internal – calculation of the “Purchasing Managers’ Index” for the service sector of the four indexes (PMI) during 2005. The model for PMI – Services is the U.S. based Non-Manufacturing Index and the Swedish PMI, which has been published since November 1994 Participants About 200 purchasing managers in the service sector. Publication Third weekday of each month, 8:30 am. Analysis Period Comparison with previous month. Composition of PMI – Services (%) New orders (within the company) 35 Business activity (within the company) 25 Employment (within the company) 20 Suppliers’ Delivery Times 20 Other leading indicators (not included in PMI – Services) Backlog of Orders Suppliers’ intermediate goods prices Planned business activity next six months Objective Quick economic indicator Simple statistics Statistics with relatively short publication intervals Constant contact with a well-informed professional group Calculation According to “diffusion index”. Positive changes are noted in percent for the four sub indexes. The percentage of unchanged replies, multiplied by 0.5, is added to this figure. Then the different sub indexes are weighted as described above to reach the total index. The Purchasing Managers’ Index – Services does not indicate activity levels but rather monthly changes in activity in the service sector. “Break-even” The dividing line between growth and decline – in line with US praxis – has been drawn at a total index of 50. However, this boundary or “neutral growth zone” should not be applied excessively. Rather, “Break-even” at 50 indicates a target value. We believe we have used reliable sources and procedures to generate and analyze the Purchasing Managers’ Index (PMI – Services). However, Swedbank AB (publ) and SILF (earlier Organisationen för Inköp och Logistik, /I&L/ – The Organization for Purchasing and Logistics) cannot guarantee the accuracy or completeness of the analyses and cannot be responsible for any errors or omissions in the basic data or processing thereof. The reader should base any decisions on other background material as well. Swedbank AB (publ), SILF. their employees, and other coworkers accept no liability whatsoever for any direct or consequential loss or injury of any kind arising from any errors or omissions in the analyses presented in the Purchasing Managers’ Index – Services. 4 (4)