TEST BANK For Corporate Finance, 13th Edition By Stephen Ross, Randolph Weste...
Swedbank's Year-end Report 2013
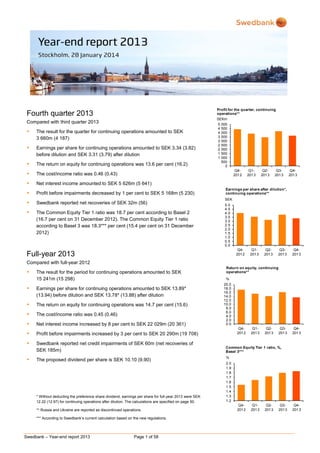
1. Fourth quarter 2013
Compared with third quarter 2013
The result for the quarter for continuing operations amounted to SEK
3 660m (4 187)
Earnings per share for continuing operations amounted to SEK 3.34 (3.82)
before dilution and SEK 3.31 (3.79) after dilution
The return on equity for continuing operations was 13.6 per cent (16.2)
The cost/income ratio was 0.46 (0.43)
Net interest income amounted to SEK 5 626m (5 641)
Profit before impairments decreased by 1 per cent to SEK 5 168m (5 230)
Swedbank reported net recoveries of SEK 32m (56)
The Common Equity Tier 1 ratio was 18.7 per cent according to Basel 2
(16.7 per cent on 31 December 2012). The Common Equity Tier 1 ratio
according to Basel 3 was 18.3*** per cent (15.4 per cent on 31 December
2012)
Profit for the quarter, continuing
operations**
SEKm
5 000
4 500
4 000
3 500
3 000
2 500
2 000
1 500
1 000
500
0
Q4Q1Q2Q3201 2 201 3 201 3 201 3
Q4201 3
Earnings per share after dilution*,
continuing operations**
SEK
5.0
4.5
4.0
3.5
3.0
2.5
2.0
1.5
1.0
0.5
0.0
Q4201 2
Full-year 2013
Q1201 3
Q2201 3
Q3201 3
Q4201 3
Compared with full-year 2012
The result for the period for continuing operations amounted to SEK
15 241m (15 298)
Earnings per share for continuing operations amounted to SEK 13.89*
(13.94) before dilution and SEK 13.78* (13.88) after dilution
The return on equity for continuing operations was 14.7 per cent (15.6)
The cost/income ratio was 0.45 (0.46)
Net interest income increased by 8 per cent to SEK 22 029m (20 361)
Swedbank reported net credit impairments of SEK 60m (net recoveries of
SEK 185m)
%
20.0
18.0
16.0
14.0
12.0
10.0
8.0
6.0
4.0
2.0
0.0
Profit before impairments increased by 3 per cent to SEK 20 290m (19 708)
Return on equity, continuing
operations**
The proposed dividend per share is SEK 10.10 (9.90)
* Without deducting the preference share dividend, earnings per share for full-year 2013 were SEK
12.22 (12.97) for continuing operations after dilution. The calculations are specified on page 50.
** Russia and Ukraine are reported as discontinued operations.
*** According to Swedbank’s current calculation based on the new regulations.
Swedbank – Year-end report 2013
Page 1 of 58
Q4201 2
Q1201 3
Q2201 3
Q3201 3
Q4201 3
Common Equity Tier 1 ratio, %,
Basel 3***
%
2.0
1.9
1.8
1.7
1.6
1.5
1.4
1.3
1.2
Q4201 2
Q1201 3
Q2201 3
Q3201 3
Q4201 3
2. CEO Comment
There were a number of signs in 2013 that the global
economy is slowly recovering, though much points to
the fact that the recovery is fragile. In our home
markets, economic conditions remained stable.
Economic development and credit demand will be
affected as central banks gradually phase out their
stimulus measures. In parts of Europe, high debt levels
pose structural challenges. In Sweden, a housing
shortage in major cities continues to push debt levels
higher, impeding households and potential growth.
Continued stable result
Last year was financially successful for us. Swedbank
posted a profit for continuing operations of SEK 15.2bn
for the full year, compared with SEK 15.3bn in 2012.
Fourth quarter profit was weighed down slightly by writeoffs in Ektornet, tax expenses and redeployment
provisions. Large Corporates & Institutions reported
strong numbers and the most recent Greenwich survey
of large companies shows that the business area’s
offering is appreciated by prioritised customers in both
Sweden and Norway. Baltic Banking also performed
well, with increasing customer activity. This indicates
that our long-term engagement in the Baltic countries is
producing results and is appreciated. Latvia introduced
the euro at the start of this year. This improves
opportunities for future business. Lithuania also appears
to be following the two other Baltic countries into the
EMU. We are also pleased to see that we have
strengthened our market position in Swedish
mortgages.
Stress tests by the Riksbank and the Swedish Financial
Supervisory Authority show that Swedbank is Sweden's
strongest bank financially with the lowest overall risks.
Swedbank’s low risk level contributed to a further
improvement in our relative costs for capital market
funding during the year. Together with our focus on cost
efficiency, this provides us with the room to invest,
which is needed if we are to remain a modern and
attractive bank in the future.
A bank in your pocket
During the year, our customers became more active in
our digital channels. Close to four hundred thousand
registered for the Mobile Bank and now have an easyto-use bank branch in their pocket. We have specially
designed Swedbank apps for companies and younger
customers. We have continued to improve the digital
platforms with smart new functions. For example,
customers can now save “instantly” in the Mobile Bank
and put away the old security token thanks to Mobile
Bank ID. 2013 was also the year when the Swedish
people really began “swishing” payments using their
mobile phones.
We are seeing customer preferences change in other
parts of our business as well. One obvious example is
how the number of card purchases continues to rise on
an annual basis at the same time that the number of
ATM withdrawals and the total withdrawn amounts are
declining. Our deposit and lending volumes have risen.
Loan volumes saw the highest increase in SEK on a
quarterly basis since I joined Swedbank. We saw our
market position for Swedish mortgages strengthen
without increasing our risk taking, while business
lending volumes also rose during the quarter.
Swedbank – Year-end report 2013
Page 2 of 58
Increased availability and service
We are now devoting a larger portion of resources to
improving the availability of advisory services and
customer meetings. Already in 2013, we hired more
advisors in Sweden. Resources tied to centralised staff
functions are being reduced. The changes are intended
to help expand business with our customers, as part of
this, we are working actively with all forms of information
and customer feedback.
Capital and dividend
We acknowledge the regulatory work in Sweden and the
EU to reduce the risk of another financial crisis. It is
important, however, that the new requirements strike a
balance, so that they do not have any undesirable
effects. If the Swedish requirements are too stringent,
there is a risk they could slow the economy’s recovery
and impede the creation of new jobs and housing. We
want to be a stable, secure bank at the same time that
we want to help to finance new housing and business
investment.
Our Common Equity Tier 1 ratio increased during the
year to 18.3 per cent (15.4), according to Basel 3, after
deducting the anticipated dividend. We are now awaiting
a decision on future capital requirements, so that we
can then set a new capital target. Based on indicated
regulatory changes, our capital target will be higher than
we previously assumed.
In line with the dividend policy, Swedbank’s Board of
Directors is proposing that the Annual General Meeting
resolve to pay the shareholders a dividend of SEK 10.10
(9.90) per share for 2013. The dividend policy remains
unchanged.
Outlook
With economic uncertainty and persistent structural
problems in parts of the world, we are humble in our
expectations and are prepared for an environment with
low interest rates and weak credit demand. Our total
expenses will therefore be kept at the same level in
2014 as in 2013 and we will continue to focus on
profitability and improved efficiency.
Michael Wolf
President and CEO
3. Table of contents
Page
Financial summary
4
Overview
5
Market
5
Important events during the quarter
5
Fourth quarter 2013 compared with third quarter 2013
5
Result
5
Full-year 2013 compared with full-year 2012
6
Result
6
Credit and asset quality
7
Funding and liquidity
8
Ratings
8
Capital and capital adequacy
9
Market risk
10
Operational risks
10
Other events
11
Events after 31 December 2013
11
Business segments
Swedish Banking
12
Large Corporates & Institutions
14
Baltic Banking
16
Group Functions & Other
18
Eliminations
20
Product areas
21
Financial information
Group
Income statement, condensed
26
Statement of comprehensive income, condensed
27
Key ratios
27
Balance sheet, condensed
28
Statement of changes in equity, condensed
29
Cash flow statement, condensed
30
Notes
30
Parent company
53
Signatures of the Board of Directors and the President
57
Review report
57
Contact information
58
More detailed information can be found in Swedbank’s fact book, www.swedbank.com/ir, under Financial information and
publications.
Swedbank – Year-end report 2013
Page 3 of 58
4. Financial summary
Income statement
SEKm
Q4
2013
Q3
2013
Q4
2012
%
Full-year
2013
Full-year
2012
%
Net interest income
Net commissions
Net gains and losses on financial items at fair value
Other income
Total income
5 626
2 699
461
866
9 652
5 641
2 520
170
894
9 225
-3
5
5 346
2 502
830
759
9 437
5
8
-44
14
2
22 029
10 132
1 484
3 293
36 938
20 361
9 614
3 073
3 220
36 268
8
5
-52
2
2
Staff costs
Other expenses
Total expenses
Profit before impairments
2 574
1 910
4 484
5 168
2 328
1 667
3 995
5 230
11
15
12
-1
2 264
1 878
4 142
5 295
14
2
8
-2
9 651
6 997
16 648
20 290
9 238
7 322
16 560
19 708
4
-4
1
3
Impairment of intangible assets
Impairment of tangible assets
Credit impairments
Operating profit
12
311
-32
4 877
0
95
-56
5 191
-29
-43
-6
17
141
-76
5 213
-58
-6
182
693
60
19 355
20
407
-185
19 466
Tax expense
Profit for the period from continuing operations
1 212
998
21
786
54
4 099
4 157
-1
-13
4 427
-17
15 256
15 309
0
-174
-72
-2 340
-997
%
0
7
70
-1
3 665
4 193
Profit for the period from discontinued operations, after tax
-48
-15
Profit for the period
Profit for the period attributable to the shareholders of
Swedbank AB
3 617
4 178
-13
4 253
-15
12 916
14 312
-10
3 612
4 172
-13
4 252
-15
12 901
14 304
-10
Key ratios and data per share
Q4
2013
Q3
2013
Q4
2012
Return on equity, continuing operations, %
Return on equity, total operations, %
13.6
13.4
16.2
16.1
17.5
16.9
14.7
12.5
15.6
14.6
3.34
3.82
4.03
13.89
13.94
3.31
3.79
4.01
13.78
13.88
0.46
0.43
0.44
0.45
0.46
203
202
212
203
212
18.3
19.6
20.7
18.0
19.3
20.4
15.4
16.8
18.5
18.3
19.6
20.7
15.4
16.8
18.5
18.7
19.6
20.1
18.8
19.7
20.2
16.7
18.1
19.0
18.7
19.6
20.1
16.7
18.1
19.0
-0.01
0.55
54
-0.02
0.69
53
-0.02
1.05
62
0.00
0.55
54
-0.01
1.05
62
31 Dec
2013
31 Dec
2012
%
1 265
621
110
1 821
1 239
580
103
1 847
2
7
6
-1
441
452
487
464
-10
-3
Earnings per share before dilution,
continuing operations, SEK 1)
Earnings per share after dilution,
continuing operations, SEK 1)
Cost/income ratio
Loan/deposit ratio, %
Common Equity Tier 1 ratio, %, Basel 3
Tier 1 capital ratio, %, Basel 3 2)
Capital adequacy ratio, %, Basel 3 2)
2)
Common Equity Tier 1 ratio, %, Basel 2
Tier 1 capital ratio, %, Basel 2
Capital adequacy ratio, %, Basel 2
Credit impairment ratio, %
Share of impaired loans, gross, %
Total provision ratio for impaired loans, %
Balance sheet data
SEKbn
Loans to the public
Deposits and borrowings from the public
Shareholders' equity
Total assets
Risk weighted assets, Basel 3 2)
Risk weighted assets, Basel 2
1)
Full-year Full-year
2013
2012
After deducting the preference share dividend, earnings per share for full-year 2013 were SEK 12.22 (12.97) for continuing operations after dilution. The
calculations are specified on page 50.
2)
According to Swedbank’s current calculation based on the new regulations.
The key ratios are based on profit and shareholders’ equity allocated to shareholders of Swedbank.
Swedbank – Year-end report 2013
Page 4 of 58
5. (OMXRGI) by 16 per cent and the Vilnius stock
exchange (OMXVGI) by 19 per cent.
Overview
Market
Important events during the quarter
Global growth strengthened in 2013. Several major
economies such as the US and the UK were positive
surprises, while the trend in emerging economies was
quite the opposite. In Europe, the EMU countries were
able to leave the recession behind, and a growing
number of indicators pointed during the autumn to a
continued recovery.
Long-term bond yields rose during the year following a
stronger US economy and expectations that the Federal
Reserve would decide to taper its bond buying, which it
did in December. Global inflation fell during the year due
to low resource utilisation and declining commodity
prices. As a result, deflation concerns grew in the EMU
countries. In November the ECB cut its benchmark rate
to 0.25 per cent. Low inflation and high unemployment
are challenges for central banks and are delaying any
rate hikes.
Growth in the Swedish economy in 2013 was weaker
than what Swedbank had forecast. GDP growth
averaged 0.8 per cent during the first three quarters of
the year. Despite a brighter labour market outlook and
positive wealth appreciation – with rising equity and
home prices – consumer spending rose surprisingly
little. Exports fell across the board. On the positive side,
investments climbed, especially in housing. Low global
inflation pressures and falling Swedish service prices
contributed to significantly lower inflation than expected.
The Riksbank cut the discount rate to 0.75 per cent in
December.
Of the three Baltic countries, Latvia grew the fastest in
2013. Third quarter GDP growth was 4.5 per cent in
Latvia, followed by 2.2 per cent in Lithuania and 0.7 per
cent in Estonia. Strong Latvian consumption growth
stood out. The rapid decline in unemployment, higher
wage increases and very low inflation strengthened
household purchasing power. Previously strong exports
slowed in 2013. On 1 January 2014 Latvia joined the
EMU. The effects are likely to be limited in the short
term, but could reduce the country’s vulnerability to
external disruptions in the longer run. Estonia joined the
EMU on 1 January 2012, and Lithuania is also poised
for EMU membership.
Growth in the Lithuanian economy is increasingly being
driven by stronger domestic demand. In 2013
investments accounted for the biggest increase.
Households benefited from the improved labour market
at the same time that real wages rose at an accelerating
pace due to low inflation. Growth in the industrial sector
was slowed by weak external demand, but also for
industry-specific reasons.
Slower growth in the Estonian economy is mainly due to
weaker investment and export growth. Households also
account for the majority of growth here, driven by a
stronger labour market and rising wages. At the same
time rapidly falling unemployment and rising wage costs
in Estonia, as well as in the other Baltic economies, are
a challenge to the competitiveness of these countries.
The Stockholm stock exchange (OMXSPI) gained 23
per cent during the year. The Tallinn stock exchange
(OMXTGI) rose by 11 per cent, the Riga stock exchange
Swedbank – Year-end report 2013
Page 5 of 58
The Board of Directors has proposed a dividend of SEK
10.10 (9.90) per share for the financial year 2013. This
corresponds to a payout ratio of 75 per cent, excluding
the cumulative negative translation difference of SEK
1 875m that was reclassified from other comprehensive
income to profit and loss in connection with the sale of
Swedbank’s Ukrainian subsidiary. This was because the
reclassification affected the bank’s capital, capitalisation
or cash flow in 2008-2009 rather than in 2013.
The Riksbank’s latest stability report from November
(Financial Stability 2013:2) indicates that Swedbank’s
Common Equity Tier 1 ratio was the least affected in a
stress test of Sweden’s four major banks.
Fourth quarter 2013
Compared with third quarter 2013
Result
Profit before impairments decreased by 1 per cent to
SEK 5 168m (5 230). LC&I and Group Treasury within
Group Functions & Other contributed positively. Profit
before impairments decreased within Swedish Banking,
but was stable within Baltic Banking.
Profit before
impairments
by business segment
SEKm
Swedish Banking
Large Corporates &
Institutions
Baltic Banking
Group Functions & Other
Total excl FX effects
FX effects
Total
Q4
2013
Q3
2013
Q4
2012
3 003
3 102
2 781
1 109
850
206
5 168
992
858
282
5 234
-4
5 230
1 094
678
742
5 296
-1
5 295
5 168
Quarterly profit was SEK 3 612m (4 172), down 13 per
cent, mainly due to higher tangible assets writedowns
and tax expenses. The result for continuing operations
was SEK 3 660m (4 187). The result for discontinued
operations was SEK -48m (-15) and mainly consists of
the result from the Russian operations. The Ukrainian
operations were sold during the second quarter.
Net recoveries amounted to SEK 32m (56), mainly due
to higher net recoveries within Baltic Banking. LC&I also
reported net recoveries during the fourth quarter, while
Swedish Banking reported higher credit impairments
than in the third quarter.
Tangible asset writedowns amounted to SEK 311m (95)
and mainly relate to the writedown of Ektornet’s property
values. Intangible asset writedowns during the quarter
amounted to SEK 12m (0), the large part of which
related to writedowns of IT systems within Group
Products.
The return on equity for continuing operations was 13.6
per cent (16.2). The cost/income ratio was 0.46 (0.43).
Income rose by 5 per cent to SEK 9 652m (9 225). Net
gains and losses on financial items at fair value and
6. higher commission income contributed the most. Net
interest income was stable, while other income
decreased slightly.
Net interest income was stable at SEK 5 626m (5 641).
LC&I and Baltic Banking contributed positively, while net
interest income within Swedish Banking and Group
Treasury within Group Functions & Other decreased
slightly. Positive contributions came from increased
lending and deposit volumes within LC&I, Swedish
Banking and Baltic Banking. Continued repricing within
Baltic Banking also contributed positively, while
mortgage margins for the Swedish portfolio as a whole
were stable. Lower market interest rates affected net
interest income negatively.
Net commission income rose by 7 per cent to SEK
2 699m (2 520). LC&I contributed with higher income
from asset management, bond issues and corporate
finance. Higher average assets under management,
following a rise in equity prices, contributed to the
increase in Swedish Banking, at the same time that the
outsourcing of ATMs reduced the business segment’s
net commission income as well as costs; see also page
12.
Net gains and losses on financial items at fair value
more than doubled to SEK 461m (170). Income from
customer and proprietary trading increased within LC&I,
which contributed positively. Group Treasury continued
to have a negative effect during the quarter, though to
less of an extent than during the third quarter, as a
result of falling market rates and credit spreads.
Expenses increased by 12 per cent compared with the
previous quarter to SEK 4 484m (3 995), mainly due to
seasonally higher expenses for staff, marketing and
consultants. Redeployment provisions within Group
Functions & Other raised staff costs by SEK 100m. This
is a result of a staff reallocation to customer-focused
services within the Group and less need for personnel in
the areas that worked with repossessed assets and
problem loans. Social insurance charges associated
with the share-related portion of variable compensation
increased due to the rise in the Swedbank share. The
increase was SEK 67m. Depreciation/amortisation
increased by 23 per cent, mainly due to the impending
move of the head office.
Expense analysis
Group
SEKm
Swedish Banking
Large Corporates &
Institutions
Baltic Banking
Group Functions & Other
and Eliminations
Total excl FX effects
FX effects
Total expenses
Q4
2013
Q3
2013
Q4
2012
2 533
2 389
2 474
878
661
759
612
730
651
412
4 484
245
4 005
-10
295
4 150
-8
4 484
3 995
Full-year 2013
Compared with full-year 2012
Result
Profit before impairments increased by 3 per cent to
SEK 20 290m (19 708). Stronger net interest income
and higher commission income positively affected profit,
while net gains and losses on financial items at fair
value were lower year-on-year. Expenses were largely
unchanged. Swedish Banking contributed the most to
the higher result.
Profit before
impairments
by business segment
SEKm
Swedish Banking
Large Corporates &
Institutions
Baltic Banking
Group Functions & Other
Total excl FX effects
FX effects
Total
Full-year Full-year
2013
2012
∆
SEKm
11 990
11 575
415
4 277
3 179
844
20 290
4 149
3 064
863
19 651
57
19 708
128
115
-19
639
-57
582
20 290
The result for the period decreased by 10 per cent to
SEK 12 901m (14 304), mainly due to higher tangible
and intangible asset writedowns and because the bank
reported credit impairments of SEK 60m in 2013,
compared with recoveries of SEK 185m for 2012. The
result for continuing operations was SEK 15 241m
(15 298). The result for discontinued operations was
SEK -2 340m (-997), of which SEK 1 875m is a
cumulative negative translation difference that was
reclassified to the income statement from other
comprehensive income in the second quarter in
connection with the sale of the Ukrainian operations. For
more information, see note 24.
4 142
The number of full-time positions were stable, and
increased during the quarter by 1 to 14 265. The
number increased within Swedish Banking, LC&I and
Group Functions & Other, but decreased by 78 in Baltic
Banking.
The tax expense amounted to SEK 1 212m (998),
corresponding to an effective tax rate of 24.9 per cent
Swedbank – Year-end report 2013
(19.2). The relatively higher effective rate in the fourth
quarter is mainly due to a taxable distribution of
previous years’ profits within the Estonian group, but
also to a new assessment of deferred tax assets and a
non-deductible writedown of properties within Ektornet,
where no deferred tax assets were booked in
connection with the writedown.
Page 6 of 58
In 2013 credit impairments of SEK 60m were reported
compared with net recoveries of SEK 185m for 2012.
LC&I and Swedish Banking reported credit impairments,
while Baltic Banking reported net recoveries, though
lower than in 2012. Tangible asset writedowns rose by
SEK 286m to SEK 693m, with SEK 652m related to
Ektornet. Intangible asset writedowns amounted to SEK
182m (20) and mainly related to the writedown of IT
systems within Swedbank Finance AB (reported within
Group Functions & Other) and LC&I during the second
quarter.
Fluctuations in exchange rates, primarily the
appreciation of the Swedish krona against the euro and
the Baltic currencies, reduced profit by SEK 60m. The
return on equity for continuing operations was 14.7 per
cent (15.6). The cost/income ratio was 0.45 (0.46).
Income increased slightly to SEK 36 938m (36 268),
mainly driven by Swedish Banking and LC&I. Changes
in exchange rates reduced income by SEK 102m.
7. Net interest income rose by 8 per cent to SEK 22 029m
(20 361). The fee for government guaranteed funding
decreased by SEK 258m. The repricing of corporate
lending contributed positively. Lower deposit margins
due to falling Stibor and Euribor rates negatively
affected net interest income. Fluctuations in exchange
rates reduced net interest income by SEK 56m.
Net commission income rose by 5 per cent to SEK
10 132m (9 614). Increased activity in financing
solutions and higher commission income from asset
management due to an increase in assets under
management were the biggest contributors. The
outsourcing of ATMs by Swedish Banking has reduced
net commission income as well as expenses. For more
information, see page 12.
Net gains and losses on financial items at fair value
decreased by 52 per cent to SEK 1 484m (3 073). The
repurchase of government guaranteed bonds during the
second quarter and covered bond repurchases during
the year negatively affected net gains and losses on
financial items at fair value. The results from equity,
fixed income and currency trading were lower than in
the same period in 2012, when the first-quarter results
were very strong due to favourable market conditions.
Expenses were largely unchanged at SEK 16 648m
(16 560). Within Group Functions & Other, expenses for
Ektornet and Swedbank Finance AB decreased. Within
Swedbank Finance AB, the decrease was mainly due to
a reclassification, which at the same time reduced net
interest income. Expenses for transport and security fell
by SEK 181m, telephone and postage expenses by
SEK 83m and other expenses by SEK 142m. IT
development and staff costs rose. Higher variable staff
costs are due to the addition of a new share-based
programme for 2013 to the accruals of the previous
share-based programmes for 2010, 2011 and 2012.
Since 1 July 2010 Swedbank pays part of its variable
remuneration in the form of shares. Share-based
remuneration is accrued until the shares are settled. As
a result, variable remuneration allocated to employees
during the period differs from the recognised amount. A
more detailed analysis of variable remuneration is
1
provided on page 14 of the fact book . Changes in
exchange rates reduced expenses by SEK 44m.
Expense analysis
Group
SEKm
Full-year Full-year
2013
2012
Swedish Banking
Large Corporates & Institutions
Baltic Banking
Group Functions & Other
and Eliminations
Total excl FX effects
FX effects
Total expenses
∆
SEKm
9 726
3 205
2 444
9 791
2 961
2 404
-65
244
40
1 273
16 648
1 360
16 516
44
-87
132
-44
16 648
16 560
88
The number of full-time positions decreased during the
year by 596, of which 363 were in Ukraine and Russia,
402 in Baltic Banking and 111 in Ektornet (Group
Functions & Other). Within Swedish Banking and LC&I,
the number of full-time positions increased by 82 and
27, respectively. The remaining increase is mainly due
to IT related personnel within Group Functions & Other.
1
More detailed information can be found in Swedbank’s fact book,
www.swedbank.com/ir, under Financial information and publications.
Swedbank – Year-end report 2013
Page 7 of 58
The tax expense amounted to SEK 4 099m (4 157),
corresponding to an effective tax rate of 21.2 per cent
(21.4). The underlying effective tax rate was lower in
2013 than in 2012 due to a reduction of the Swedish
corporate tax rate as of 1 January 2013. During the
fourth quarter the tax expense was negatively affected
by one-time effects, without which the effective tax rate
would have been nearly 19.5 per cent in 2013.
Credit and asset quality
The bank’s credit portfolio is of high quality, with low
credit impairments and few customers with current or
anticipated payment problems. The low risk in the credit
portfolio was confirmed by the Riksbank’s November
stability report, which indicated that Swedbank’s
Common Equity Tier 1 ratio was the least affected in a
stress test of Sweden’s four major banks. The quality of
the Baltic credit portfolio improved during the year, with
a lower share of impaired loans and improved risk
profile among customers. This was mainly due to
macroeconomic conditions in the Baltic countries.
Credit demand in Swedbank’s home markets was low in
2013. Swedbank’s lending rose by 2.6 per cent, or SEK
30.3bn, of which SEK 3.8bn is due to currency effects.
In Sweden, mortgage lending increased by SEK 15.9bn.
Corporate lending within LC&I and Swedish Banking
increased by SEK 10.9bn. In Baltic Banking, the lending
portfolio grew slightly in Estonia and Lithuania,
calculated in local currency, but decreased in Latvia.
The discontinuation of the Russian and Ukrainian
operations reduced lending volume by SEK 4.2bn.
Credit demand in the fourth quarter was stronger than in
the third, with an increase of 1.7 per cent. The increase
was mainly attributable to mortgages and corporate
lending within Swedish Banking as well as corporate
lending within LC&I.
The average loan-to-value ratio of Swedbank’s
mortgages in Sweden was 62.2 per cent (63.5) as of 31
December, based on property level. The corresponding
figure for new mortgages in Sweden was 69.9 per cent
in 2013. The rate of increase in house prices in major
Baltic cities has stabilised. The average loan-to-value
ratio in Baltic Banking was 84.9 per cent, while the ratio
for new lending was under 70 per cent. With respect to
new lending in Sweden in 2013, 93 per cent of the
households with a loan-to-value ratio over 75 per cent
are amortising their loans. Of those who do not have an
amortisation schedule, many have agreed to begin
amortising within two years of signing their loan. For the
portfolio as a whole, 81 per cent (73) of households with
a loan-to-value ratio over 75 per cent are amortising.
Impaired loans decreased in 2013 by SEK 6.4bn to SEK
7.5bn and correspond to 0.6 per cent of total lending.
The average provision ratio for impaired loans is 38 per
cent. This is in addition to portfolio provisions for
unidentified impaired loans as an added safety margin,
producing a total provision ratio of 54 per cent. The
discontinuation of the Russian and Ukrainian operations
accounted for SEK 3bn of the decrease in impaired
loans. Within Baltic Banking, impaired loans fell by SEK
3.8bn, mainly due to the winding down of problem loans
from the crisis years of 2008 - 2009 and improved
quality in the loan portfolio. The SEK 27bn in impaired
loans in Baltic Banking attributable to problem loans
from the crisis years has gradually been reduced to SEK
5.0bn. The loans have been restructured, amortised or
written off. Within LC&I, impaired corporate loans
increased by SEK 0.7bn, owing to a few large
8. commitments, while in Swedish Banking they decreased
by SEK 0.2bn during the year. Impaired loans to private
customers decreased. The share of Swedish mortgages
past due by more than 60 days was stable at 0.09 per
cent of the portfolio (0.13). The share of impaired
mortgages in Baltic Banking fell, mainly in Latvia. The
share of mortgages past due by more than 60 days was
0.7 per cent in Estonia (1.3), 7.4 per cent in Latvia
(10.7) and 4.4 per cent in Lithuania (5.6).
The average maturity of all capital market funding
arranged through the bank’s short- and long-term
programmes was 29 months as 31 December 2013 (31
as of 30 September). The average maturity of long-term
funding issued in 2013 was 53 months. The bank’s
short-term funding is mainly used as a cash
management tool, not to finance lending to the public.
Outstanding volume decreased by SEK 27bn during the
quarter to SEK 101bn.
Impaired loans,
by business segment
SEKm
Issued long-term debt
SEKbn
Swedish Banking
Large Corporates &
Institutions
Baltic Banking
Estonia
Latvia
Lithuania
Group Functions & Other
Summa
Dec 31
2013
Dec 31
2013
1 547
1 824
906
5 046
1 338
2 145
1 563
0
7 499
246
8 871
2 181
4 449
2 241
2 997
13 938
Credit impairments amounted to SEK 60m in 2013
(recoveries of SEK 185m in 2012). Credit impairments
within Swedish Banking and LC&I totalled SEK 518m.
Continued positive macro development in the Baltic
countries led to recoveries. Additional write-offs of SEK
93.5m were booked in Latvia during the fourth quarter
for a portion of the impaired loans in the mortgage
portfolio.
Credit impairments, net
by business segment
SEKm
Swedish Banking
Large Corporates &
Institutions
Baltic Banking
Estonia
Latvia
Lithuania
Group Functions & Other
Total
Full-year
2013
Full-year
2012
338
286
180
-437
-267
2
-172
-21
60
194
-685
-343
-124
-218
20
-185
The value of repossessed assets in the Group fell by
SEK 3.0bn to SEK 2.1bn in 2013. During the year
properties within Ektornet with a book value of SEK
2.8bn were sold. For more information on Ektornet, see
page 19.
Funding and liquidity
In 2013 Swedbank issued a total of SEK 103bn in longterm debt instruments, of which SEK 73bn related to
covered bonds and SEK 26bn to senior debt. Issuance
during the fourth quarter amounted to SEK 14bn, of
which covered bonds accounted for SEK 12bn and
senior debt for SEK 1bn. Demand for private
placements remained high. The bank’s total issuance in
2013 fell below the plan presented early in the year. The
main reasons were low credit growth in the mortgage
market and the bank’s good liquidity. During the next 12
months the bank plans to issue a total of approximately
SEK 120bn to meet maturing long-term funding with a
nominal value of SEK 103bn. Liquidity in excess of the
refinancing needs will be used in day-to-day
management to repurchase covered bonds.
Swedbank – Year-end report 2013
Page 8 of 58
Covered bonds
of which SEK
of which EUR
of which USD
of which Other
Senior unsecured bonds
Structured retail bonds (SPAX)
Total
Q4
2013
Q3
2013
Q2
2013
Q1
2013
12
11
1
0
0
1
1
14
16
15
1
0
23
14
9
0
0
5
1
29
23
13
1
7
2
16
1
40
4
0
20
Swedbank’s liquidity reserve, which is reported in
accordance with the Swedish Bankers’ Association’s
definition, amounted to SEK 184bn on 31 December
2013 (236 as of 30 September). In addition to the
liquidity reserve, liquid securities in other parts of the
Group amounted to SEK 53bn (39 as of 30 September).
The liquidity reserve and Liquidity Coverage Ratio
(LCR) fluctuate over time depending, among other
things, on the maturity structure of the bank’s issued
securities. According to current Swedish regulations in
effect as of 1 January 2013, the Group’s LCR was142
per cent on 31 December (147 as of 30 September).
Distributed by USD and EUR, LCR was 618 and 662
per cent, respectively. In early 2013 the Basel
Committee published a new recommendation on the
definition of LCR. According to Swedbank’s
interpretation, LCR would have been 168 per cent as of
31 December (180 as of 30 September).
According to Swedbank’s interpretation of the current
draft regulation, the Group’s Net Stable Funding Ratio
(NSFR) was 89 per cent on 31 December (91 as of 30
September). According to Swedbank’s interpretation of
the Basel Committee’s latest proposed changes, NSFR
would amount to 97 per cent. The main liquidity
measure used by the Board of Directors and executive
management is the so-called survival horizon, which
shows how long the bank could manage long periods of
stress in capital markets, where access to new financing
is limited. At present the bank would survive more than
12 months with the capital markets completely shut
down. This applies to the Group’s total liquidity as well
as liquidity in USD and EUR.
For more information on the above, see page 63-77 of
the fact book.
Ratings
In 2013 Swedbank’s relative rating improved. In June
Moody’s upgraded Swedbank’s long-term rating one
notch to A1 with a stable outlook, at the same time that
its short-term rating of P1 was affirmed. In July S&P
revised Swedbank’s outlook from negative to stable. At
the same time Swedbank’s and Swedbank Mortgage’s
long-term and short-term ratings of A+ and A-1 were
affirmed.
9. Capital and capital adequacy
The Common Equity Tier 1 ratio according to Basel 3
continued to strengthen during the quarter to 18.3 per
cent on 31 December, according to Swedbank’s current
calculation based on the new regulations that took effect
on 1 January 2014 (18.0 per cent on 30 September
2013 and 15.4 per cent on 31 December 2012). The
introduction of new capital buffers requires
implementation in Swedish law and will take effect later
in 2014. The Common Equity Tier 1 ratio according to
Basel 2 was 18.7 per cent on 31 December (18.8 and
16.7, respectively). Because the new regulations have
entered into force, Swedbank’s capital adequacy
reporting according to Basel 2 will cease as of 1
January 2014 and will not be included in the interim
report for the first quarter 2014.
Common Equity Tier 1 capital (Basel 2) rose by slightly
over SEK 1.4bn during the quarter to SEK 84.6bn at
year-end. The increase was mainly due to profit, after
deducting the anticipated dividend and including
dividend of EUR 50m from Swedbank’s Baltic insurance
company. As of 1 January 2013 new rules entered into
force on the recognition of pensions (accounting
standard IAS 19). The revisions create volatility in the
estimated pension liability, which also affects equity
through other comprehensive income. Common Equity
Tier 1 capital decreased by approximately SEK 0.3bn
during the fourth quarter due to falling discount rates,
which are used in the calculation of the pension liability.
For the 12-month period, Common Equity Tier 1 capital
however increased by approximately SEK 1.8bn due to
rising discount rates.
Change in Common Equity Tier 1 capital 2013, Swedbank
financial companies group
amount by SEK 11bn. Positive rating migrations, mainly
among corporate customers in Baltic Banking and
Swedish Banking, reduced the risk weighted amount by
SEK 2.9bn, while higher collateral values reduced the
risk weighted amount by SEK 1.8bn. Fluctuations in
exchange rates, mainly attributable to the Baltic credit
portfolio, raised the risk weighted amount for credit risks
by SEK 2.2bn due to the depreciation of the Swedish
krona against the euro during the fourth quarter.
The risk weighted amount for market risks increased by
SEK 2.5bn in the fourth quarter, mainly due to increased
exposures within LC&I. The risk weighted amount for
operational risks was unchanged as of 31 December
compared with 30 September.
Change in risk weighted assets 2013, Swedbank financial
companies group
SEKbn
500
Basel 3
487,1
480
460
440
420
Basel 3 11,1
446,0
Basel 2
464,3
- 2.9
Basel 2
441,6
- 1.8
Basel 2
451.9
2.5
2.2
- 0.8
0
Basel 3
440.6
400
380
SEKbn
90
4.2
Basel 2
81.9
85
0.2
-2.7
80
Basel 2
84.6
-0.3
Basel 2
77.5
75
70
65
Basel 3
75.2
Basel 3
79.2
Basel 3
80.8
60
55
50
45
40
Increase
In December 2013 the Swedish Financial Supervisory
Authority (SFSA) published new requirements effective
1 January 2014 to complement the EU’s new Capital
Requirements Regulation (CRR). SFSA’s requirements
change the consolidation method for associates so that
they are normally consolidated according to the equity
method instead of full consolidation. Because
Sparbanken Rekarne AB, Färs och Frosta Sparbank
AB, Swedbank Sjuhärad AB, Vimmerby Sparbank AB,
Bankernas Depå AB and Bankernas Automatbolag AB
are consolidated as of 1 January according to the equity
method, the capital base and risk weighted amount for
the financial companies group are reduced. This has a
slightly positive effect on the Common Equity Tier 1
ratio. The change is included in the capital calculation
according to Basel 3 as per 31 December and explains
the smaller negative effect in relation to Basel 2,
compared with the estimate reported on 30 September.
Decrease
* Profit for financial companies group.
Risk weighted assets (Basel 2) increased by about SEK
10bn during the fourth quarter to SEK 452bn. The risk
weighted amount for credit risks rose by nearly SEK
8bn. Increased exposures, mainly to credit institutions in
Swedish Banking and LC&I, raised the risk weighted
Swedbank – Year-end report 2013
Page 9 of 58
In May SFSA announced its decision to introduce a risk
weight floor of 15 per cent for the Swedish mortgage
portfolio, in line with the proposal announced in
November 2012. The floor will be introduced as a
supervisory measure within Pillar 2. Consequently, the
reported capital ratios will not be affected, since the
calculations are made according to the rules for Pillar 1.
Based on an average risk weight in Swedbank’s
Swedish mortgage portfolio of 4.3 per cent according to
10. Pillar 1 as of 31 December and the Swedish Common
Equity Tier 1 capital requirement of 12 per cent (as of
2015), Swedbank, as per SFSA’s decision to raise the
floor, has to maintain additional Common Equity Tier 1
capital of SEK 10.0bn for Swedish mortgages. This
corresponds to 2.2 percentage points of the Common
Equity Tier 1 ratio according to Pillar 1. In its internal
controls, Swedbank has for some time allocated
additional capital to its mortgage business equivalent to
the risk weight floor that has now been announced. In
November SFSA announced its intention to further
increase the risk weight floor, to 25 per cent. Calculated
according to the same method as above, this increase
would mean an additional SEK 9.3bn in Common Equity
Tier 1 capital for Swedbank. As a whole, a risk weight
floor of 25 per cent would mean that Swedbank would
have to maintain a total of SEK 19.3bn in additional
Common Equity Tier 1 capital for its Swedish
mortgages, corresponding to 4.3 percentage points of
the Common Equity Tier 1 ratio according to Pillar 1. At
present Swedbank already has sufficient Common
Equity Tier 1 capital to meet the proposed increase in
the risk weight floor. SFSA is also responsible for
deciding on the countercyclical buffer in connection with
Sweden’s implementation of CRD IV later in 2014. In
announcing the increase in the risk weight floor, SFSA
stated that it may be necessary to prioritise this in
exchange for a lower countercyclical buffer.
When CRR takes effect, SFSA will be able to grant
banks waivers from the current Basel 1 floor. The Basel
1 floor is a back-stop for the lowest level of the capital
base requirement, which was introduced in connection
with the transition from Basel 1 to Basel 2. Swedish
authorities had previously announced that this floor
would be eliminated in connection with the introduction
of the new, higher capital requirements. In December,
however, SFSA said it did not intend to eliminate the
floor. As a result, the Basel 1 floor will remain in effect in
Sweden in the same way it does today i.e. designed as
80 per cent of the capital requirement calculated
according to Basel 1. SFSA’s position does not entail a
change with regard to the floor compared with current
regulations.
Discussions among regulators and other interested
parties on the harmonisation of risk weights intensified
during the year. One topic of debate is how the leverage
ratio can be used to ensure a minimum capital level in
relation to the size of the balance sheet. With the EU’s
new capital adequacy rules (CRD IV/CRR) as of 1
January 2014, banks are now obliged to report their
leverage ratios to supervisory authorities. The measure
will be evaluated by the authorities prior to the possible
introduction of a minimum requirement in 2018.
Swedbank’s leverage ratio (according to CRR) was 4.6
per cent on 31 December.
Market risk
The majority of the Group’s market risks are of a
structural or strategic nature and are managed by Group
Treasury. Structural interest rate risks arise when the
maturity of the Group’s assets and liabilities, such as
deposits and lending, do not coincide. The risks are
managed within given mandates by matching the
maturities directly or by using various derivatives such
as interest rate swaps. Net interest income sensitivity is
also affected by structural risks in the bank’s deposit
operations, where various products show different
sensitivity to changes in market interest rates. Strategic
Swedbank – Year-end report 2013
Page 10 of 58
currency risks arise primarily through risks tied to
holdings in foreign subsidiaries and their financing.
Market risks also arise in LC&I’s trading operations in
connection with customer transactions and by
maintaining a secondary market for various types of
securities.
Swedbank measures market risks with a Value-at-Risk
(VaR) model, among other things. VaR expresses a loss
level that statistically will be exceeded by a specific
probability during a set time horizon. Swedbank uses a
99 per cent probability and a time horizon of one day.
This means that the potential loss for the portfolio,
based on historical data, will exceed VaR on one day of
100.
The table below shows Swedbank’s VaR*) performance
during the year.
VaR by risk category
Jan-Dec 2013 (2012)
Max
Min Average
SEKm
Interest risk
Currency rate risk
Stock price risk
Diversification
Total
99 (141)
17 (14)
9 (14)
0
101 (131)
49 (69)
2 (3)
1 (3)
0
58 (66)
75 (102)
8 (6)
3 (7)
-12 (-19)
74 (96)
31 Dec 31 Dec
2013
2012
66
10
3
-13
66
71
5
4
-14
66
*) The VaR model was complemented during the year by new
risk factors, due to which the year-on-year figures are not
directly comparable. VaR here excludes strategic currency rate
risks, since a VaR measurement based on a time horizon of
one day is not relevant.
For individual risk types, VaR is complemented by
various risk measures based on sensitivity to changes in
market prices. Risk taking is also monitored with stress
tests. An increase in all market interest rates of one
percentage point as of 31 December 2013 would have
reduced the Group’s net gains and losses on financial
items at fair value by SEK 608m, compared with a
decrease of SEK 52m as of 31 December 2012.
Operational risks
IT operations and accessibility in the Internet Bank and
Telephone Bank were further stabilised in 2013.
Compared with the previous year, the number of major
IT-related incidents fell by 62 per cent. At the same time
the average time it took to address the incidents was
down 45 per cent (January–November 2013). Long-term
measures to improve the bank’s IT infrastructure are
continuing according to plan.
Swedbank’s measures to actively inform customers of
the importance of IT security have produced positive
results, including a reduction in sophisticated fraud
attempts affecting customers. Fraud attempts through
fake emails and web ads are still increasing, however,
which could affect Swedbank’s customers. Expenses
associated with operational risk events were limited to
approximately SEK 100m (85m) for 2013.
11. Other events
Events after 31 December 2013
Swedbank’s Annual General Meeting will be held at
Dansens Hus, Barnhusgatan 14 in Stockholm, at 10:00
am on Wednesday, 19 March 2014. More information
on the Annual General Meeting will be available on the
website, www.swedbank.se, under the tab About
Swedbank/Corporate governance
.
Latvia adopted the euro as national currency as from 1
January 2014.
Swedbank – Year-end report 2013
Page 11 of 58
12. Swedish Banking
Stable net interest income
Improved market position in mortgages
Increased use and activity in digital channels
Income statement
SEKm
Q4
2013
Q3
2013
%
Q4
2012
%
Net interest income
Net commissions
Net gains and losses on financial items at fair value
Share of profit or loss of associates
Other income
Total income
3 448
1 649
31
209
199
5 536
3 473
1 577
28
239
174
5 491
-1
5
11
-13
14
1
3 353
1 554
37
153
158
5 255
3
6
-16
37
26
5
13 620
6 364
126
849
757
21 716
13 491
6 155
161
788
771
21 366
1
3
-22
8
-2
2
Staff costs
Variable staff costs
Other expenses
Depreciation/amortisation
Total expenses
Profit before impairments
888
67
1 535
43
2 533
3 003
874
48
1 438
29
2 389
3 102
2
40
7
48
6
-3
844
20
1 579
31
2 474
2 781
5
-3
39
2
8
3 499
230
5 865
132
9 726
11 990
3 399
139
6 129
124
9 791
11 575
3
65
-4
6
-1
4
Credit impairments
Operating profit
140
2 863
106
2 996
32
-4
91
2 690
54
6
338
11 652
286
11 289
18
3
Tax expense
Profit for the period
Profit for the period attributable to the shareholders of
Swedbank AB
617
2 246
678
2 318
-9
-3
458
2 232
35
1
2 516
9 136
2 694
8 595
-7
6
2 241
2 312
-3
2 232
0
9 122
8 585
6
5
6
-17
0
14
10
40
27.6
244
0.06
0.46
937
385
5 004
28.1
244
0.05
0.44
925
378
4 969
1
2
1
28.0
242
0.04
0.47
912
377
4 922
27.9
244
0.04
0.45
937
385
5 004
27.1
242
0.03
0.46
912
377
4 922
3
2
2
Non-controlling interests
Return on allocated equity, %
Loan/deposit ratio, %
Credit impairment ratio, %
Cost/income ratio
Loans, SEKbn
Deposits, SEKbn
Full-time employees
Development January - December
The result for the period amounted to SEK 9 122m
(8 585), the result of stable income, expenses and credit
impairments. The lower Swedish corporate tax rate
affected earnings positively.
Net interest income was stable during the year
compared with 2012. The repricing of corporate credit
largely offset lower deposit margins, which were
adversely affected by declining market interest rates.
Stibor fell slightly during the fourth quarter, and in 2013
averaged about 80 basis points less than the previous
year. For the portfolio as a whole, the mortgage margin
was stable.
Household deposit volume in the bank rose by 1 per
cent in 2013, largely in the fourth quarter. Swedbank’s
share of household deposits was slightly over 21 per
cent at the end of the period (22 per cent as of 31
December 2012). Corporate deposits within Swedish
Banking rose by SEK 5bn, or 5 per cent, during the
year. The increase was primarily in the fourth quarter.
Swedbank’s market share was 18 per cent as of 30
November (16 per cent as of 31 December 2012),
including corporate deposits within LC&I. Fund values
rose during the year, mainly driven by rising equity
prices. The market share, measured as assets under
management, was 24 per cent (25 per cent as of 31
December 2012)
Swedbank – Year-end report 2013
Page 12 of 58
3
2
2
Full-year Full-year
2013
2012
%
Mortgage lending volume steadily increased during the
year at the same time that Swedbank gradually
improved its market position. Swedbank’s share of net
growth was 14 per cent during the period JanuaryNovember 2013. Swedbank’s share of the total market
was 25 per cent (26 per cent as of 31 December 2012).
Mortgage volume increased by SEK 7bn during the
fourth quarter. Corporate lending volume within Swedish
Banking increased by SEK 6bn during the year, of which
SEK 4bn was in the fourth quarter. The market share
was 17 per cent (17 per cent as of 31 December 2012),
including corporate lending within LC&I.
Net commission income rose by 3 per cent in 2013. The
increase was mainly due to higher fund volumes in the
wake of rising share prices, but also to net inflows,
mainly to short-term fixed income funds and collective
occupational pensions. Higher income from lending and
guarantee commissions also contributed positively,
while payment commissions decreased. Since January
2013 Bankomat AB has gradually taken over
responsibility for Swedbank’s ATMs. Swedbank pays a
commission to Bankomat AB for this service. As a
result, net payment commissions and expenses have
both decreased. Commissions paid to Bankomat AB
amounted to nearly SEK 95m in the fourth quarter and
SEK 250m for the full-year. At the same time
administration and maintenance expenses decreased
13. by about SEK 150m. This is in addition to other income
of about SEK 80m from the savings banks in 2013, as
well as less need for investments in new ATMs. During
the fourth quarter, net commission income improved
somewhat, with the largest contribution from increased
fund volumes and higher commissions.
Expenses for the full-year fell by 1 per cent year-onyear. Reduced manual cash handling has led to lower
transport and security expenses. Expenses during the
fourth quarter were slightly higher on a seasonal basis,
mainly driven by marketing and increased staff costs
due to the hiring of more advisors.
Credit quality remained good, although credit
impairments rose slightly during the period due to
increased provisions within the retail and service
sectors. The share of impaired loans was 0.16 per cent
(0.19).
Risk weighted assets amounted to SEK 202bn,
unchanged from 31 December 2012. The effects of the
increased exposure have been offset by the effects of
positive rating migrations.
During the fourth quarter Svensk Fastighetsförmedling
was acquired by Swedbank Franchise. Swedbank
Franchise has submitted the acquisition for approval by
the Swedish Competition Authority. A response is
expected in March.
A number of new services with new or improved
functionality were introduced in the bank’s digital
channels during the quarter. One example is
Spontanspar (“Instant Savings”), which facilitates
savings by mobile phone directly to a managed account
without logging in. As of 31 December, 20 000
customers had used the service.
Use of Swedbank’s digital channels continues to grow.
The Internet Bank had 3.6 million users at year-end, an
increase of 120 000 during the year, while the Mobile
Bank had 1.6 million (+338 000) and the iPad Bank had
385 000 (+253 000).
The 2013 “Mobile Gala”, held in Stockholm in
November, presented its gold award to Swish for the
year’s best mobile payment solution. Swish is a service
shared with other Swedish banks that facilitates
practically instantaneous payments between private
customers, from one bank account to another. As of 31
December there were 726 000 Swish users, a gain of 76
000. Swedbank’s and the savings bank’s share was
39.6 per cent.
Customers’ increasing card usage is clearly visible. In
2013 the number of card purchases in stores rose by 11
per cent and the aggregate value by 7 per cent. On a
rolling twelve-month basis the number of ATM
transactions decreased by 9 per cent. The total value of
withdrawals fell by 8 per cent. Of the total number of
card transactions, ATM withdrawals accounted for 9 per
cent.
The magazine Privata Affärer gave Swedbank its award
as a “Bank for everyone” for its services for the
disabled, confirmation that our digitalisation efforts are
providing opportunities for more people.
Sweden is Swedbank’s largest market, with around 4 million private customers and more than 250 000 corporate
customers. This makes it Sweden’s largest bank in number of customers. Through our digital channels (Telephone Bank,
Internet Bank and Mobile Bank) and branches, and with the support of cooperating savings banks and franchisees, we
are always available. Swedbank is part of the local community. Our branch managers have the authority to act locally.
The bank’s presence and engagement are expressed in various ways. A project called “Young Jobs”, which has created
several thousand trainee positions for young people, is an important example in recent years. Swedbank has 305
branches in Sweden. The various product areas are described on page 21.
Swedbank – Year-end report 2013
Page 13 of 58
14. Large Corporates & Institutions
Increased income from corporate finance and bond issues
Stronger customer focus is creating new business
Continued margin pressure on new loans to large companies
Income statement
SEKm
Q4
2013
Q3
2013
Net interest income
Net commissions
Net gains and losses on financial items at fair value
Share of profit or loss of associates
Other income
Total income
889
559
491
0
48
1 987
864
467
387
0
37
1 755
3
20
27
Staff costs
Variable staff costs
Other expenses
Depreciation/amortisation
Total expenses
Profit before impairments
302
118
441
17
878
1 109
269
99
375
16
759
996
0
0
5
1 104
Q4
2012
%
Return on allocated equity, %
Loan/deposit ratio, %
Credit impairment ratio, %
Cost/income ratio
Loans, SEKbn
Deposits, SEKbn
Full-time employees
278
75
377
13
743
1 114
7
989
-29
12
211
778
778
20.3
173
0.01
0.44
154
89
1 070
Tax expense
Profit for the period
Profit for the period attributable to the shareholders of
Swedbank AB
12
19
18
6
16
11
744
Credit impairments
Operating profit
12
4
0
30
13
795
536
492
0
34
1 857
360
744
Impairment of intangible assets
18.3
208
0.01
0.43
148
71
1 064
Development January - December
The result amounted to SEK 2 997m for full-year, an
increase of 1 per cent year-on-year. The result was
positively affected by increased income from lending,
asset management and bond issues. The return on
allocated equity was 17.3 per cent.
Net interest income increased by 11 per cent in 2013 to
SEK 3 387m, mainly due to interest income from
acquisition financing, loans and loan syndications within
Investment Banking. Lending volume rose by 3 per cent,
or SEK 5bn. Net interest income during the fourth
quarter increased by 3 per cent to SEK 889m. Business
activity within Large Corporates was high during the
quarter. Lending volumes increased at the same time
that margin pressure on new loans continued. Deposit
volumes also rose within Large Corporates as a result of
new business from existing customers.
Net commission income rose by 7 per cent in 2013 to
SEK 1 968m. The increase mainly related to loans,
asset management and bond issues. During the fourth
quarter net commission income was SEK 559m, up 20
per cent, mainly due to asset management, bond issues
and corporate finance. A number of major bond issues
were completed in Sweden, including for Fabege, as
well as in Norway, including for Ewos. Swedbank’s
market share for Swedish issues was 21 per cent in
Swedbank – Year-end report 2013
%
Page 14 of 58
Full-year Full-year
2013
2012
%
3 041
1 833
2 253
6
51
7 184
11
7
-13
41
7
3 387
1 968
1 960
0
167
7 482
9
57
17
31
18
0
1 150
409
1 588
58
3 205
4 277
1 125
365
1 459
47
2 996
4 188
2
12
9
23
7
2
56
4
162
952
-97
16
180
4 041
194
3 990
-7
1
71
-4
84
868
-14
1 044
2 997
1 010
2 980
3
1
-4
868
-14
2 997
2 980
1
4
25
1
18.3
209
0.23
0.40
149
71
1 043
3
25
3
17.3
173
0.08
0.43
154
89
1 070
15.5
209
0.08
0.42
149
71
1 043
3
25
3
0
4
2013. The corresponding figure in Norway was 18 per
cent, making Swedbank the leader in Sweden and the
second largest player in Norway.
Net gains and losses on financial items at fair value
decreased by 13 per cent during the year to SEK
1 960m. During the fourth quarter net gains and losses
on financial items at fair value rose by 27 per cent to
SEK 491m. Market risks were relatively stable during
the quarter, while volatility in the Nordic fixed income
and FX markets was fairly high, which benefited
customer and proprietary trading.
Total expenses increased by 7 per cent compared with
2012, mainly related to IT expenses and staff costs,
which increased during the fourth quarter.
Credit impairments amounted to SEK 180m for 2013, of
which SEK 5m related to the fourth quarter. The share
of impaired loans was 0.38 per cent (0.10). Credit
quality in the loan portfolio remains good.
Risk weighted assets rose by SEK 9bn during the
quarter to SEK 137bn. Risk weighted assets for credit
risk increased by SEK 6bn, mainly due to increased
corporate lending and higher utilisation of existing credit
facilities. Risk weighted assets related to market risk
increased by SEK 3bn.
15. The most recent Greenwich survey of large companies
shows that Swedbank’s offering is appreciated by
prioritised customers in both Sweden and Norway.
Large Corporates & Institutions is responsible for Swedbank’s offering to customers with revenue over SEK 2 billion
and those whose needs are considered complex due to multinational operations or a need for sophisticated financing
solutions. The business segment is also responsible for developing corporate and capital market products for other parts
of the bank and the Swedish savings banks. LC&I works closely with customers, who receive advice on decisions that
create jobs and sustainable growth in the long-term. The business segment has around 1 100 employees at offices in
Sweden, Norway, Estonia, Latvia, Lithuania, Finland, Luxembourg, China and the US.
Swedbank – Year-end report 2013
Page 15 of 58
16. Baltic Banking
New coordinated organisational structure in place
Repricing contributed positively
Successful euro introduction in Latvia
Income statement
SEKm
Q4
2013
Q3
2013
%
Q4
2012
%
Net interest income
Net commissions
Net gains and losses on financial items at fair value
Other income
Total income
844
454
84
129
1 511
807
446
98
102
1 453
5
2
-14
26
4
760
366
80
83
1 289
11
24
5
55
17
3 156
1 733
316
418
5 623
3 291
1 522
295
384
5 492
-4
14
7
9
2
194
19
396
52
661
850
175
18
382
29
604
849
11
6
4
79
9
0
193
16
394
30
633
656
1
19
1
73
4
30
746
63
1 495
140
2 444
3 179
743
63
1 482
124
2 412
3 080
0
0
1
13
1
3
1
16
-177
1 010
0
1
-147
995
20
2
0
8
-329
977
100
-46
3
1
23
-437
3 592
0
15
-685
3 750
53
-36
-4
183
827
84
911
-9
155
822
18
1
396
3 196
387
3 363
2
-5
827
911
-9
822
1
3 196
3 363
-5
15.1
100
-0.59
0.44
119
120
3 753
16.6
106
-0.50
0.42
117
110
3 831
2
9
-2
13.3
108
-1.15
0.49
115
107
4 155
3
12
-10
14.0
100
-0.37
0.43
119
120
3 753
13.6
108
-0.59
0.44
115
107
4 155
3
12
-10
Staff costs
Variable staff costs
Other expenses
Depreciation/amortisation
Total expenses
Profit before impairments
Impairment of intangible assets
Impairment of tangible assets
Credit impairments
Operating profit
Tax expense
Profit for the period
Profit for the period attributable to the shareholders of
Swedbank AB
Return on allocated equity, %
Loan/deposit ratio, %
Credit impairment ratio, %
Cost/income ratio
Loans, SEKbn
Deposits, SEKbn
Full-time employees
Development January - December
The result for 2013 amounted to SEK 3 196m,
compared with SEK 3 363m a year earlier. The
decrease was mainly due to lower net interest income
and net recoveries, while expenses were largely
unchanged.
Net interest income decreased by 4 per cent in local
currency in 2013. Lower market rates negatively
affected net interest income, while increased deposit
volumes and repricing contributed positively. Costs
associated with capital and regulatory changes
continued to rise, because of which efforts to correctly
price lending were intensified. During the year one fifth
of the corporate portfolio was repriced, and the price of
new lending will continue to reflect regulatory changes.
Fluctuations in exchange rates reduced net interest
income by SEK 16m. Net interest income in local
currency rose by 3 per cent during the fourth quarter,
mainly driven by increased deposit margins and a
strong volume increase in deposit volumes.
Lending volumes were unchanged in local currency in
2013. Consumer lending increased slightly and
corporate lending was stable, while mortgage lending
decreased slightly. Lending grew during the year in
Estonia and Lithuania, while in Latvia it decreased due
to amortisations, write-offs and limited new loan
volumes. In addition, Swedbank acquired Unicredit’s
loan portfolio during the quarter with a volume of SEK
363m in all three countries, half of which is in Estonia.
Swedbank – Year-end report 2013
Page 16 of 58
Full-year Full-year
2013
2012
%
Swedbank’s market share in lending in the Baltic
countries was 28 per cent as of 30 November (28 per
cent as of 31 December 2012).
Deposit volumes grew by 8 per cent in local currency
during the year. Private deposits rose by 6 per cent and
corporate deposits by 9 per cent. The Latvian deposit
portfolio increased the most, followed by Estonia’s and
Lithuania’s. Swedbank’s market share in deposits was
30 per cent as of 30 November (31 per cent as of 31
December 2012). Deposits increased in Latvia during
the fourth quarter, partly because retail customers
deposited more money than usual ahead of the euro
adoption. The loan-to-deposit ratio for Baltic Banking
was 100 per cent (108 per cent as of 31 December
2012).
Net commission income rose by 14 per cent in local
currency in 2013. The increase was mainly due to
higher customer activity, a new pricing model which
contributed to higher payment commissions, and
increased sales of basic products and services. The
number of active customers continued to rise in 2013
and is now 2.6 million, up 76 000.
Net gains and losses on financial items at fair value rose
by 7 per cent in local currency. The increase was mainly
due to higher foreign exchange activity. In 2014 the FX
business is expected to decline in Latvia as a result of
the euro adoption.
17. Total expenses increased by 2 per cent in local currency
in 2013, including euro adoption costs of SEK 57m in
Latvia. Expenses for marketing, premises, consultants,
telecommunications and insurance decreased. To
increase efficiency and improve cooperation, a
coordinated organisation was implemented in the Baltic
operations. Retail operations have been further
optimised, and the number of branches has been
reduced by 10 to 181. Increased digitalisation and
customers’ increased use of digital channels resulted in
a reduction in the number full-time employees of 402, or
10 per cent, during the year.
Net recoveries amounted to SEK 437m, compared with
SEK 685m for 2012. The recoveries were generated in
the corporate portfolio, while the mortgage portfolio in
Latvia generated impairments. During the fourth quarter
a portion of impaired loans in the mortgage portfolio in
Latvia was written off. Other portfolios generated
recoveries.
Impaired loans continued to decline during the year.
Half of the decline related to Latvia and the other half
was divided between Estonia and Lithuania. Impaired
loans, gross, fell to SEK 5.0bn (SEK 8.9bn as of 31
December 2012). The decrease was mainly due to
amortisations, write-offs and loans that have started to
perform, while the inflow of new impaired loans was
limited. Credit quality has strengthened through a
gradual increase in new lending, which carries lower
risk.
Risk weighted assets decreased by SEK 7bn during the
year to SEK 88bn, mainly driven by the corporate
portfolio, which was the result of active portfolio quality
management, higher corporate profits and rating
upgrades. Furthermore, all new sales are focused on
low and medium risk profiles.
During the fourth quarter a distribution was made by the
Baltic insurance companies to the Estonian parent
company totalling SEK 445m. This resulted in a tax
expense of SEK 105m in Estonia. The distribution
strengthened Swedbank’s capitalisation.
On 1 January Latvia successfully joined the eurozone.
The transition went smoothly. Swedbank has
maintained a high level of customer satisfaction in the
Baltic countries. During the year Swedbank ranked fifth
in the annual survey of Most Loved Brands in the Baltic
countries. Swedbank received the highest points among
companies that are in contact with their customers fulltime, and was the only bank among the 30 highest
ranking companies.
Swedbank is the largest bank in number of customers in Estonia, Latvia and Lithuania, with around 4 million private
customers and more than 250 000 corporate customers. According to surveys, Swedbank is also the most respected
company in the financial sector. Through its digital channels (Telephone Bank, Internet Bank and Mobile Bank) and
branches, the bank is always available. Swedbank is part of the local community. Its local social engagement is
expressed in many ways, with initiatives to promote education, entrepreneurship and social welfare. Swedbank has 50
branches in Estonia, 54 in Latvia and 77 in Lithuania. The various product areas are described on page 21.
Swedbank – Year-end report 2013
Page 17 of 58
18. Group Functions & Other
Income statement
SEKm
Q4
2013
Q3
2013
Net interest income
Net commissions
Net gains and losses on financial items at fair value
Share of profit or loss of associates
Other income
Total income
461
3
-145
0
373
692
498
4
-343
1
439
599
-7
-25
-58
Staff costs
Variable staff costs
Other expenses
Depreciation/amortisation
Total expenses
Profit before impairments
926
73
-622
109
486
206
797
48
-634
105
316
283
Impairment of intangible assets
Impairment of tangible assets
Credit impairments
Operating profit
11
295
0
-100
Tax expense
Profit for the period from continuing operations
Profit for the period from discontinued operations, after tax
Profit for the period
Profit for the period attributable to the shareholders of
Swedbank AB
Q4
2012
%
-8
-37
557
31
364
4
1 450
2 406
-25
-2
-2
805
46
-625
135
361
744
15
59
0
-19
35
-72
3 322
245
-2 460
409
1 516
844
3 246
171
-2 433
557
1 541
865
2
43
-1
-27
-2
-2
0
94
-22
211
17
133
0
594
-35
125
670
-21
70
16
392
20
437
25
186
89
505
-42
143
-73
66
371
-15
171
-174
331
-72
-2 340
-2 413
-997
-626
-200
171
330
-2 414
-624
0
0
1
1
-2
4 438
4 400
4 438
4 741
Development January - December
Income for Group Functions & Other consists of net
interest income and net gains and losses on financial
items, which mainly come from Group Treasury. Other
income primarily consists of revenue from the savings
banks as well as sales revenue and operating income
from Ektornet. Income amounted to SEK 2 360m
(2 406).
Expenses for Group Functions & Other decreased by
1 per cent in 2013 to SEK 1 516m (1 541). Excluding
the net of services purchased and sold internally,
expenses fell by 3 per cent to SEK 6 982m (7 179). The
decrease was mainly due to lower costs for IT
operations and depreciation as well as other expenses.
Depreciation fell due to a reclassification within
Swedbank Finance AB, which at the same time reduced
net interest income, as well as lower depreciation in
Ektornet. The decrease in other expenses is mainly
attributable to Ektornet, where property management
expenses are dropping as the portfolio is dissolved.
Staff costs rose during the fourth quarter due to
redeployment provisions. This is a result of a staff
reallocation to more customer-focused services within
the Group, mainly affects Group Products. Within the
risk organisation, the bank’s resources in areas that
worked with repossessed assets and problem loans
have been reduced.
Group Products
Established on 1 January 2013, Group Products (GP)
consists of around 1 800 employees in Sweden,
Estonia, Latvia and Lithuania. GP is responsible for a
large part of Swedbank’s product areas with a strategy
to support the business segments by reducing the
complexity of the product range and simplifying sales in
the various distribution channels. The product areas GP
Page 18 of 58
16
52
-2
4
54
-27
%
1 880
-30
-918
3
1 425
2 360
-48
-200
Full-time employees
2
-89
-15
16
452
27
221
1
404
1 105
Full-year Full-year
2013
2012
52
-152
Non-controlling interests
Swedbank – Year-end report 2013
%
1
4 741
-6
71
-84
-6
is responsible for – cards, payments, lending, deposits,
insurance and asset management – are described in
more detail on page 21. GP also comprises the
subsidiary Swedbank Franchise AB, which in turn
includes the real estate and business brokerages and a
legal service provider.
In GP’s revenue and expense model, revenue from
Swedbank’s customers is posted by each business
segment and GP receives compensation from the
business segment to cover its expenses. GP’s external
revenue largely comes from the savings banks for the
products their customers use.
Expenses, excluding the net of services purchased and
sold internally, amounted to SEK 3 318m for 2013
(3 318). Staff costs increased due to redeployment
provisions. This was offset by lower IT maintenance
expenses thanks to increased efficiencies as well as
lower mailing costs resulting from increased
digitalisation.
Group Treasury
Group Treasury is responsible for the bank’s funding,
liquidity and capital planning. The Group’s equity is
allocated to each business segment on the basis of
capital adequacy rules and how much capital is needed
based on the bank's Internal Capital Adequacy
Assessment Process (ICAAP). Group Treasury prices
all flows in the Group through an internal interest rate,
where the most important parameters are maturity,
interest fixing period, currency, and the need for liquidity
reserves.
Group Treasury’s result over time should be nearly nil,
with the exception of earnings that may arise in debt
and liquidity management within given risk mandates.
19. The fee paid to the Swedish National Debt Office for
government guaranteed funding is charged against
Group Treasury. Risk hedging by Group Treasury is
generally achieved with financial instruments. The
volatility in results over time is largely due to accountingbased fluctuations in these hedges.
Net interest income for 2013 amounted to SEK 2 013m,
compared with SEK 678m in the previous year. Of the
change, SEK 259m is due to lower fees for the
government guaranteed funding. Repurchases of
covered bonds contributed positively to the change.
Group Treasury’s net interest income has also been
strengthened by positions that have benefited from
lower market rates.
Net gains and losses on financial items at fair value for
2013 amounted to SEK -922m, compared with SEK
316m in the previous year. The main reason for the
negative result is the effects of the repurchases, which
are reflected in offsetting positive effects on net interest
income over time.
Russia and Ukraine
The Russian and Ukrainian operations are reported as
discontinued operations. During the second quarter the
sale of the Ukrainian subsidiary was finalised. The fullyear result for discontinued operations was SEK
-2 348m (-984m) and includes the reclassification of
SEK -1 875m from other comprehensive income to the
income statement in connection with the sale of the
Ukrainian subsidiary. The reclassification does not affect
Swedbank’s capital, capitalisation or cash flow and has
therefore been excluded from the Board of Directors’
dividend proposal for 2013.
The full-year result for the Russian operations amounted
to SEK -112m (61). The formal liquidation of the legal
entity OAO Swedbank is under way. The bank’s
application to revoke its banking licence in Russia was
approved on 1 October. Swedbank’s net lending in
Russia (including leasing) amounted to SEK 1bn as of
31 December. The lending portfolio in Russia, mainly
consisting of high quality corporate loans, will decrease
as customers amortise their loans. Swedbank has real
estate assets worth about SEK 83m in Russia, which
will be sold.
Ektornet
Ektornet was founded to manage and develop the
assets Swedbank repossessed after the financial crisis
in 2008-2009. Repossessed assets decreased to SEK
1 856m during the year (SEK 4 606m as of 31
December 2012). The sale of remaining properties
continues. Portions of the remaining assets are such
that the pace of sales is expected to be more protracted
going forward.
Assets taken over
SEKm
Sweden
Finland
Estonia
Latvia
Lithuania
USA
Ukraine
Total properties
Shares
Total
31 Dec
2013
0
0
160
839
142
451
243
1 835
22
1 856
31 Dec
2012
374
281
304
1 665
351
1 217
364
4 556
50
4 606
In 2013 properties were sold for SEK 2 799m (1 655)
with an aggregate capital gain of SEK 361m (212). The
sales of portions of the shareholding produced a capital
gain of SEK 82m. Sales proceeds in the fourth quarter
amounted to SEK 874m (SEK 796m for Q4 2012) with a
gain of SEK 137m (64). Sales during the fourth quarter
mainly related to a hotel in the US, a number of large
housing complexes and commercial properties in Latvia,
and a shopping centre in Ukraine. The remaining
properties in Sweden were sold as well. Property values
in the portfolio were written down by SEK 652m (392),
including SEK 277m (133) in the fourth quarter. The
majority of the write-downs are attributable to Ukraine
and the US. The full-year result was SEK -463m (-406).
Expenses decreased by 35 per cent to SEK 396m
(610).
The number of employees at the end of the period was
93, compared with 204 at year-end 2012. The number
of properties, including apartments and the like, was
1 366 (2 528 at year-end 2012), of which 783 were in
Latvia (1 695 at year-end 2012).
Group Functions & Other consists of three types of centralised business support units: Group Products, Group Staffs,
and Ektornet (which manages the remaining assets repossessed in the wake of the financial crisis) and the remainder of
previous operations in Russia and Ukraine. Group staffs, comprising Accounting & Finance (including Group Treasury
and Communication), Risk, IT, Compliance, Public Affairs, HR and Legal, operate across business segments and serve
as strategic and administrative support.
Swedbank – Year-end report 2013
Page 19 of 58
20. Eliminations
Income statement
Q4
2013
Q3
2013
Q4
2012
Net interest income
Net commissions
Net gains and losses on financial items at fair value
Other income
Total income
-16
34
0
-92
-74
-1
26
0
-98
-73
-14
19
0
-74
-69
-14
97
0
-326
-243
-19
73
0
-234
-180
Staff costs
Variable staff costs
Other expenses
Depreciation/amortisation
Total expenses
-13
0
-61
0
-74
0
0
-73
0
-73
-13
0
-56
0
-69
-13
0
-230
0
-243
-13
0
-167
0
-180
SEKm
Full-year Full-year
2013
2012
Group eliminations mainly consist of eliminations of internal transactions between Group Functions and the other
business areas.
Swedbank – Year-end report 2013
Page 20 of 58
21. Product areas
Swedbank intends to gradually expand its product reporting. This is being done outside the consolidated accounts, which
means that in most cases the figures cannot be directly traced to specific items in the financial statements. Responsibility
for the product units currently rests with Group Products within Group Functions & Other, but the results are reported in
several legal units and in the three business segments.
Card business
Swedbank issues cards and acquires card payments
from merchants in all its home markets as well as in
Denmark and Norway. Credit card operations in
Sweden, Denmark and Norway are conducted through
Entercard AB, a joint venture with Barclays Bank. Other
card business takes place within the bank. In its four
home markets as a whole, Swedbank has a market
share for card payment acquisitions and issuing of
nearly 50 per cent. When a purchase by card is made
where Swedbank is the payment acquirer, Swedbank
receives a commission. Every time a purchase is made
using a Swedbank-issued card, the bank receives
interbank compensation. Similarly, Swedbank pays
compensation to other card issuers when their cards are
used in stores where Swedbank is the payment
acquirer.
Swedbank is Europe’s fifth largest card payment
acquirer based on number of transactions. As a
payment acquirer, Swedbank enables retailers to accept
payment through card terminals and online. Revenue
mainly comes from the transaction fees received as
compensation for infrastructure, administration and
payment guarantees. As a card issuer, the bank
generates revenue for access to a card, exchange fees
for foreign purchases and interest income from
outstanding credit card balances. In card payment
acquisitions, rapidly expanding e-commerce is one of
Swedbank’s most important growth areas. In most retail
sectors, e-commerce has a growth rate far exceeding
that of traditional brick and mortar stores. Swedbank’s
payment acquisition volume in e-commerce rose by just
over 70 per cent during the year.
Swedbank’s aim is to grow in e-commerce and become
a leading player in its home markets. The potential is in
part in our market position in the physical card space
and our expertise in the payment area. For retailers, the
bank offers e-commerce solutions as a complement to
other payment solutions.
The number of transactions made by card is rising in all
of Swedbank’s home markets as a result of economic
growth and less use of cash. A large share of
transaction revenue is due more to the number of
transactions than the transaction value. This makes
issuing and acquiring revenue less volatile during
periods of slower economic growth.
Swedbank is the eleventh largest bank card issuer in
Europe based on number of transactions. Sweden is
among the countries in the world with the highest levels
of card usage. In Sweden, nearly 80 per cent of retail
purchases are made by card. Transaction growth is
about 10 per cent per year and volume growth about 5
per cent. The percentage of card transactions in stores
is also high in Estonia (55 per cent), with an annual
growth rate of about 8 per cent. In Latvia and Lithuania,
card usage is lower (35 and 20 per cent, respectively),
but the growth rate is expected to be higher than in
Sweden and Estonia.
Swedbank – Year-end report 2013
Page 21 of 58
Card related income
SEKm
Card acquiring
of which Nordic countries
of which Baltic countries
Card issuing
of which Sweden
of which Baltic countries
Net interest income, credit cards
of which Sweden
of which Baltic countries
Entercard*
Total Card related income
Full-year Full-year
2013
2012
770
647
123
1 652
1 097
555
302
67
235
1 338
4 062
775
667
109
1 434
1 066
368
223
64
159
1 291
3 723
%
-1
-3
13
15
3
51
36
5
48
4
9
* Swedbank's share of Entercard's total income. Entercard is consolidated into
Swedbank Group by the equity method.
Income growth during the year was mainly due to an
increased number of card issuance transactions as well
as higher credit volumes in Entercard. Stable card
issuance revenue in Sweden is the result of transaction
volume. Higher card issuance revenue in the Baltic
countries is due to an increased number of transactions
and higher annual fees. Lower compensation from card
payment acquisitions in the Baltic countries following an
adjustment to interbank compensation in 2012 has been
partly offset by increased card usage.
The increase in the number of acquisition transactions
was 12 per cent in Sweden, 6 per cent in Estonia, 15
per cent in Latvia and 18 per cent in Lithuania. In terms
of acquisition volume, the Nordic countries account for
about 90 per cent, although growth is higher in the Baltic
countries. Income is not growing at the same pace as
the volume of acquired payments or the number of
acquired transactions due to price pressure from
increased competition and tighter regulations. The
expansion of the payment business to Norway and
Denmark generated 2.3 per cent of transactions and 5.5
per cent of income. The number of card purchases
increased by 11 per cent during the year, with the
largest increases in Latvia and Lithuania at 18 and 16
per cent, respectively. In card issuance, the biggest
growth opportunity is in corporate cards, where the bank
has historically been weaker and where small business
customers offer significant potential.
Key ratios, cards
Card acquiring transactions, millions
Card acquiring volume, SEKbn
Issued cards, millions
Card purchases (POS), millions
POS/total card turnover, %
Full-year Full-year
2013
2012
1 776
440
7.7
1 200
66
1 595
402
7.8
1 080
63
%
11
9
-1
11
Proposal to cap interchange fees for card
transactions
In July the EU Commission presented a proposal to cap
the interchange fees paid by payment acquirers to card
issuers. The draft regulation is expected to take effect
no earlier than the fourth quarter of 2014. Swedbank is
working actively with other banks and organisations to
discuss the current proposal and ensure that regulations
22. have as sound a basis as possible. For Swedbank’s
card issuance business, it will mean lower revenue. The
credit card business will be affected more than the bank
card business, since interbank compensation there is
higher. The effect on the Swedish operations is limited,
but more significant in the Baltic countries due to the
current high level of interbank compensation. At the
same time expenses in the card payment acquiring
business will decrease. The total impact for Swedbank
depends on pricing competition between payment
acquiring services.
Insurance business
Swedbank has life insurance operations in all its home
markets and non-life operations in the Baltic countries.
Non-life insurance is offered in Sweden through a thirdparty solution with the insurance company Tre Kronor.
Insurance products are sold through the distribution
channels of Swedbank and the savings banks.
Premium payments
SEKm
Sweden
of which collective occupational
pension
of which endowment insurance
of which occupational pension
of which risk insurance
of which other
Baltic countries
of which life insurance
of which non-life insurance
Full-year Full-year
2013
2012
%
13 441
12 591
7
3 212
6 917
2 004
665
643
3 392
6 139
1 795
627
638
-5
13
12
6
1
1 061
666
395
988
619
369
7
8
7
Sweden
Swedbank’s life insurance company is the sixth largest
in the Swedish market, with a market share in premium
payments of about 7 per cent. Total premium income
rose by 7 per cent to SEK 13.4bn in 2013. In savings
products, the biggest increase is in endowment
insurance for the corporate market as a result of
information and education measures.
Over 100 000 of Swedbank’s risk protection (Trygga)
policies were sold during the period, an increase of 19
per cent year-on-year. Due to an ageing population and
shift in responsibility from society to the individual,
demand for pension and insurance products is expected
to grow. The largest potential for Swedbank in Sweden
is in risk products such as life and health insurance as
well as in occupational pensions. Today only 20 per
cent of Swedbank’s and the savings banks’ corporate
customers with revenues of SEK 1-100m have an
occupational pension solution for their employees from
Swedbank Försäkring.
Premium payments from collective and occupational
pensions amounted to SEK 5.2bn (5.2) during the year.
Premium income from occupational pensions increased,
mainly due to capital transferred from other insurers. At
the same time income from collective pensions fell. This
was mainly due to the bank’s decision to stop selling
traditional pension insurance as part of the KAP-KL
collective pension, which means that no new premiums
are being placed.
From 1 July until summer 2018 Swedbank Försäkring is
a company of choice for the collectively negotiated
occupational pension plan (ITP), which permits it to offer
Swedbank – Year-end report 2013
Page 22 of 58
collective occupational pensions to 1.5 million private
sector employees. Swedbank Försäkring offers 22 funds
(about half from Robur) with the highest aggregate
ratings of all company options.
Baltic countries
In Estonia and Lithuania, Swedbank is the largest life
insurance company, with market shares of 37 and 23
per cent, respectively. The market share in Latvia was
15 per cent. Life insurance operations are divided into
risk insurance and savings products. Swedbank mainly
focuses on risk insurance for existing loan customers in
the retail banking market, where it sees significant
opportunities to promote sound and sustainable
finances because of the limited social safety net in the
Baltic countries.
Sales of risk insurance to loan customers in Baltic
Banking were successful in 2013. Sales of credit life, a
life insurance product tied to a bank loan, increased by
5 per cent in local currency and now amount to SEK
69m. Around 32 per cent of the bank’s borrowers
currently have credit life insurance. Sales of unit linked
insurance increased by 58 per cent in terms of new
policies. Premium payments for the total life insurance
operations amounted to SEK 666m, an increase of 8 per
cent in local currency.
The market shares for non-life insurance in Estonia,
Latvia and Lithuania are 14, 3 and 1 per cent,
respectively. In non-life insurance, Swedbank mainly
offers solutions for private customers. The largest
product areas are auto and home insurance, which are
offered together with leasing and mortgages. Due to
lower auto and home sales in recent years, more focus
has been placed on other products such as loan
payment protection, which covers loan expenses in the
event of an illness or job loss, as well as homeowners
insurance sold through bank branches. Total premium
income for non-life insurance amounted to SEK 395m
during the year, an increase of 8 per cent in local
currency.
Assets under management
SEKbn
Sweden
of which collective occupational
pension
of which endowment insurance
of which occupational pension
of which other
Baltic countries
of which life insurance
31 Dec
2013
31 Dec
2012
%
118.2
103.0
15
47.6
49.6
12.4
8.6
3.4
3.4
39.3
45.8
10.0
8.1
3.2
3.2
21
8
24
7
8
8
Assets under management in the Swedish insurance
operations rose by 15 per cent to SEK 118.2bn in 2013,
of which SEK 103.5bn relates to unit linked and deposit
insurance. The increase is due to higher equity prices
and a positive net inflow. Assets under management in
the Baltic life insurance company appreciated by 4 per
cent in local currency to SEK 3.4bn. The increase
relates to unit linked insurance, which accounted for
SEK 2.1bn. The traditional managed portfolio decreased
owing to large pension disbursements.
23. Insurance related income
SEKm
Full-year Full-year
2013
2012
Sweden
of which life insurance
of which non-life insurance
Baltic countries
of which life insurance
of which non-life insurance
Total insurance related income
1 491
1 418
73
390
197
194
1 881
1 446
1 400
46
428
216
212
1 874
%
3
1
60
-9
-9
-9
0
Revenue
Swedbank’s aggregate insurance revenue amounted to
SEK 1 881m (1 874m). In the Swedish life insurance
business, falling interest rates have led to a lower return
on equity. At the same time the increase in assets under
management and an improved risk result owing to
higher volumes have contributed to higher revenue. The
total increase for Swedish life insurance was 1 per cent.
Revenue for the Swedish non-life business also rose,
partly as a result of a 10 per cent increase in the
number of contracts to nearly 225 000.
Revenue for the Baltic life and non-life businesses
decreased. In this case as well, falling interest rates
meant a lower return on the assets, primarily for the life
insurance business, where lower capital, due to the
distribution to the parent company, led to lower interest
income. Revenue for the Baltic non-life business
amounted to SEK 194m at year-end, down 8 per cent in
local currency. The decrease was mainly due to a lower
risk result caused by higher claims – following a snowy
winter early in the year – compared with 2012, which
had a relatively low level of claims.
Asset management operations
Swedbank’s asset management operations are
conducted through the Swedbank Robur group in
Swedbank’s four home markets and Norway. In total,
Swedbank Robur offers around 120 funds as well as
discretionary asset management, including
management of pension assets. Fund assets under
management amounted to SEK 889bn (782) at the end
of the period, of which SEK 585bn was in Sweden,
where the market share was 24 per cent as of 31
December in terms of assets under management.
Discretionary assets under management amounted to
SEK 278bn.
Of the year’s total net inflow to the Swedish fund
market, the majority was to mixed funds (SEK 55.6bn),
equity funds (SEK 42.6bn) and short-term fixed income
funds (SEK 15.6bn). Long-term fixed income funds saw
a net outflow. The total net inflow to Swedbank Robur’s
funds in Sweden was SEK 9.3bn, where flows mainly
went to investment solutions (mixed funds) and shortterm fixed income funds. The inflow corresponded to a
market share of 8.8 per cent as of 31 December.
Measures to clarify and simplify the customer offering
continued in 2013, with a total of 14 fund mergers and
discontinued funds.
Asset management
Key ratios, SEKbn
Total income, SEKm
Assets under management
of which Sweden
of which Baltics
of which Norway
Discretionary asset management
of which Sweden
of which Baltics
Full-year Full-year
2013
2012
4 113
3 715
611
529
589
510
20
17
2
2
278
253
276
251
2
2
%
11
16
15
17
14
10
10
0
Income from capital market products amounted to SEK
4 113m during the year, an increase of 11 per cent from
2012. The improvement was mainly from an increase in
average capital as a result of higher equity prices and
positive net flows. Fund assets increased by 15 per
cent. Fourth quarter income rose by SEK 94m. Average
assets under management rose by 3 per cent.
Income from institutional management in Sweden,
excluding Swedbank Robur’s funds, amounted to SEK
126m during the year, a decrease of SEK 47m
compared with 2012. The decrease was mainly because
the Folksam LO funds have been managed by
Swedbank Robur since the fourth quarter 2012, which is
reflected in a corresponding increase in fund
management.
Swedbank Robur’s actively managed funds are
presented at least twice a year in “Dina Fonder” (Your
Funds). In November and December, two Robur funds Allemansfond Komplett and Kapitalinvest - were
criticized in the Swedish media which stated that the
funds were not actively managed despite being
marketed as such, as well as having the same fee as
other actively managed funds. In addition, it was stated
that the marketing was inadequate. On 24 January the
Swedish Consumer Agency informed its decision to
assess the marketing of these two funds. The Swedish
Financial Supervisory Authority has said it would look
into this matter from a sector perspective in spring.
Payment operations
Swedbank is a leader in payment and cash
management products in its four home markets. Growth
in the payment area is based on economic growth and
on customers’ increasing use of payment means other
than cash.
The payment area is strongly affected by changes in the
operating environment. Rapid technological
developments are creating a challenge in the form of
increased competition from e-commerce companies.
Swedbank is well prepared in this regard in terms of
infrastructure and customer base as well as
opportunities to capitalise on economies of scale when
unified European legislation facilitates cross-border
trade in products and services. The development of a
common payment zone for the euro enables the bank to
offer services to customers with eurozone operations
without having to set up business in every country. It
also facilitates increased coordination and efficiency
improvements in the bank’s products and systems.
Online payment services are an important growth area
for Swedbank. Today over 2.99 million customers in
Sweden and 2.16 million in the Baltic countries have
access to payment services through the Internet Bank
and the Mobile Bank. The number of transactions
through these channels grew by 8.1 per cent in 2013. In
Swedbank – Year-end report 2013
Page 23 of 58
24. addition, there are over 700 000 users of BankID, which
facilitates payments online and by mobile phone. Swish,
a solution for mobile payments shared with other
Swedish banks, has over 726 000 customers, of which
just over 287 000 are customers of Swedbank and the
savings banks
Payments
Income, SEKm
When doing business abroad, companies face very
different risks than at home. Swedbank’s Trade Finance
offering gives importers and exporters the opportunity to
mitigate financial risk and improve liquidity in markets
where normal means of payment do not work. The
principal products are cash against documents (CAD),
letters of credit and bank guarantees. Customers
increasingly demand customised solutions and new
ways to improve liquidity. As these markets mature, the
business shrinks. In times of crisis demand tends to
grow, just like in situations where companies enter new
markets. One challenge for the bank’s Trade Finance
offering is the new payment and financing solutions
being arranged between importers and exporters (Open
Account and Supply Chain Finance), which in recent
years have accounted for a larger share of growing
global trade.
Lending/deposits
Payments
Key figures
International payments (millions)
of which Sweden
of which Baltic countries
Domestic payments (millions)
of which Sweden
of which Baltic countries
E-services payments (millions)
of which Sweden
of which Baltic countries
Trade Finance, new deals
of which Sweden
of which Baltic countries
Factoring portfolio, SEKm
of which Sweden
of which Baltic countries
Full-year Full-year
2013
2012
10.0
4.4
5.6
841.6
621.3
220.3
187.0
162.9
24.1
21 647
9 032
12 615
4 033
2 267
1 767
9.2
4.2
5.1
800.0
591.8
208.2
116.8
96.4
20.3
23 361
9 888
13 473
4 006
2 260
1 746
%
8
6
10
5
5
6
60
69
19
-7
-9
-6
1
0
1
Domestic payments include salary and mass payments, giro payments, direct
debit payments, internet payments.
E-services payments include E-invoices, bank link payments, mobile phone
top-up transactions, number of signing-transactions and ID transactions
through E-ID/BankID.
Since Bankomat AB took over responsibility for
Swedbank’s ATMs, Swedbank pays Bankomat AB a
commission, which explains the lower net commission
income. For more information, see Swedish Banking on
page 12.
Swedbank – Year-end report 2013
Page 24 of 58
Net commission income
of which Nordic countries
of which Baltic countries
Full-year Full-year
2013
2012
977
475
502
1 133
690
443
%
-14
-31
13
Swedbank’s lending operations are concentrated in
Sweden, Estonia, Latvia and Lithuania. In addition,
lending is provided in Norway and to a lesser extent in
certain other countries such as Finland, Denmark and
the US. Loan products account for about 70 per cent of
Swedbank’s assets on the balance sheet.
Swedbank’s total lending to private customers and
corporations amounts to SEK 1 215bn (1 184 as of 31
December 2012). The largest part consists of household
lending, with mortgages to Swedish private customers
and tenant-owner associations accounting for about 50
per cent of the total. Swedbank’s market share for
Swedish mortgages is 25 per cent. Over one million
customers obtain their mortgages through Swedbank
Mortgage, and lending is geographically distributed
throughout the country.
Swedbank is also a major player in corporate lending in
Sweden, with lending of SEK 441bn and a market share
of 17 per cent as of 30 November (unchanged from 31
December 2012). Major sectors in Sweden include
property-related lending, which accounts for SEK
166bn, and the forestry and agricultural sector with SEK
68bn, where Swedbank has a dominant position.
Swedbank is the largest lender in the Baltic countries,
with market shares of 20-40 per cent. Estonia accounts
for nearly half of Swedbank’s Baltic loan portfolio, and
there Swedbank has a market share of nearly 40 per
cent. Total lending in the Baltic countries amounts to
SEK 119bn, half of which is to households and half to
corporates. Major sectors for corporate lending in the
Baltic countries include commercial real estate and
manufacturing.
Swedbank is also a big player in deposits in its home
markets. Total deposit volume as of 31 December
amounted to SEK 599bn (558), of which SEK 341bn
(332) was to private customers and SEK 258bn (226) to
corporate customers. About 81 per cent of Swedbank’s
total deposit volume was in its Swedish operations.
For more information on Swedbank’s lending and
deposits, see each business segment.
25. Financial information - contents
Group
Page
Income statement, condensed
26
Statement of comprehensive income, condensed
27
Key ratios
27
Balance sheet, condensed
28
Statement of changes in equity, condensed
29
Cash flow statement, condensed
30
Notes
Note 1 Accounting policies
30
Note 2 Critical accounting estimates
32
Note 3 Changes in the Group structure
32
Note 4 Operating segments (business areas)
33
Note 5 Net interest income
35
Note 6 Net commissions
36
Note 7 Net gains and losses on financial items at fair value
37
Note 8 Other expenses
38
Note 9 Credit impairments
38
Note 10 Loans
39
Note 11 Impaired loans etc.
40
Note 12 Assets taken over for protection of claims and cancelled leases
40
Note 13 Credit exposures
40
Note 14 Intangible assets
41
Note 15 Amounts owed to credit institutions
42
Note 16 Deposits from the public
42
Note 17 Debt securities in issue
42
Note 18 Derivatives
43
Note 19 Financial instruments carried at fair value
43
Note 20 Pledged collateral
46
Note 21 Offsetting financial assets and liabilities
46
Note 22 Capital adequacy
47
Note 23 Risks and uncertainties
49
Note 24 Discontinued operations
49
Note 25 Related-party transactions
49
Note 26 Swedbank’s share
50
Note 27 Effects of changes in accounting policies
51
Parent company
Income statement, condensed
53
Statement of comprehensive income, condensed
53
Balance sheet, condensed
54
Statement of changes in equity, condensed
55
Cash flow statement, condensed
55
Capital adequacy
56
More detailed information can be found in Swedbank’s fact book, www.swedbank/se/ir, under Financial information and
publications.
Swedbank – Year-end report 2013
Page 25 of 58