The Estonian Economy - 2010 September
•
0 j'aime•283 vues

Swedbank was founded in 1820, as Sweden’s first savings bank was established. Today, our heritage is visible in that we truly are a bank for each and every one and in that we still strive to contribute to a sustainable development of society and our environment. We are strongly committed to society as a whole and keen to help bring about a sustainable form of societal development. Our Swedish operations hold an ISO 14001 environmental certification, and environmental work is an integral part of our business activities.

Recommandé
Contenu connexe
Tendances
Tendances (20)
En vedette
En vedette (8)
Similaire à The Estonian Economy - 2010 September
Similaire à The Estonian Economy - 2010 September (20)
Plus de Swedbank
Plus de Swedbank (20)
Dernier
Dernier (20)
The Estonian Economy - 2010 September
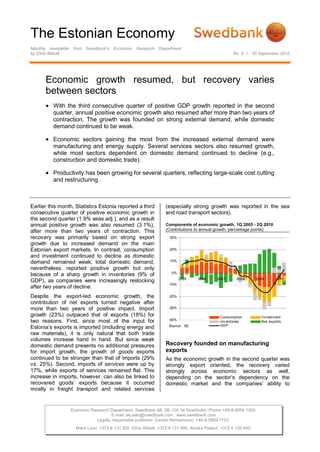
- 1. The Estonian Economy Monthly newsletter from Swedbank’s Economic Research Department by Elina Allikalt No. 4 • 30 September 2010 Economic Research Department. Swedbank AB. SE-105 34 Stockholm. Phone +46-8-5859 1000. E-mail: ek.sekr@swedbank.com www.swedbank.com Legally responsible publisher: Cecilia Hermansson, +46-8-5859 7720. Maris Lauri, +372 6 131 202. Elina Allikalt, +372 6 131 989. Annika Paabut, +372 6 135 440. Economic growth resumed, but recovery varies between sectors With the third consecutive quarter of positive GDP growth reported in the second quarter, annual positive economic growth also resumed after more than two years of contraction. The growth was founded on strong external demand, while domestic demand continued to be weak. Economic sectors gaining the most from the increased external demand were manufacturing and energy supply. Several services sectors also resumed growth, while most sectors dependent on domestic demand continued to decline (e.g., construction and domestic trade). Productivity has been growing for several quarters, reflecting large-scale cost cutting and restructuring. Earlier this month, Statistics Estonia reported a third consecutive quarter of positive economic growth in the second quarter (1.9% seas.adj.), and as a result annual positive growth was also resumed (3.1%), after more than two years of contraction. This recovery was primarily based on strong export growth due to increased demand on the main Estonian export markets. In contrast, consumption and investment continued to decline as domestic demand remained weak; total domestic demand, nevertheless, reported positive growth but only because of a sharp growth in inventories (9% of GDP), as companies were increasingly restocking after two years of decline. Despite the export-led economic growth, the contribution of net exports turned negative after more than two years of positive impact. Import growth (23%) outpaced that of exports (18%) for two reasons. First, since most of the input for Estonia’s exports is imported (including energy and raw materials), it is only natural that both trade volumes increase hand in hand. But since weak domestic demand presents no additional pressures for import growth, the growth of goods exports continued to be stronger than that of imports (29% vs. 25%). Second, imports of services were up by 17%, while exports of services remained flat. This increase in imports, however, can also be linked to recovered goods’ exports because it occurred mostly in freight transport and related services (especially strong growth was reported in the sea and road transport sectors). Components of economic growth, 1Q 2005 - 2Q 2010 (Contributions to annual growth, percentage points) -40% -30% -20% -10% 0% 10% 20% 30% 2005 2006 2007 2008 2009 2010 Consumption Inv estment Inv entories Net exports GDPSource: SE Recovery founded on manufacturing exports As the economic growth in the second quarter was strongly export oriented, the recovery varied strongly across economic sectors as well, depending on the sector’s dependency on the domestic market and the companies’ ability to
- 2. The Estonian Economy Monthly newsletter from Swedbank’s Economic Research Department, continued Nr 4 • 30 September 2010 2 (4) adjust and restructure according to the changing economic situation. Structure of value added growth in selected economic activities, 1Q 2006 - 2Q 2010 (Contributions to annual growth, percentage points) -20% -15% -10% -5% 0% 5% 10% 15% 2006 2007 2008 2009 2010 Other Real estate, renting etc. Transport, storage, communic. Domestic trade Cons- truction Manu- f acturing annual growth Source: SE, Swedbank calculations Manufacturing sales, Jan 2007 - Jul 2010 (Annual growth, three-month averages) -40% -30% -20% -10% 0% 10% 20% 30% 40% 50% 2007 2008 2009 2010 Domestic Export TotalSource: SE As mentioned above, goods’ exports were up by a strong 29% in the second quarter. Thus, the biggest value-added growth, of 20% was registered in the manufacturing sector, which contributed 3% to total economic growth. Although manufacturing was one of the rare sectors to show growth already in the first quarter, its impact increased significantly in the second (see chart). The strongest recoveries in manufacturing were seen in electric and optical appliances, wood and wood products, and metal and metal products. The monthly foreign trade figures show that the nominal export growth of these product groups was 29%, 45%, and 69%, respectively, in the second quarter. The main export partners were Finland, Sweden, and Russia, with export flows to those countries increasing by up to 40% in an annual comparison. The only manufacturing sector that continued to contract was food products, beverages, and tobacco, due to its stronger dependency on domestic demand developments. The manufacturing of textile products and building materials, which was also hit hard by slumping domestic demand, managed to resume positive growth in the second quarter, but only by 5%. Manufacturing sectors, 1Q 2007 - 2Q 2010 (Contributions to annual value added growth, percentage points) -35% -25% -15% -5% 5% 15% 25% 2007 2008 2009 2010 other transport equipment electrical appliances metals building materials rubber, plas- tic, chemicals wood, paper f ood, bev erage total Source: SE, Swedbank calculations Strong export growth also boosted the output of the energy supply sector (10% annual increase) and the mining sector (17%), which is related to the energy sector by electricity production. However, despite strong growth, the contribution to overall growth of those sectors was rather small (0.4%), due to their small share in value-added output. Nevertheless, Estonia is the only electricity net exporter in the Baltic region (domestic consumption makes up about two-thirds of total production), covering a large part of the electricity deficit in Latvia and Lithuania, and it also exports to Finland. As the economic activity in the other Baltic countries continues to recover, Estonia’s electricity exports are expected to remain strong in order to cover their growing deficits. The best performing services sector was financial intermediation, growing by 11% annually and contributing 0.4% to overall growth. The growth of this value added was most influenced by the increase in incomes by the banks through service fees, but the rising net premiums of insurance companies also played a part. Also, the real estate, renting, and other business activities sector, which covers the biggest share of total value added in the economy (one-fifth in the second quarter) reported positive, albeit marginal, growth after two years of
- 3. The Estonian Economy Monthly newsletter from Swedbank’s Economic Research Department, continued Nr 4 • 30 September 2010 3 (4) decline, of 1%, thereby contributing 0.2% to the economic recovery. Continuously declining activities affected by weak domestic market Construction was among the sectors hardest hit during the recession after the bursting of the real estate bubble; as the second- quarter data show, recovery to positive growth has yet to be seen – value added in construction fell by 8%, weakening value-added growth by 0.5%. The slump in the domestic market has been so severe that, although many Estonian companies are targeting more works abroad (the share of works done abroad increased to 9% in 2010, up from just 2-3% during 2006-2007), overall construction works carried out are continuing to fall. While the construction of buildings is at its lowest level since the boom years, civil engineering construction has been much more resilient, mostly supported by public sector projects and EU funds. Moreover, the draft budget for 2011 includes a record share for investments (16% of total budget, or ca EUR 1bn) with roughly one- fourth of this targeted to road construction. As private sector projects are to remain scarce, the public sector will be the main driver of recovery in the construction sector. Construction sector, 1Q 2005 - 2Q 2010 -80 -60 -40 -20 0 20 40 60 2005 2006 2007 2008 2009 2010 Conf idence, points Volumes, annual growth, % Value added, annual growth, %Source: SE, DG ECFIN The transport, storage, and communications sector, which is rather dependent on domestic economic activity, continued to contract in the second quarter as well, by 3%, slowing value-added growth by 0.3%. Revenues of transport service companies grew by 14% annually in nominal terms, with the biggest gainers being freight transport and road transport, growing by 18% and 21%, respectively; all other sectors, except railroad transport, reported growing revenues as well. Most of this growth was supported by increased revenues from services provided abroad, as growth on the domestic market was much slower. Revenues in storage- and transport-related services have been growing for a year now, accelerating to 24% in the second quarter. The wholesale and retail trade sector reported marginal 0.3% growth, supported by an increase in wholesale trade. As roughly three-fourths of domestic trade is done through wholesale, its growth had a big impact on the outcome. Wholesale trade increased in all major categories, including food products and machinery and equipment. Retail trade growth, as the closest indicator to private consumption, is, not surprisingly, still negative. Domestic trade, 1Q 2005 - 2Q 2010 (Annual growth of nominal sales) -30% -20% -10% 0% 10% 20% 30% 40% 2005 2006 2007 2008 2009 2010 Retail trade WholesaleSource: SE Sales of tourism and catering services, 1Q 2006 - 2Q 2010 (Annual growth) -40% -30% -20% -10% 0% 10% 20% 30% 40% 50% 2006 2007 2008 2009 2010 No of f oreign tourists Accommodation Catering Touring serv icesSource: SE Although value added by the hotels and restaurants sector declined by 3%, this had only a marginal effect on the overall economic outcome. Here as well, the downturn was prolonged by weak domestic demand, especially with regard to catering
- 4. The Estonian Economy Monthly newsletter from Swedbank’s Economic Research Department, continued Nr 4 • 30 September 2010 4 (4) services. In contrast, the number of tourists visiting Estonia has been record-high this year, supporting the recovery in the accommodations sector. Other tourism-related services, however, are lagging, as foreigners are increasingly visiting Estonia for reasons other than just “sightseeing” and are tending to travel on their own, for shorter periods, and to spend less. Overall, the sectors that are more affected by weak domestic demand and continuously falling private consumption will catch up as domestic demand starts to recover more; we see this happening by the end of this year, but more noticeably next year. However, export growth is expected to outpace that of private consumption for at least a couple of years; this, in turn, will further encourage companies to restructure and look for new markets. Productivity growing The most positive data from the second quarter are that, together with a resumption in economic growth, productivity is continuing to increase further, as costs are still declining. Depending on which measure is used, productivity has been gaining ground for many quarters. The manufacturing sector, which was the engine for economic growth, is leading the productivity growth figures; even more, the nominal levels are exceeding those seen during the highest production years (2006-2007). This has been achieved in a situation when, the number of hours worked has fallen by about 30% from the peak, the production volumes are about 20% lower. Despite harsh cost cutting, manufacturing was the rare sector to report an increase in investment in the second quarter (of 43% vs. a. 12% decline on average in the economy), with the strongest increases seen in the purchases of vehicles, computers, and other equipment and machinery. The number of employed, as well as hours worked, is still decreasing in an annual comparison (however, small seasonal quarterly growth was reported). As positive economic growth resumed, companies started adding working hours to those already employed, resulting in a smaller decline in hours worked vs. people employed (-6% and -8%, respectively). With economic growth picking up the pace in the coming quarters, companies will inevitably have to start increasing employment to meet the growing demand. This, in turn, will slow productivity gains, even more because the biggest cuts in costs are already behind and most of the inevitable restructuring has already been done. Enterprises productivity, 1Q 2006 - 2Q 2010 (Annual growth) -30% -20% -10% 0% 10% 20% 30% 2006 2007 2008 2009 2010 Value added growth Hour productiv ity No of hours workedSource: SE Swedbank Economic Research Department SE-105 34 Stockholm Phone +46-8-5859 1028 ek.sekr@swedbank.com www.swedbank.com Legally responsible publisher Cecilia Hermansson, +46-88-5859 7720 Maris Lauri +372 6 131 202 Elina Allikalt +372 6 131 989 Annika Paabut +372 6 135 440 Swedbank’s monthly newsletter The Estonian Economy is published as a service to our customers. We believe that we have used reliable sources and methods in the preparation of the analyses reported in this publication. However, we cannot guarantee the accuracy or completeness of the report and cannot be held responsible for any error or omission in the underlying material or its use. Readers are encouraged to base any (investment) decisions on other material as well. Neither Swedbank nor its employees may be held responsible for losses or damages, direct or indirect, owing to any errors or omissions in Swedbank’s monthly newsletter The Estonian Economy.