Kasper Johansen_Validation of Landsat-based time-series of Persisten Green-vegetation fraction for Australia
•
1 j'aime•1,775 vues


Recommandé
Recommandé
Contenu connexe
Similaire à Kasper Johansen_Validation of Landsat-based time-series of Persisten Green-vegetation fraction for Australia
Similaire à Kasper Johansen_Validation of Landsat-based time-series of Persisten Green-vegetation fraction for Australia (20)
Plus de TERN Australia
Plus de TERN Australia (20)
Kasper Johansen_Validation of Landsat-based time-series of Persisten Green-vegetation fraction for Australia
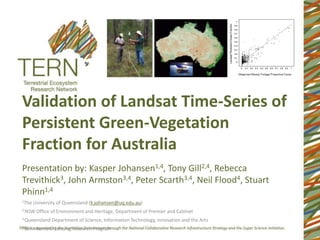
- 1. Validation of Landsat Time-Series of Persistent Green-Vegetation Fraction for Australia Presentation by: Kasper Johansen1,4, Tony Gill2,4, Rebecca Trevithick3, John Armston3,4, Peter Scarth3,4, Neil Flood4, Stuart Phinn1,4 1The University of Queensland (k.johansen@uq.edu.au) 2 NSW Office of Environment and Heritage, Department of Premier and Cabinet 3 Queensland Department of Science, Information Technology, Innovation and the Arts 4 Joint Remote Sensing Research Program
- 2. Outline • Introduction: AusCover Activities and Products • National Persistent Green Vegetation Fraction • Objectives • Methods • Results • Validation • Main Use of Product • Conclusions and Potential Future Work
- 3. AusCover Activities and Products
- 6. AusCover field and airborne campaigns Field-based Measurements Airborne Measurements Satellite Based Measurements Time-Series Measurements
- 7. AusCover Products • The vertically-projected fraction of long-term, persistent green vegetation (nominally woody vegetation) cover • Common essential variable for ecological and ecosystem models of vegetation structure and dynamics
- 8. National Landsat-based Persistent Green Vegetation Fraction Objective: to produce a calibrated and validated Landsat based Persistent Green Vegetation (PGV) Fraction map based on a 2000 to 2010 time-series of the whole of Australia • Fully automated model • Downloaded >4000 Landsat images from USGS Earth Explorer • Selection process: cloud cover, driest time of year, sun elevation, anniversary dates, TM and ETM+ SLC-on • Processing stream also produces time-series fractional cover and water masks
- 9. Persistent Green Vegetation Fraction - Methods Calibrated Normalised Masks Modelling/ radiance time reflectance calibration series Modelling/ Fractional cover Masked green Persistent calibration cover green-veg fraction • Pre-processing of data to BRDF/topographically corrected reflectance. • Masking (cloud, cloud shadow, snow, topographic shadow, high incidence angle, water) • Unmixing algorithm and field data to create fractional cover images (green, non-green, bare) • Time-series algorithm, statistics and field data to classify persistent-green vegetation and its fractional cover • LiDAR data used to validate persistent-green vegetation fraction
- 10. Persistent Green Vegetation Fraction – Pre-Processing • At-sensor radiance
- 11. Persistent Green Vegetation Fraction – Pre-Processing • Standardised reflectance • Topographic correction • BRDF correction
- 12. Persistent Green Vegetation Fraction - Masks • Cloud and cloud shadow mask based on published algorithm (Fmask): Zhu, Z. and Woodcock, C.E. (2012). Object-based cloud and cloud shadow detection in Landsat imagery. Remote Sensing of Environment 118 (2012) 83-94. • Water mask based on discriminant analysis: Danaher, C. Collett, L (2006). Development, optimisation and multi-temporal application of a simple Landsat based water index, 13th ARSPC, Canberra. • Topographic shadow mask • High incidence angle mask (> 80 degrees) • Not perfect, so robust statistical methods required to account for outliers in time-series e.g. due to misclassified cloud
- 13. Persistent Green Vegetation Fraction – Fractional Cover Time-Series • Fractional cover uses a constrained unmixing model with endmembers derived from field sampling. • Creates an image with the percentage Bare, Green and non-green fractions • Field data from 800 sites collected using consistent, nationally agreed protocol • Overall RMSE of 11% Green Green Non-green Bare ground Bare Non-green
- 14. Persistent Green Vegetation Fraction - Classification and Prediction • Training data obtained from a range of sources • Approximately 5100 sites of which 3800 are persistent green • Decision tree classifier based on robust regression statistics used to classify each pixel as persistent or non-persistent green vegetation • Robust regression statistics used to predict the persistent green fraction SOURCE DESCRIPTION QLD DSITIA Fractional-cover field sites ABARES Fractional-cover field sites NSW OEH Image-interpretation (SPOT- 5/Google Earth) of woody/not- woody vegetation cover NT Bushfires DBH field sites NT NRETAS Fractional-cover field sites ACRIS Locations of low-foliage scrub Persistent green WA Woody-vegetation sampling Not persistent green sites QLD Biomass field sites Herbarium
- 15. Classification and Prediction 1 • Persistent green areas show 0.9 0.8 low variation in green fraction green fraction 0.7 over time, and a minimum 0.6 0.5 above a threshold. 0.4 0.3 • Robust regression fit to time- 0.2 0.1 series of green fraction for use 0 0 1000 2000 3000 4000 in the classification of day persistent and non-persistent green vegetation. max max min min Not PGV mask mask Variation in time-series Minimum fraction in time-series Persistent green fraction
- 16. Persistent Green Vegetation Fraction max min Non-PGV mask
- 17. Persistent Green Vegetation Fraction max min Non-PGV mask
- 18. Persistent Green Vegetation Fraction max min Non-PGV mask
- 19. Persistent Green Vegetation Fraction max min Non-PGV mask
- 20. Persistent Green Vegetation Fraction max min Non-PGV mask http://tern-auscover.science.uq.edu.au/thredds/catalog/ auscover/persistentgreen/persistentGreen/catalog.html
- 21. Persistent Green Vegetation Fraction - Validation • Accuracy statistics for persistent/non-persistent green vegetation classification • Persistent green vegetation fraction estimates compared to field-observed woody foliage cover measurements (SLATS star transects) Non-persistent Persistent Non- 878 440 persistent Persistent 457 3366 Overall accuracy 0.826 Non-persistent producer’s accuracy 0.658 r2: 0.859 Non-persistent user’s accuracy 0.666 Slope: 0.928 Persistent producer’s accuracy 0.884 Intercept: 0.005 Persistent user’s accuracy 0.880
- 22. Persistent Green Vegetation Fraction – Airborne LiDAR Validation • Collation of Riegl LMS-Q560 and Riegl LMS-Q680i waveform LiDAR datasets captured within the temporal extent of the product (2000-2010) • Woody Foliage Projective Cover estimates from field calibration of LiDAR Pgap • Comparison with Landsat persistent green extent and cover fractions
- 23. Main Uses of PGV Map Main use would be for: • Determining (1) Wooded Extent; (2) Forest Extent; (3) Forest Density/Forest Crown Cover/Foliage Cover; (4) Rangeland Extent • Correcting fractional cover to ground cover • Evaluate the effectiveness of management activities More experimental use: • Carbon Applications – Basal Area • Support land-cover/land use/biodiversity/carbon mapping • Greenness trends in regions • Mapping water bodies across the landscape • Mapping vegetation connectivity across the landscape
- 24. Main Uses of PVG Map
- 25. Future Work & Conclusions Future Work • Additional USGS imagery back to 1986 will allow a longer time-series to be used, improving accuracy • Use of all images in the time-series will allow better discrimination of the persistent green fraction and may enable detection of woody thickening. Conclusions • Produced nationally consistent calibrated and validated map of persistent green vegetation fraction at Landsat scale • Data and metadata are freely accessible through the TERN Data Discovery Portal • Working with state and federal government agencies and researchers associated with AusCover and TERN enabled this work
- 26. Acknowledgements AGENCY PEOPLE ABARES Jasmine Rickards NT Bushfires Andrew Edwards NT NRETAS Nick Cuff ACRIS / CSIRO Gary Bastin WA DEC Graeme Behn Airborne Research Australia Jorg Hacker Monash Jason Beringer CDU Stefan Maier QLD Herbarium NSW Office of Environment and Heritage Tim Danaher
- 27. Validation of Landsat Time-Series of Persistent Green-Vegetation Fraction for Australia Presentation by: Kasper Johansen1,4, Tony Gill2,4, Rebecca Trevithick3, John Armston3,4, Peter Scarth3,4, Neil Flood4, Stuart Phinn1,4 1The University of Queensland (k.johansen@uq.edu.au) 2 NSW Office of Environment and Heritage, Department of Premier and Cabinet 3 Queensland Department of Science, Information Technology, Innovation and the Arts 4 Joint Remote Sensing Research Program