The State of the Solar Industry: 2012
•
1 j'aime•677 vues

Produced by The Solar Foundation with support from the U.S. Department of Energy SunShot Solar Outreach Partnership

Recommandé
Recommandé
Contenu connexe
Tendances
Tendances (20)
En vedette
En vedette (8)
Similaire à The State of the Solar Industry: 2012
Similaire à The State of the Solar Industry: 2012 (20)
Plus de The Solar Foundation
Plus de The Solar Foundation (20)
Dernier
Dernier (20)
The State of the Solar Industry: 2012
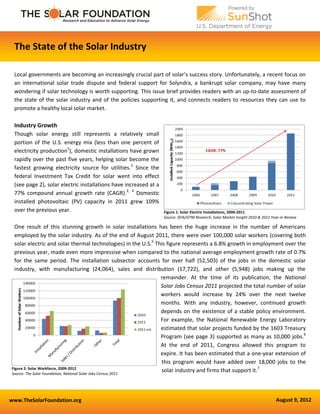
- 1. www.TheSolarFoundation.org August 9, 2012 Figure 1: Solar Electric Installations, 2006-2011 Source: SEIA/GTM Research, Solar Market Insight 2010 & 2011 Year-in-Review The State of the Solar Industry Local governments are becoming an increasingly crucial part of solar’s success story. Unfortunately, a recent focus on an international solar trade dispute and federal support for Solyndra, a bankrupt solar company, may have many wondering if solar technology is worth supporting. This issue brief provides readers with an up-to-date assessment of the state of the solar industry and of the policies supporting it, and connects readers to resources they can use to promote a healthy local solar market. Industry Growth Though solar energy still represents a relatively small portion of the U.S. energy mix (less than one percent of electricity production1 ), domestic installations have grown rapidly over the past five years, helping solar become the fastest growing electricity source for utilities.2 Since the federal Investment Tax Credit for solar went into effect (see page 2), solar electric installations have increased at a 77% compound annual growth rate (CAGR).3, 4 Domestic installed photovoltaic (PV) capacity in 2011 grew 109% over the previous year. One result of this stunning growth in solar installations has been the huge increase in the number of Americans employed by the solar industry. As of the end of August 2011, there were over 100,000 solar workers (covering both solar electric and solar thermal technologies) in the U.S.5 This figure represents a 6.8% growth in employment over the previous year, made even more impressive when compared to the national average employment growth rate of 0.7% for the same period. The installation subsector accounts for over half (52,503) of the jobs in the domestic solar industry, with manufacturing (24,064), sales and distribution (17,722), and other (5,948) jobs making up the remainder. At the time of its publication, the National Solar Jobs Census 2011 projected the total number of solar workers would increase by 24% over the next twelve months. With any industry, however, continued growth depends on the existence of a stable policy environment. For example, the National Renewable Energy Laboratory estimated that solar projects funded by the 1603 Treasury Program (see page 3) supported as many as 10,000 jobs.6 At the end of 2011, Congress allowed this program to expire. It has been estimated that a one-year extension of this program would have added over 18,000 jobs to the solar industry and firms that support it.7Figure 2: Solar Workforce, 2009-2012 Source: The Solar Foundation, National Solar Jobs Census 2011
- 2. The Solar Foundation 575 7th Street NW, Suite 400 Washington, DC 20004 (202) 469-3750 www.TheSolarFoundation.org Falling Costs This impressive industry growth has translated into plummeting costs for solar customers. For the first quarter of 2012, the installed cost for a PV solar energy system, averaged across all sectors, was just $4.44/Watt (W). As illustrated in the chart at the right, installed costs for residential and commercial systems averaged $5.89/W and $4.63/W, respectively.8 Such dramatic declines in installed costs have brought solar’s levelized cost of electricity, a metric that considers lifetime costs associated with energy technologies, down to between $0.11/kilowatt hour (kWh) and $0.25/kWh.9 These prices are bringing solar closer to becoming competitive with electricity generated from conventional sources. This “grid parity”i already exists under specific circumstances in some U.S. markets and is expected to spread quickly over the next decade, with some projections indicating that, by 2021, one in three Americans will be able to “go solar” for less than the cost of electricity generated from conventional fuels.10 Policies Supporting Solar Federal Policies The precipitous growth of the solar industry in recent years can be attributed, at least in part, to the support solar energy has received from the federal government. As one might expect, industry growth has been commensurate with the growth of these incentives and subsidies. In a report published in July 2011, the Energy Information Administration estimated federal subsidies and support for solar energy totaled over $1.1 billion in 2010 – only 3% of total federal energy support that year. However, as the report’s authors note, providing a single year snapshot of the energy subsidy landscape “does not capture the imbedded effects of subsidies that may have occurred over many years across all energy fuels and technologies.”11 Properly understanding solar energy subsidies requires placing them in the proper historical context. Federal support for solar has primarily taken the form of tax incentives. Since this intermittent support began in the late 1970s, federal tax preferences for solar energy technologies totaled approximately $15 billion through 2010. In contrast, conventional energy sources have received much more federal support over their lifetimes: nuclear energy has received nearly $70 billion in incentives, coal has received just over $100 billion, and oil has benefitted from over $350 billion in federal support.12 The main forms of federal support for solar energy are listed below. Note that many of these provisions have already expired; by contrast, federal support for fossil fuels and nuclear energy is currently set to continue indefinitely.13 Federal Tax Policies Residential and Business Investment Tax Credits (ITC) – Provides an income tax credit equal to 30% of qualified expenditures on solar energy equipment. Expires 12/31/2016.14 This policy has proven useful for not only stimulating investment in solar energy systems, but in delivering a positive net benefit to the federal i Definitions of “grid parity” vary. The study cited herein defines grid parity as the point at which “solar electricity – without subsidies – is equal to or lower than the residential retail electricity rate.” Page 2 Figure 3: The Declining Installed Cost of Solar, 2010-2012 Source: SEIA/GTM Research, Solar Market Insight Q1 2012
- 3. The Solar Foundation 575 7th Street NW, Suite 400 Washington, DC 20004 (202) 469-3750 www.TheSolarFoundation.org government and taxpayers. In a paper recently published by the U.S. Partnership for Renewable Energy Finance (U.S. PREF), it was found that the ITC can yield a 10% internal rate of return for the federal government.15 Modified Accelerated Cost-Recovery System (MACRS) – Allows businesses to take depreciation deductions for their investments in solar energy property and other renewable energy systems. This depreciation is “accelerated” in that, rather than taking place over the entire useful life of the system, these deductions are taken in the first five years after the equipment is placed in service. Eligible equipment placed in service before 12/31/2012 is entitled to “bonus depreciation” of 50%, allowing system owners to deduct half of the equipment’s cost basis in the year the system is placed in service.16 1603 Treasury Program – Provided cash payments in lieu of the Business ITC. Expired 12/31/2011.17 48C Manufacturing Tax Credit – Provided a tax credit equal to 30% of a business’s investment in clean energy manufacturing.18 Funding for this program was capped at $2.3 billion, which was fully allocated in November 2011. Federal Financial Support U.S. Department of Energy Loan Guarantee Programs19 – Consists of three programs, two of which provide support for solar and other renewables: o 1703 Program – Provides loan guarantees for innovative technologies that “avoid, reduce, or sequester” air pollutants or greenhouse gases. The cost of this guarantee (known as a “credit subsidy cost”) is paid by the applicant. o 1705 Program – Provided loan guarantee for renewable, biofuel, or electric transmission projects. Credit subsidy costs were covered by an appropriation from the federal government. All loan guarantees under this program were issued by 9/30/2011. State Policies Many states across the nation offer incentives similar to those available at the federal level (such as income tax credits), as well as a number of additional tax and financial incentives. Additionally, states can enact mandates addressing certain energy-related activities within their jurisdiction, altering the manner in which energy is generated and transmitted to promote renewable energy development within their borders. States can also offer tax incentives or grants to companies that establish facilities associated with certain economic activities within their borders. State Tax Policies Income Tax Credits – Many states offer personal and/or corporate tax credits equal to a certain percentage of system purchase and installation costs. Property Tax Incentives – State property tax incentives can take many forms: o Exemptions of some or all of the value added to property by solar energy improvements o Special Assessments that value the system at less than its actual value for the purposes of calculating taxes o Abatements that reduce the amount of tax owed on appraised property by a certain percentage Sales Tax Incentives – States can provide additional incentives for the purchase of solar energy equipment by exempting these purchases from all or a portion of state sales taxes, providing tax credits for sales taxes paid, or by taxing this equipment at special rates. Page 3
- 4. The Solar Foundation 575 7th Street NW, Suite 400 Washington, DC 20004 (202) 469-3750 www.TheSolarFoundation.org State Financial Support Loans and Rebates – The majority of states offer financial support through state loan programs. Loan amounts, interest rates, and terms vary by state. In addition, utilities in 13 states offer their own loan programs.20 Fewer states offer rebates for solar PV and/or solar water heating systems. Such rebates are typically issued on the basis of “dollars per watt” or a certain percentage of installed costs, often within certain incentive limits. Utility Mandates and Incentives Renewable Portfolio Standards (RPS) with Solar Provisions – Renewable Portfolio Standards, a mandate from the state directing utilities to obtain a certain percentage of the electricity they sell from renewable sources by a target year, have been adopted in 29 states and the District of Columbia. Of these states, 16 (along with DC) have specific targets for solar.21 Despite assertions to the contrary, data from RPS states show no direct connection between these policies and electric rate increases.22 Key Resource: Designing the Right RPS: A Guide to Selecting Goals and Program Options for a Renewable Portfolio Standard Clean Energy States Alliance/ National Association of Regulatory Utility Commissioners www.cleanenergystates.org/assets/2012-Files/RPS/CESA-RPS-Goals-and-Program-Design-Report-March-2012.pdf Net Metering - Net metering allows utility customers to receive credit for unused electricity generated by their solar energy system. These credits are used to offset the utility-provided electricity customers consume when their solar energy systems are not producing their own electricity. Key Resource: Net Metering Model Rules Interstate Renewable Energy Council irecusa.org/wp-content/uploads/2010/08/IREC_NM_Model_October_2009-1-22.pdf Performance Based Incentives – Such incentives provide payments to system owners based on the solar installation’s energy output. A Feed-In Tariff is a specific type of performance based incentive under which energy suppliers purchase a set amount of renewable-generated electricity at fixed rates through long term contracts with terms of 5 to 20 years. Key Resource: A Policymaker’s Guide to Feed-In Tariff Policy Design National Renewable Energy Laboratory www.nrel.gov/docs/fy10osti/44849.pdf Page 4
- 5. The Solar Foundation 575 7th Street NW, Suite 400 Washington, DC 20004 (202) 469-3750 www.TheSolarFoundation.org State Economic Development Incentives Job Creation Incentives - States can promote the growth of manufacturing employment within their borders by offering a variety of job creation incentives. These incentives can be tax credits based on the number of employees hired or on company payrolls or can be grants to companies for each job created in the state. One example is Georgia’s Job Tax Credit (JTC), a state income tax credit of between $750 and $3,500 per job created. The amount for which an employer is eligible depends on both the level of economic development of the county in which the new jobs are located and the number of jobs created.23 Workforce Training Support - In order to further spur economic development, some states offer businesses support for developing a skilled and qualified workforce. Such support often takes the form of workforce training grants or reimbursements for certain percentages of training costs or wages paid for on-the-job training. The state of Arizona, for example, offers employers who create new jobs grants of up to 75% of the cost of training these new employees, or grants of up to 50% of eligible training costs for training incumbent employees.24 Manufacturing Tax Credits and Exemptions - Finally, state governments often incentivize economic growth by relieving qualifying businesses of some or all of their income, property, or sales tax burdens. For three years, up to the end of 2011, Michigan offered its Refundable Photovoltaic Manufacturing Tax Credit to businesses establishing PV manufacturing facilities in the state. This credit was equal to 25% of the capital costs associated with constructing such a facility, up to $15 million per credit.25 Local Policies Though federal and state policies provide strong support and incentives for solar energy, there are a number of key actions only local governments are able to take to promote and remove barriers to solar development, such as those listed below. In addition to adopting new (or modifying existing) policies that impact solar development, local governments are also uniquely poised to promote solar by other means. Counties and municipalities can lead by example by having solar energy systems installed on government buildings or land, demonstrating the long-term economic and environmental benefits of going solar. Furthermore, a growing number of local governments have sought to catalyze strong local solar markets through “solarize” programs, designed as concerted, limited-time programs that connect homeowners to solar installers.26 By negotiating group discounts, vetting and selecting contractors through a competitive process, and conducting outreach and education on the economic and environmental benefits of going solar, local governments can jump-start strong solar markets in their areas. Local Tax Policies Property Tax Incentives - While many states provide property tax incentives for solar energy systems, others leave the decision to do so up to local governments. In these cases, local officials can choose to provide exemptions, special assessments, or abatements that do not exist at the state level, opt-out of exemptions that do exist on the state level, or target sectors other than those covered by state incentives. Additionally, some jurisdictions offer homeowners tax credits to reduce tax liability for the buildings on which solar energy systems are installed. Sales Tax Incentives - Several states exempt purchases of solar energy equipment from state sales taxes. Only two states, Colorado and New York, take the extra step of allowing local governments to exempt such purchases from their portion of the sales tax as well. Page 5
- 6. The Solar Foundation 575 7th Street NW, Suite 400 Washington, DC 20004 (202) 469-3750 www.TheSolarFoundation.org Local Financial Support Loans and Rebates – Local loan and rebate programs may exist in addition to those offered at the state level, or in some cases where state incentives aren’t available. Examples of local financial policies that are especially innovative and those that cover very large populations are available online at www.dsireusa.org/solar. Property Assessed Clean Energy (PACE) - PACE programs allow homeowners to finance renewable energy or energy efficiency upgrades through special property tax assessments. Over half the states in the nation have passed legislation authorizing local governments to institute such programs. However, most of these programs remain in limbo while the Federal Housing Financing Agency promulgates rules governing the purchase of mortgages for properties with PACE liens. Key Resource: Property Assessed Clean Energy (PACE) Replication Guidance Package for Local Governments Energy Independence/ Energy Upgrade California www.drivecms.com/uploads/sonomacountyenergy.org/Municipal%20Resources/PACE%20Manual.pdf Local Government Ordinances Permitting - Streamlining the application process for solar building and/or electrical permits and establishing fair and consistent permitting fees can help reduce the time, money, and effort required to go solar. Key Resource: Sharing Success: Emerging Approaches to Efficient Rooftop Solar Permitting Interstate Renewable Energy Council www.irecusa.org/wp-content/uploads/FINAL-Sharing-Success-w-cover-revised-final052012.pdf Planning and Zoning - Local governments can remove barriers to solar development by updating planning and zoning ordinances related to solar. By protecting homeowners’ rights to install solar energy systems, ensuring their access to sunlight is not unreasonably restricted, and encouraging developers to build homes with solar in mind, cities and counties can promote local solar development. Local Economic Development Incentives Job Creation Incentives - Some local governments (typically large counties or municipalities) have been able to offer direct cash incentives for job creation, usually in the form of a fixed number of dollars provided for each job created. In late 2010, the City of Goodyear, Arizona offered the solar manufacturer Suntech job creation incentive payments of over $6,000 per job created.27 Page 6 Key Resource: Planning and Zoning for Solar Energy American Planning Association www.planning.org/pas/infopackets/open/pdf/30intro.pdf
- 7. The Solar Foundation 575 7th Street NW, Suite 400 Washington, DC 20004 (202) 469-3750 www.TheSolarFoundation.org Workforce Training Support - Cities and counties can provide additional incentives to solar firms seeking to relocate to these jurisdictions by offering payments or other incentives to help offset the costs of training new employees. Manufacturing Tax Credits and Exemptions - As with state governments, local governments can exclude certain purchases or manufacturing activities from some or all of the taxes under local control (i.e., sales and property taxes). The City of Austin, Texas provided such support to Heliovolt, a manufacturer of solar modules, offering the company grants equal to 60% of the property taxes associated with a new facility planned for the area.28 Loans and Grants - Finally, some local governments have been able to provide companies with low interest loans or grants to cover a portion of capital expenditures (such as equipment, buildings, infrastructure improvements, or materials) associated with establishing a local presence.29, 30 As part of a package to attract solar panel manufacturer Twin Creeks Technologies to its area, the City of Senatobia, Mississippi partnered with the state to provide $4 million in infrastructure upgrades to the site of the proposed facility.31 Future Growth The long-term outlook for solar is quite positive. Analysts predict further dramatic decreases in the price of solar within a decade. For large-scale solar farms, unsubsidized electricity prices are expected to drop from $0.11 - $0.18/kWh to $0.09 - $0.15/kWh by 2014, falling to $0.04 - $0.07/kWh by 2020. Rooftop solar is expected to experience similar cost declines, making it competitive without subsidies in areas with high electricity rates and an above average solar resource.32 Despite such positive long-term projections, the current strength of solar markets still relies strongly on public support. Achieving these cost reductions, along with a four-fold increase in solar installations by 2016,33 requires a sustained policy commitment at all levels to developing our cleanest and most abundant energy resource. This issue brief is supported by the following team of organizations: ICLEI-USA; International City/County Management Association (ICMA); Solar Electric Power Association (SEPA); Interstate Renewable Energy Council, Inc. (IREC); North Carolina Solar Center (NCSC); Meister Consultants Group, Inc. (MCG); The Solar Foundation (TSF); American Planning Association (APA); and National Association of Regional Councils (NARC). This material is based upon work supported by the U.S. Department of Energy under Award Number DE-EE0003525. This issue brief was prepared as an account of work sponsored by an agency of the United States Government. Neither the United States Government nor any agency thereof, nor any of their employees, makes any warranty, express or implied, or assumes any legal liability or responsibility for the accuracy, completeness, or usefulness of any information, apparatus, product, or process disclosed, or represents that its use would not infringe on privately owned rights. Reference herein to any specific commercial product, process, or service by trade name, trademark, manufacturer, or otherwise does not necessarily constitute or imply its endorsement, recommendation, or favoring by the United States Government or any agency thereof. The views and opinions of authors expressed herein do not necessarily state or reflect those of the United States Government or any agency thereof. Page 7
- 8. The Solar Foundation 575 7th Street NW, Suite 400 Washington, DC 20004 (202) 469-3750 www.TheSolarFoundation.org 1 Rotman, D. March/April 2011. Praying for an Energy Miracle. Technology Review. Available at www.technologyreview.com/energy/32383/ 2 Solar Electric Power Association. April 2012. 2011 SEPA Top 10 Utility Solar Rankings. Available at www.solarelectricpower.org/media/252486/2011-sepa-utility-solar- rankings-top-10-executive-summary.pdf 3 Solar Energy Industries Association/ GTM Research. 2011. U.S. Solar Market Insight: 2010 Year-In-Review. www.seia.org/galleries/pdf/SMI-YIR-2010-ES.pdf 4 Solar Energy Industries Association/ GTM Research. 2012. U.S. Solar Market Insight: 2011 Year-in-Review. www.slideshare.net/SEIA/us-solar-market-insight-report 5 The Solar Foundation. October 2011. National Solar Jobs Census 2011. Available at www.thesolarfoundation.org/sites/thesolarfoundation.org/files/TSF_JobsCensus2011_Final_Compressed.pdf 6 National Renewable Energy Laboratory. April 2012. Preliminary Analysis of the Jobs and Economic Impacts of Renewable Energy Projects Supported by the §1603 Treasury Grant Program. Available at www.nrel.gov/docs/fy12osti/52739.pdf 7 EuPD Research. October 2011. Economic Impact of Extending the Section 1603 Treasury Program. Available at hwww.seia.org/galleries/pdf/EuPD_Full_Report_- _Economic_Impact_of_Extending_Section_1603_Treasury_Program_10.12.11.pdf 8 Solar Energy Industries Association/ GTM Research. 2012. U.S. Solar Market Insight: Q1 2012. www.seia.org/research-resources/solar-market-insight-report-2012-q1 9 Bloomberg New Energy Finance. May 2012. Reconsidering the Economics of Photovoltaic Power. New York: Bazilian, M., et al. www.bnef.com/WhitePapers/download/82 10 Farrell, J. March 21, 2012. Rooftop Revolution: Changing Everything with Cost-Effective Local Solar. Available at www.ilsr.org/rooftop-revolution-changing-everything- with-cost-effective-local-solar/ 11 Energy Information Administration. July 2011. Direct Federal Financial Interventions and Subsidies in Energy in Fiscal Year 2010. Available at www.eia.gov/analysis/requests/subsidy/pdf/subsidy.pdf 12 Howard H. Baker Jr Center for Public Policy, University of Tennessee at Knoxville. May 2012. Assessment of Incentives and Employment Impacts of Solar Industry Development. Available at http://bakercenter.utk.edu/wp-content/uploads/2012/04/Solar-incentives-and-benefits-_complete-report_May-1-2012-21.pdf 13 Congressional Budget Office. March 2012. Federal Financial Support for the Development and Production of Fuels and Energy Technologies. Available at www.cbo.gov/sites/default/files/cbofiles/attachments/03-06-FuelsandEnergy_Brief.pdf 14 Database of State Incentives for Renewables & Efficiency. 2011. Business Energy Investment Tax Credit. Available at www.dsireusa.org/incentives/incentive.cfm?Incentive_Code=US02F&re=1&ee=1 15 U.S. Partnership for Renewable Energy Finance. July 2012. Paid in Full: An Analysis of the Return to the Federal Taxpayer for Internal Revenue Code Section 48 Solar Energy Investment Tax Credit (ITC). Available at www.uspref.org/index.php/white-papers 16 Database of State Incentives for Renewables & Efficiency. 2011. Modified Accelerated Cost-Recovery System (MACRS) + Bonus Depreciation (2008-2012). Available at http://dsireusa.org/incentives/incentive.cfm?Incentive_Code=US06F&re=1&ee=1 17 Database of State Incentives for Renewables & Efficiency. 2011. U.S. Department of the Treasury – Renewable Energy Grants. Available at www.dsireusa.org/library/includes/incentive2.cfm?Incentive_Code=US53F&State=federal%C2%A4tpageid=1&ee=1&re=1 18 The White House. January 8, 2010. Fact Sheet: $2.3 Billion in New Clean Energy Manufacturing Tax Credits. Available at www.whitehouse.gov/the-press-office/fact- sheet-23-billion-new-clean-energy-manufacturing-tax-credits 19 U.S. Department of Energy, Loan Programs Office. n.d. Programs. Available at https://lpo.energy.gov/?page_id=37 20 Database of State Incentives for Renewables & Efficiency. May 2012. State Loan Programs for Solar Projects. Available at http://dsireusa.org/documents/summarymaps/Solar_Loan_Map.pdf 21 Database of State Incentives for Renewables & Efficiency. May 2012. RPS Policies with Solar/DG Provisions. Available at www.dsireusa.org/documents/summarymaps/Solar_DG_RPS_map.pdf 22 Center for American Progress. April 2012. Renewable Energy Standards Deliver Affordable, Clean Power. Washington, DC: Caperton, R.W. Available at www.americanprogress.org/issues/2012/04/pdf/res_rates.pdf 23 Georgia Department of Community Affairs. 2012. Georgia Job Tax Credit Program. Available at www.dca.state.ga.us/economic/taxcredits/programs/taxcredit.asp 24 Arizona Commerce Authority. 2012. Job Training. Available at www.azcommerce.com/job-training/ 25 Database of State Incentives for Renewables and Efficiency. November, 2011. Refundable Photovoltaic Manufacturing Tax Credit. Available at www.dsireusa.org/incentives/incentive.cfm?Incentive_Code=MI31F 26 Northwest Sustainable Energy for Economic Development. May 2012. The Solarize Guidebook: A Community Guide to Collective Purchasing of Residential PV Systems. www4.eere.energy.gov/solar/sunshot/resource_center/resources/solarize_guidebook_community_guide_collective_purchasing_residential_pv_systems 27 City of Goodyear, Arizona. 2010. Job Creation and Training Agreement for Suntech Arizona, Inc. Available at http://goodyear.granicus.com/MetaViewer.php?meta_id=127422&view=&showpdf=1 28 Austin City Council. 2007. Regular Meeting Minutes: October 18, 2007.Available at www.austintexas.gov/edims/document.cfm?id=109938 29 Stion. March 11, 2008. Solar Company Stion to Relocate to South San Jose’s Industrial Park. Press Release available at www.stion.com/press- releases/080311_Solar_Company_Stion_to_Relocate_to_San_Jose.pdf 30 City of Surprise, Arizona. n.d. Rioglass Solar selects Surprise as location for U.S. Headquarters! Available at www.surpriseaz.gov/files/ed/rioglasssolar.html 31 Renewable Energy World. April 6, 2010. Twin Creeks to Build PV Manufacturing Plant in Mississippi. Available at www.renewableenergyworld.com/rea/news/article/2010/04/twin-creeks-to-build-pv-manufacturing-plant-in-mississippi 32 Jenkins, J., Muro, M., Nordhaus, T., Shellenberger, M., Tawney, L., & Trembath, A. April 2012. Beyond Boom & Bust: Putting Clean Tech on a Path to Subsidy Independence. Washington, DC. Available at www.brookings.edu/research/papers/2012/04/~/media/Research/Files/Papers/2012/4/18%20clean%20investments%20muro/0418_clean_investments_final%20paper_P DF.PDF 33 Solar Energy Industries Association/ GTM Research. 2012. U.S. Solar Market Insight: 2011 Year-in-Review. www.slideshare.net/SEIA/us-solar-market-insight-report Page 8