13. Definition
“The difference is the objective.
Infographics are used to tell a story or answer a question.
Data visualizations let user find their own story or answer.”
Benjamin Wiederkehr, of datavisualization.ch
36. Visualizing Data, by Ben Fry (O'Reilly, 2008)
Books
The Information Design Handbook, by Jenn + Ken Visocky
O'Grady (HOW Books, 2008)
Data Flow, by Robert Klanten, Nicolas Bourquin, Thibaud Tissot,
Sven Ehmann (Gestalten, Berlin 2008)
The Visual Display of Quantitative Information, by Edward
R. Tufte (Graphics Pr, 2001)
Visual Explanations, by Edward R. Tufte (Graphics Pr, 1997)
Envisioning Information, by Edward R. Tufte (Graphics Pr, 1990)
Beautiful Evidence, by Edward R. Tufte (Graphics Pr, 2006)
Information is Beautiful, by David McCandless (Collins)
37. People
Edward Tufte Ben Fry
www.edwardtufte.com www.benfry.com
Nicholas Felton David McCandless
www.feltron.com www.informationisbeautiful.net
Sébastien Pierre Stephen Few
www.ffctn.com www.perceptualedge.com/
38. Exercise
1. Brainstorm some data sources from your normal daily activities (time
spent on different activities like travel, or communication methods,
nutrition details, geo-spacial data, water usage, etc).
2. Choose the best method of displaying your data (pie chart, bar chart,
venn diagram, line graph, equation editor, word cloud).
3. Pick a tool for your visualization (GraphJam, ManyEyes, Wordle, or
Tagxedo, or drawing it on paper).
PROCESS: RULES:
1. Acquire 1. Show, don’t tell
2. Parse 2. Use common icons
3. Filter 3. Check your scale
4. Represent 4. Apply colors wisely
5. Refine 5. Reduce the clutter
6. Find the simplexity
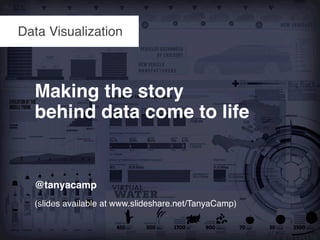
my background is in fine arts, in painting, but I like using a variety of different mediums to convey information and tell a story, in both painting and digital design. \nData vis is a way to make the story behind data come to life. \n
What is data visualization?\n Data vis is graphical representation of quantitative info, using of a coordination system, points, lines, shapes, numbers, words, shading, and/or color. \n turns data into info that people can easily and quickly understand\n It generally doesn't need context, as the data can represent itself. \n \n
why data vis\n we understand and process visual information quickly, much more quickly than the written word \n it can reveal hidden patterns and trends, or insights and correlations within the data, things that you might not see if you were looking at a table of numbers\n can tell a story in a concise way\n\n
\n data vis draws on the world of print journalism, statistical analysis, and graphic arts\n really all starts with Journalism -- need to find the data and analyze it\n design ties it all together, makes it appealing and interesting, balancing the simple and the complex\n source: Sébastien Pierre is the founder of FFunction, a Montréal-based data visualization company.http://www.readwriteweb.com/cloud/2010/11/what-is-data-visualization-inf.php)\n\n
how\n Data vis can be generated dynamically (from a database or other dynamic source) using ready-made or custom built tools, or can be hand-generated. \n It can also be animated, to show how data changes over time\n many types: graphs, tables, diagrams, geographical maps, heat-maps, mind-maps, word/tag clouds, sparklines, treemaps, scatterplot, matrix chart, bubble charts, stack graphs, pie charts, line graphs\n
William Playfair (1759-1823):\n Data vis goes back as far as the late 1700s\n in 1786, William Playfair (a Scottish engineer and political economist) published his trade-balance time-series chart, one of the first of it’s kind\n he’s credited as the founder of graphical methods of statistics\n he believed that visualizations of stats were easier to understand than the written word. \n instead of using tables of data, he created line graphs, bar graphs, and pie charts (that he colored by hand). \n enabled the reader to gain an improved understanding of quantities relative to one another and see economic patterns over time\n bridged significant knowledge gaps; specialized skills weren't needed to interpret complex numerical or statistical info, making it more widely accessible\n (pg 33, The Information Design Handbook, Jenn + Ken Viscocky O'Grady)\n (slide: Playfair's trade-balance time-series chart, published in his Commercial and Political Atlas, 1786. source: Wikipedia)\n\n
Charles Joseph Minard (1781-1870)\n almost a hundred years later, Charles Joseph Minard (French civil engineer) published this data visualization in 1869\n noted for inventions in field of information graphics\n most famous for this flow map depicting data from Napoleon’s disastrous Russian campaign of 1812\n shows several variables in a 2D image:\n size of army, showing decreasing numbers\n\n
geographical coordinates (lat and long) of army as it moved\n direction they were traveling, both in advance and retreat, and where units split off and rejoined\n location of army on certain dates\n weather temperature along path of retreat\n a lot of information can be packed into a data vis -- imagine how many pages of words it would take to convey this same information\n
Nicholas Felton\n contemporary designer Nicholas Felton also telling interesting stories with Data Vis.\n creates personal annual reports about his life. \n he tells his story, using the quantifiable information from his daily existence.\n \n
it would be interesting to see this kind of data vis about yourself, although there may be some things you'd rather not see quantified! \n Facebook's new timeline feature presents this type of information, summarizing your behaviour and events (and they actually hired Felton to help consult on this feature) \n http://gigaom.com/2011/09/22/nicholas-felton-facebook-timeline/\n\n
in 2011, Fast Company named him one of the 50 most influential designers in America\n http://feltron.tumblr.com/\n
Data vis vs. infographics\ndata vis and info g are very similar, and some people use the terms interchangeably, but there is a difference.\n info g are editorial representations of info, data, or knowledge\n often used to support information, strengthen it, and present it within a sensitive context\n often hand crafted (Benjamin Wiederkehr, of datavisualization.ch)\n they tell a story, and have a beginning, middle, and end, as well as a hook or focal point\n data vis is a graphical rep of quantifiable data, and allows the data to represent itself\n\n
Difference is about the objective\n info g used to tell a story or answer a question. \n data vis is used to let user find their own story or answer. (Benjamin Wiederkehr, of datavisualization.ch)\n\n
Process:\nAcquire (obtain data)\nParse (provide some structure for data's meaning, order it into categories)\nFilter (remove all but the data of interest)\nRepresent (choose most effective visual model, such as a bar graph, list, or tree)\nRefine (improve the basic graphic to make it clearer or more visually engaging)\n(from Visualizing Data, Ben Fry)\n
Rules:\nshow, don’t tell -- let the visual do the explaining, make sure it’s able to stand alone, without context\nuse common icons and symbols to ensure comprehension; common visual language is crucial\nIf you’re using a numeric scale, make sure it’s appropriate -- a poorly conceived viz might show nothing of consequence, or exaggerate the significance of certain trends\nchoose your colors wisely, colors matter\n make colors informative\n don’t attack the senses\n stick to the rule of three\none should be the background color (usually the lightest), and the other two should identify sections or elements\n background often colored on data vis or infographics, because shared online, and websites usually have white backgrounds, so a slightly colored background will make them stick out and defines where it begins and ends\nif you add other colors, use shades of the three main colors; will keep palette cohesive and calming\n color shouldn't be used haphazardly\nour brains try to assign meaning to color or contrast, so when colors in two different sections are the same, we try to relate them to one another, because we're pattern seekers\ntest it in greyscale (to make sure there is enough contrast)\nbeware green and red color blindness\nreduce the clutter -- less is more, and don’t decorate, design\nfind the simplexity (from Data Flow, by Gestalten)\n the balance between simplicity and complexity \n get rid of “chartjunk” (Edward Tufte)\n
Critique\nlocal examples from City of Edmonton "The Way we Finance”\n
pie charts don’t display quantitative data very effectively\n can’t compare 20 areas in a pie graph, a bar graph would be more effective\n it’s easier for us to perceive the relative sizes of squares than circles (or parts of)\n use colors effectively and consistently\n if you’re using a large palette of colors, make sure they mean the same thing when they’re used on the same page\n\n
\n consider using monotone so that you’re not inadvertently drawing connections\n\n\n
\n using 3D or shapes with non-flat edges makes it difficult to compare\n keep in mind the data/ink ratio: if it adds ink but not data, it’s not valuable\n\n\n\n
\n\n quantitative data can’t be effectively conveyed in 3D, hides some form of the measurement\n\n\n\n
\n make sure your scale is right, so that you don’t skew results\n\n\n
\n
\n
Tools:\nhttp://cheezburger.com/FlashBuilder/GraphJam\n build a custom visualization quickly with this online tool\n choose from pie chart, bar chart, venn diagram, line graph, equation editor\n quick and dirty\n
Google Fusion Tables\n http://www.google.com/fusiontables/public/tour/index.html\n use data tables to publish data as maps, timelines, or charts, and embed the visualization on a web page or share via email. \n\n
Google Chart API\n http://code.google.com/apis/chart/image/docs/making_charts.html\n can make charts, maps, QR codes, venn diagrams\n attributes passed through a URL string\n can be embedded in a web page as an image file\n
Google Visualization API\n http://code.google.com/apis/chart/index.html\n web-based interactive charts, graphs connected to online datasets (like google docs)\n use for reports or dashboards, can customize with Javascript and HMTL\n\n
Google Public Data Explorer\n http://www.google.com/publicdata/directory\n makes large data sets easy to explore, visualize and communicate through bubble-charts, maps, bar graphs, or line charts\n sources like World Bank, EuroStat, U.S. Bureau of Labor Statistics and U.S. Census Bureau\n
Google Insights for Search\n http://www.google.com/insights/search/#\n get analytical insight from google’s vast memory of searching activity, identifying and comparing patterns of search, evolution of trends, and even geographical origin \n compare search volume patterns across regions, categories, time frames, and properties\n
Google Ngram Viewer\n http://books.google.com/ngrams/\n see usage of a word or phrase in books over the last 500 years, and see the ebb and flow of word utilization\n
Many Eyes\n http://www-958.ibm.com/software/data/cognos/manyeyes/\n upload data and produce vis in a variety of templates and types.\n\n
Wordle\nhttp://www.wordle.net/\ngenerate word clouds\n the size of the word indicates frequency\n
Tagxedo\n http://www.tagxedo.com/\n http://blog.tagxedo.com/\n turns a dataset into visual word clouds within a user-defined shape or image\n
Adobe Illustrator\n customized and handcrafted designs\nInkscape\n http://inkscape.org/index.php?lang=en\n alternative to Illustrator, open source vector graphics editor\n\n
Resources\nWhere to find info and inspiration:\n http://www.informationisbeautiful.net/\n http://visual.ly/\n http://jess3.com/\n http://flowingdata.com\n http://feltron.com/\n http://www.edwardtufte.com/tufte/\n http://infosthetics.com/\n http://www.infographicsshowcase.com/\n http://www.visualizing.org/\n http://ffctn.com/\n http://www.gapminder.org/\n
books:\nVisualizing Data, by Ben Fry (O'Reilly, 2008)\nThe Information Design Handbook, by Jenn + Ken Visocky O'Grady (HOW Books, 2008)\nData Flow, by Robert Klanten, Nicolas Bourquin, Thibaud Tissot, Sven Ehmann (Gestalten, Berlin 2008)\nThe Visual Display of Quantitative Information, by Edward Tufte\nVisual Explanations, by Edward Tufte\nEnvisioning Information, by Edward Tufte\nBeautiful Evidence, by Edward Tufte\nInformation is Beautiful, by David McCandless\nBeautiful Visualization: Looking at Data through the Eyes of Experts, by Julie Steele and Noah Iliinsky\n
people:\n Edward Tufte, pioneer in field of data visualization: http://www.edwardtufte.com/\n Nicholas Felton, designer: http://feltron.com/\n Sébastien Pierre, founder of FFunction, a Montréal-based data visualization company: http://ffctn.com/\n Ben Fry, principal of Fathom, a design and software consultancy located in Boston: http://benfry.com/\n David McCandless, designer, writer and author based in London: http://www.informationisbeautiful.net/\n Stephen Few, business intelligence and information design http://www.informationisbeautiful.net/\n