Contenu connexe
Tendances
6,7, 78704, travis heights, bouldin creek, barton hills6,7, 78704, travis heights, bouldin creek, barton hillsTaylor Real Estate
Similaire à 10 n, 10s, south austin metrics
Similaire à 10 n, 10s, south austin metrics (12)
10 n, 10s, south austin metrics
- 1. Blake Taylor Taylor Real Estate
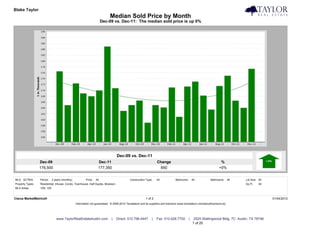
Median Sold Price by Month
Dec-09 vs. Dec-11: The median sold price is up 0%
Dec-09 vs. Dec-11
Dec-09 Dec-11 Change %
176,500 177,350 850 +0%
MLS: ACTRIS Period: 2 years (monthly) Price: All Construction Type: All Bedrooms: All Bathrooms: All Lot Size: All
Property Types: Residential: (House, Condo, Townhouse, Half Duplex, Modular) Sq Ft: All
MLS Areas: 10N, 10S
Clarus MarketMetrics® 1 of 2 01/04/2012
Information not guaranteed. © 2009-2010 Terradatum and its suppliers and licensors (www.terradatum.com/about/licensors.td).
www.TaylorRealEstateAustin.com | Direct: 512.796.4447 | Fax: 512.628.7720 | 2525 Wallingwood Bldg. 7C Austin, TX 78746
1 of 20
- 2. Blake Taylor Taylor Real Estate
Median Sold Price by Month
Dec-09 vs. Dec-11: The median sold price is up 0%
Time Period Median Price # Units Average DOM
Dec-11 177,350 66 80
Nov-11 164,075 74 61
Oct-11 166,500 72 62
Sep-11 175,000 77 51
Aug-11 171,500 92 63
Jul-11 163,500 93 55
Jun-11 168,250 94 50
May-11 173,000 81 55
Apr-11 171,325 84 73
Mar-11 161,000 72 69
Feb-11 171,000 41 98
Jan-11 164,200 42 96
Dec-10 165,000 69 90
Nov-10 159,000 61 66
Oct-10 166,548 44 69
Sep-10 165,000 57 57
Aug-10 163,000 60 59
Jul-10 170,750 60 44
Jun-10 184,968 93 36
May-10 170,000 106 38
Apr-10 168,000 115 45
Mar-10 169,000 91 40
Feb-10 172,380 54 39
Jan-10 164,975 42 49
Dec-09 176,500 56 34
Clarus MarketMetrics® 2 of 2 01/04/2012
Information not guaranteed. © 2009-2010 Terradatum and its suppliers and licensors (www.terradatum.com/about/licensors.td).
www.TaylorRealEstateAustin.com | Direct: 512.796.4447 | Fax: 512.628.7720 | 2525 Wallingwood Bldg. 7C Austin, TX 78746
2 of 20
- 3. Blake Taylor Taylor Real Estate
Median For Sale vs. Median Sold
Dec-09 vs. Dec-11: The median price of for sale properties is down 7% and the median price of sold properties is up 0%
Dec-09 vs. Dec-11 Dec-09 vs. Dec-11
Dec-09 Dec-11 Change % Dec-09 Dec-11 Change %
183,500 170,000 -13,500 -7% 176,500 177,350 850 +0%
MLS: ACTRIS Period: 2 years (monthly) Price: All Construction Type: All Bedrooms: All Bathrooms: All Lot Size: All
Property Types: Residential: (House, Condo, Townhouse, Half Duplex, Modular) Sq Ft: All
MLS Areas: 10N, 10S
Clarus MarketMetrics® 1 of 2 01/04/2012
Information not guaranteed. © 2009-2010 Terradatum and its suppliers and licensors (www.terradatum.com/about/licensors.td).
www.TaylorRealEstateAustin.com | Direct: 512.796.4447 | Fax: 512.628.7720 | 2525 Wallingwood Bldg. 7C Austin, TX 78746
3 of 20
- 4. Blake Taylor Taylor Real Estate
Median For Sale vs. Median Sold
Dec-09 vs. Dec-11: The median price of for sale properties is down 7% and the median price of sold properties is up 0%
For Sale # Properties Sold # Properties Price
Time Period Median For Sale Median Sold Difference
Dec-11 170,000 255 177,350 66 7,350
Nov-11 174,994 282 164,075 74 -10,919
Oct-11 174,900 332 166,500 72 -8,400
Sep-11 172,500 347 175,000 77 2,500
Aug-11 172,700 388 171,500 92 -1,200
Jul-11 174,900 441 163,500 93 -11,400
Jun-11 172,700 464 168,250 94 -4,450
May-11 170,000 446 173,000 81 3,000
Apr-11 174,500 460 171,325 84 -3,175
Mar-11 172,000 451 161,000 72 -11,000
Feb-11 169,900 391 171,000 41 1,100
Jan-11 169,900 392 164,200 42 -5,700
Dec-10 169,895 393 165,000 69 -4,895
Nov-10 169,900 436 159,000 61 -10,900
Oct-10 170,000 507 166,548 44 -3,453
Sep-10 172,000 525 165,000 57 -7,000
Aug-10 170,000 556 163,000 60 -7,000
Jul-10 172,950 554 170,750 60 -2,200
Jun-10 170,000 534 184,968 93 14,968
May-10 175,000 488 170,000 106 -5,000
Apr-10 179,800 560 168,000 115 -11,800
Mar-10 179,900 471 169,000 91 -10,900
Feb-10 180,000 375 172,380 54 -7,620
Jan-10 179,900 318 164,975 42 -14,925
Dec-09 183,500 301 176,500 56 -7,000
Clarus MarketMetrics® 2 of 2 01/04/2012
Information not guaranteed. © 2009-2010 Terradatum and its suppliers and licensors (www.terradatum.com/about/licensors.td).
www.TaylorRealEstateAustin.com | Direct: 512.796.4447 | Fax: 512.628.7720 | 2525 Wallingwood Bldg. 7C Austin, TX 78746
4 of 20
- 5. Blake Taylor Taylor Real Estate
Sold Properties by Month
Dec-09 vs. Dec-11: The number of Sold properties is up 18%
Dec-09 vs. Dec-11
Dec-09 Dec-11 Change %
56 66 10 +18%
MLS: ACTRIS Period: 2 years (monthly) Price: All Construction Type: All Bedrooms: All Bathrooms: All Lot Size: All
Property Types: Residential: (House, Condo, Townhouse, Half Duplex, Modular) Sq Ft: All
MLS Areas: 10N, 10S
Clarus MarketMetrics® 1 of 2 01/04/2012
Information not guaranteed. © 2009-2010 Terradatum and its suppliers and licensors (www.terradatum.com/about/licensors.td).
www.TaylorRealEstateAustin.com | Direct: 512.796.4447 | Fax: 512.628.7720 | 2525 Wallingwood Bldg. 7C Austin, TX 78746
5 of 20
- 6. Blake Taylor Taylor Real Estate
Sold Properties by Month
Dec-09 vs. Dec-11: The number of Sold properties is up 18%
Full Market Bank Properties Non-Bank Properties
Time Period # Properties Median Price Average DOM # Properties % Bank Median Price # Properties % Non-Bank Median Price
Dec-11 66 177,350 80 10 15.2 138,750 56 84.8 186,222
Nov-11 74 164,075 61 2 2.7 124,500 72 97.3 164,325
Oct-11 72 166,500 62 6 8.3 129,700 66 91.7 176,901
Sep-11 77 175,000 51 3 3.9 137,001 74 96.1 175,000
Aug-11 92 171,500 63 3 3.3 138,000 89 96.7 172,000
Jul-11 93 163,500 55 2 2.1 119,950 91 97.8 164,000
Jun-11 94 168,250 50 7 7.5 128,000 87 92.5 169,000
May-11 81 173,000 55 7 8.6 118,000 74 91.4 174,433
Apr-11 84 171,325 73 4 4.8 127,500 80 95.2 172,325
Mar-11 72 161,000 69 5 6.9 130,000 67 93.1 165,000
Feb-11 41 171,000 98 4 9.8 156,500 37 90.2 174,315
Jan-11 42 164,200 96 6 14.3 110,300 36 85.7 170,000
Dec-10 69 165,000 90 6 8.7 132,450 63 91.3 176,500
Nov-10 61 159,000 66 7 11.5 130,000 54 88.5 159,500
Oct-10 44 166,548 69 3 6.8 123,000 41 93.2 168,000
Sep-10 57 165,000 57 2 3.5 101,250 55 96.5 165,000
Aug-10 60 163,000 59 3 5.0 139,500 57 95.0 165,000
Jul-10 60 170,750 44 2 3.3 131,188 58 96.7 173,950
Jun-10 93 184,968 36 2 2.1 157,000 91 97.8 184,968
May-10 106 170,000 38 3 2.8 131,730 103 97.2 172,000
Apr-10 115 168,000 45 0 115 100.0 168,000
Mar-10 91 169,000 40 2 2.2 160,525 89 97.8 169,000
Feb-10 54 172,380 39 4 7.4 154,750 50 92.6 174,380
Jan-10 42 164,975 49 2 4.8 103,750 40 95.2 165,750
Dec-09 56 176,500 34 2 3.6 159,800 54 96.4 176,500
Clarus MarketMetrics® 2 of 2 01/04/2012
Information not guaranteed. © 2009-2010 Terradatum and its suppliers and licensors (www.terradatum.com/about/licensors.td).
www.TaylorRealEstateAustin.com | Direct: 512.796.4447 | Fax: 512.628.7720 | 2525 Wallingwood Bldg. 7C Austin, TX 78746
6 of 20
- 7. Blake Taylor Taylor Real Estate
Under Contract Properties by Month
Dec-09 vs. Dec-11: The number of Under Contract properties is down 2%
Dec-09 vs. Dec-11
Dec-09 Dec-11 Change %
52 51 -1 -2%
MLS: ACTRIS Period: 2 years (monthly) Price: All Construction Type: All Bedrooms: All Bathrooms: All Lot Size: All
Property Types: Residential: (House, Condo, Townhouse, Half Duplex, Modular) Sq Ft: All
MLS Areas: 10N, 10S
Clarus MarketMetrics® 1 of 2 01/04/2012
Information not guaranteed. © 2009-2010 Terradatum and its suppliers and licensors (www.terradatum.com/about/licensors.td).
www.TaylorRealEstateAustin.com | Direct: 512.796.4447 | Fax: 512.628.7720 | 2525 Wallingwood Bldg. 7C Austin, TX 78746
7 of 20
- 8. Blake Taylor Taylor Real Estate
Under Contract Properties by Month
Dec-09 vs. Dec-11: The number of Under Contract properties is down 2%
Full Market Bank Properties Non-Bank Properties
Time Period # Properties Median Price Average DOM # Properties % Bank Median Price # Properties % Non-Bank Median Price
Dec-11 51 164,800 59 7 13.7 120,000 44 86.3 164,950
Nov-11 61 186,500 75 7 11.5 150,000 54 88.5 188,222
Oct-11 81 175,000 68 5 6.2 149,500 76 93.8 179,672
Sep-11 77 175,000 60 7 9.1 107,900 70 90.9 177,000
Aug-11 79 177,500 62 1 1.3 129,000 78 98.7 180,972
Jul-11 96 169,900 52 6 6.2 114,950 90 93.8 174,925
Jun-11 88 169,900 62 2 2.3 128,450 86 97.7 171,400
May-11 95 169,750 50 4 4.2 122,500 91 95.8 174,700
Apr-11 81 175,000 58 6 7.4 127,400 75 92.6 175,000
Mar-11 94 169,900 68 7 7.5 113,950 87 92.5 170,000
Feb-11 56 166,500 60 3 5.4 144,900 53 94.6 169,900
Jan-11 51 174,000 118 4 7.8 144,900 47 92.2 175,000
Dec-10 53 163,000 84 9 17.0 145,000 44 83.0 167,750
Nov-10 47 170,000 87 6 12.8 114,900 41 87.2 185,000
Oct-10 63 169,900 71 3 4.8 139,900 60 95.2 169,950
Sep-10 47 168,000 75 2 4.3 115,950 45 95.7 168,618
Aug-10 57 164,900 47 5 8.8 140,000 52 91.2 164,995
Jul-10 62 180,352 62 3 4.8 139,500 59 95.2 182,000
Jun-10 61 170,000 47 3 4.9 139,500 58 95.1 179,000
May-10 51 191,673 41 2 3.9 222,400 49 96.1 191,673
Apr-10 146 177,700 38 2 1.4 169,950 144 98.6 177,700
Mar-10 111 169,900 35 1 0.9 117,500 110 99.1 169,925
Feb-10 84 171,500 50 1 1.2 174,900 83 98.8 169,999
Jan-10 65 169,900 38 3 4.6 149,000 62 95.4 169,945
Dec-09 52 177,400 54 4 7.7 154,950 48 92.3 177,925
Clarus MarketMetrics® 2 of 2 01/04/2012
Information not guaranteed. © 2009-2010 Terradatum and its suppliers and licensors (www.terradatum.com/about/licensors.td).
www.TaylorRealEstateAustin.com | Direct: 512.796.4447 | Fax: 512.628.7720 | 2525 Wallingwood Bldg. 7C Austin, TX 78746
8 of 20
- 9. Blake Taylor Taylor Real Estate
New Properties by Month
Dec-09 vs. Dec-11: The number of New properties is up 11%
Dec-09 vs. Dec-11
Dec-09 Dec-11 Change %
56 62 6 +11%
MLS: ACTRIS Period: 2 years (monthly) Price: All Construction Type: All Bedrooms: All Bathrooms: All Lot Size: All
Property Types: Residential: (House, Condo, Townhouse, Half Duplex, Modular) Sq Ft: All
MLS Areas: 10N, 10S
Clarus MarketMetrics® 1 of 2 01/04/2012
Information not guaranteed. © 2009-2010 Terradatum and its suppliers and licensors (www.terradatum.com/about/licensors.td).
www.TaylorRealEstateAustin.com | Direct: 512.796.4447 | Fax: 512.628.7720 | 2525 Wallingwood Bldg. 7C Austin, TX 78746
9 of 20
- 10. Blake Taylor Taylor Real Estate
New Properties by Month
Dec-09 vs. Dec-11: The number of New properties is up 11%
Full Market Bank Properties Non-Bank Properties
Time Period # Properties Median Price # Properties % Bank Median Price # Properties % Non-Bank Median Price
Dec-11 62 169,950 12 19.4 154,900 50 80.7 173,000
Nov-11 65 175,000 5 7.7 125,000 60 92.3 176,500
Oct-11 97 174,800 11 11.3 130,000 86 88.7 174,994
Sep-11 81 169,900 10 12.3 147,250 71 87.7 179,000
Aug-11 96 169,700 3 3.1 220,000 93 96.9 169,500
Jul-11 100 180,950 2 2.0 128,450 98 98.0 183,462
Jun-11 142 171,450 11 7.8 124,900 131 92.2 175,000
May-11 119 175,000 2 1.7 116,950 117 98.3 179,000
Apr-11 134 174,950 6 4.5 138,900 128 95.5 177,450
Mar-11 148 179,000 7 4.7 144,950 141 95.3 179,900
Feb-11 91 179,900 5 5.5 135,900 86 94.5 181,375
Jan-11 106 165,000 7 6.6 123,000 99 93.4 169,900
Dec-10 52 163,950 5 9.6 129,000 47 90.4 175,000
Nov-10 62 157,950 10 16.1 116,950 52 83.9 166,500
Oct-10 101 174,900 4 4.0 152,400 97 96.0 179,999
Sep-10 121 174,990 6 5.0 130,200 115 95.0 180,000
Aug-10 122 169,898 5 4.1 134,900 117 95.9 169,900
Jul-10 138 182,852 6 4.3 137,450 132 95.7 185,000
Jun-10 133 169,000 7 5.3 144,900 126 94.7 169,250
May-10 106 165,000 6 5.7 142,250 100 94.3 166,700
Apr-10 232 174,950 3 1.3 169,500 229 98.7 175,000
Mar-10 201 179,000 5 2.5 117,500 196 97.5 179,450
Feb-10 146 179,850 3 2.0 147,900 143 98.0 179,900
Jan-10 112 179,850 2 1.8 165,950 110 98.2 179,850
Dec-09 56 164,975 3 5.4 134,900 53 94.6 165,000
Clarus MarketMetrics® 2 of 2 01/04/2012
Information not guaranteed. © 2009-2010 Terradatum and its suppliers and licensors (www.terradatum.com/about/licensors.td).
www.TaylorRealEstateAustin.com | Direct: 512.796.4447 | Fax: 512.628.7720 | 2525 Wallingwood Bldg. 7C Austin, TX 78746
10 of 20
- 11. Blake Taylor Taylor Real Estate
For Sale Properties by Month
Dec-09 vs. Dec-11: The number of For Sale properties is down 15%
Dec-09 vs. Dec-11
Dec-09 Dec-11 Change %
301 255 -46 -15%
MLS: ACTRIS Period: 2 years (monthly) Price: All Construction Type: All Bedrooms: All Bathrooms: All Lot Size: All
Property Types: Residential: (House, Condo, Townhouse, Half Duplex, Modular) Sq Ft: All
MLS Areas: 10N, 10S
Clarus MarketMetrics® 1 of 2 01/04/2012
Information not guaranteed. © 2009-2010 Terradatum and its suppliers and licensors (www.terradatum.com/about/licensors.td).
www.TaylorRealEstateAustin.com | Direct: 512.796.4447 | Fax: 512.628.7720 | 2525 Wallingwood Bldg. 7C Austin, TX 78746
11 of 20
- 12. Blake Taylor Taylor Real Estate
For Sale Properties by Month
Dec-09 vs. Dec-11: The number of For Sale properties is down 15%
Full Market Bank Properties Non-Bank Properties
Time Period # Properties Median Price Average DOM # Properties % Bank Median Price # Properties % Non-Bank Median Price
Dec-11 255 170,000 96 27 10.6 139,900 228 89.4 172,250
Nov-11 282 174,994 96 24 8.5 139,950 258 91.5 176,500
Oct-11 332 174,900 92 25 7.5 149,900 307 92.5 174,999
Sep-11 347 172,500 94 23 6.6 145,000 324 93.4 174,900
Aug-11 388 172,700 91 15 3.9 145,000 373 96.1 174,900
Jul-11 441 174,900 86 19 4.3 129,000 422 95.7 175,000
Jun-11 464 172,700 82 21 4.5 124,900 443 95.5 174,900
May-11 446 170,000 82 16 3.6 128,450 430 96.4 174,800
Apr-11 460 174,500 82 22 4.8 135,450 438 95.2 175,000
Mar-11 451 172,000 86 24 5.3 122,700 427 94.7 174,900
Feb-11 391 169,900 95 22 5.6 123,200 369 94.4 172,900
Jan-11 392 169,900 108 21 5.4 129,000 371 94.6 170,000
Dec-10 393 169,895 115 25 6.4 144,900 368 93.6 170,562
Nov-10 436 169,900 105 28 6.4 137,450 408 93.6 173,200
Oct-10 507 170,000 94 23 4.5 145,000 484 95.5 173,625
Sep-10 525 172,000 89 22 4.2 139,900 503 95.8 174,000
Aug-10 556 170,000 86 23 4.1 139,900 533 95.9 173,250
Jul-10 554 172,950 83 21 3.8 140,000 533 96.2 174,900
Jun-10 534 170,000 75 19 3.6 140,000 515 96.4 172,900
May-10 488 175,000 69 14 2.9 139,950 474 97.1 176,450
Apr-10 560 179,800 57 11 2.0 140,000 549 98.0 179,900
Mar-10 471 179,900 60 10 2.1 137,450 461 97.9 179,999
Feb-10 375 180,000 70 6 1.6 156,450 369 98.4 182,500
Jan-10 318 179,900 80 6 1.9 161,950 312 98.1 179,900
Dec-09 301 183,500 88 8 2.7 154,950 293 97.3 184,900
Clarus MarketMetrics® 2 of 2 01/04/2012
Information not guaranteed. © 2009-2010 Terradatum and its suppliers and licensors (www.terradatum.com/about/licensors.td).
www.TaylorRealEstateAustin.com | Direct: 512.796.4447 | Fax: 512.628.7720 | 2525 Wallingwood Bldg. 7C Austin, TX 78746
12 of 20
- 13. Blake Taylor Taylor Real Estate
Expired Properties by Month
Dec-09 vs. Dec-11: The number of Expired properties is down 19%
Dec-09 vs. Dec-11
Dec-09 Dec-11 Change %
43 35 -8 -19%
MLS: ACTRIS Period: 2 years (monthly) Price: All Construction Type: All Bedrooms: All Bathrooms: All Lot Size: All
Property Types: Residential: (House, Condo, Townhouse, Half Duplex, Modular) Sq Ft: All
MLS Areas: 10N, 10S
Clarus MarketMetrics® 1 of 2 01/04/2012
Information not guaranteed. © 2009-2010 Terradatum and its suppliers and licensors (www.terradatum.com/about/licensors.td).
www.TaylorRealEstateAustin.com | Direct: 512.796.4447 | Fax: 512.628.7720 | 2525 Wallingwood Bldg. 7C Austin, TX 78746
13 of 20
- 14. Blake Taylor Taylor Real Estate
Expired Properties by Month
Dec-09 vs. Dec-11: The number of Expired properties is down 19%
Full Market Bank Properties Non-Bank Properties
Time Period # Properties Median Price Average DOM # Properties % Bank Median Price # Properties % Non-Bank Median Price
Dec-11 35 169,000 122 3 8.6 149,900 32 91.4 169,700
Nov-11 28 179,900 128 2 7.1 196,200 26 92.9 179,900
Oct-11 34 167,250 98 1 2.9 169,900 33 97.1 167,000
Sep-11 35 159,900 116 2 5.7 134,950 33 94.3 163,580
Aug-11 43 159,900 118 1 2.3 184,900 42 97.7 159,900
Jul-11 53 184,900 110 1 1.9 147,000 52 98.1 185,700
Jun-11 35 179,444 116 2 5.7 121,200 33 94.3 180,000
May-11 29 169,900 112 2 6.9 136,950 27 93.1 170,000
Apr-11 52 184,900 111 2 3.9 147,475 50 96.2 184,900
Mar-11 31 179,900 120 1 3.2 179,900 30 96.8 181,450
Feb-11 32 189,950 146 2 6.2 141,450 30 93.8 190,440
Jan-11 41 179,950 165 0 41 100.0 179,950
Dec-10 54 169,898 137 2 3.7 149,950 52 96.3 169,900
Nov-10 48 184,900 127 2 4.2 137,450 46 95.8 184,900
Oct-10 70 170,000 110 2 2.9 177,200 68 97.1 170,000
Sep-10 72 179,700 101 1 1.4 144,900 71 98.6 179,900
Aug-10 95 177,900 105 2 2.1 97,400 93 97.9 179,000
Jul-10 58 175,000 106 0 58 100.0 175,000
Jun-10 57 190,000 69 1 1.8 194,425 56 98.2 189,950
May-10 36 193,450 86 0 36 100.0 193,450
Apr-10 32 197,490 119 1 3.1 264,900 31 96.9 194,980
Mar-10 32 193,250 84 1 3.1 147,900 31 96.9 194,500
Feb-10 21 212,000 123 0 21 100.0 212,000
Jan-10 24 180,450 132 0 24 100.0 180,450
Dec-09 43 199,500 103 0 43 100.0 199,500
Clarus MarketMetrics® 2 of 2 01/04/2012
Information not guaranteed. © 2009-2010 Terradatum and its suppliers and licensors (www.terradatum.com/about/licensors.td).
www.TaylorRealEstateAustin.com | Direct: 512.796.4447 | Fax: 512.628.7720 | 2525 Wallingwood Bldg. 7C Austin, TX 78746
14 of 20
- 15. Blake Taylor Taylor Real Estate
Supply & Demand by Month
Dec-09 vs. Dec-11: The number of for sale properties is down 15% and the number of sold properties is up 18%
Dec-09 vs. Dec-11 Dec-09 vs. Dec-11
Dec-09 Dec-11 Change % Dec-09 Dec-11 Change %
301 255 -46 -15% 56 66 10 +18%
MLS: ACTRIS Period: 2 years (monthly) Price: All Construction Type: All Bedrooms: All Bathrooms: All Lot Size: All
Property Types: Residential: (House, Condo, Townhouse, Half Duplex, Modular) Sq Ft: All
MLS Areas: 10N, 10S
Clarus MarketMetrics® 1 of 2 01/04/2012
Information not guaranteed. © 2009-2010 Terradatum and its suppliers and licensors (www.terradatum.com/about/licensors.td).
www.TaylorRealEstateAustin.com | Direct: 512.796.4447 | Fax: 512.628.7720 | 2525 Wallingwood Bldg. 7C Austin, TX 78746
15 of 20
- 16. Blake Taylor Taylor Real Estate
Supply & Demand by Month
Dec-09 vs. Dec-11: The number of for sale properties is down 15% and the number of sold properties is up 18%
# Properties Average DOM # Properties Average DOM
Time Period For Sale For Sale Sold Sold
Dec-11 255 96 66 80
Nov-11 282 96 74 61
Oct-11 332 92 72 62
Sep-11 347 94 77 51
Aug-11 388 91 92 63
Jul-11 441 86 93 55
Jun-11 464 82 94 50
May-11 446 82 81 55
Apr-11 460 82 84 73
Mar-11 451 86 72 69
Feb-11 391 95 41 98
Jan-11 392 108 42 96
Dec-10 393 115 69 90
Nov-10 436 105 61 66
Oct-10 507 94 44 69
Sep-10 525 89 57 57
Aug-10 556 86 60 59
Jul-10 554 83 60 44
Jun-10 534 75 93 36
May-10 488 69 106 38
Apr-10 560 57 115 45
Mar-10 471 60 91 40
Feb-10 375 70 54 39
Jan-10 318 80 42 49
Dec-09 301 88 56 34
Clarus MarketMetrics® 2 of 2 01/04/2012
Information not guaranteed. © 2009-2010 Terradatum and its suppliers and licensors (www.terradatum.com/about/licensors.td).
www.TaylorRealEstateAustin.com | Direct: 512.796.4447 | Fax: 512.628.7720 | 2525 Wallingwood Bldg. 7C Austin, TX 78746
16 of 20
- 17. Blake Taylor Taylor Real Estate
The Average Days on Market by Month
Dec-09 vs. Dec-11: The average days on market is up 8%
Dec-09 vs. Dec-11
Dec-09 Dec-11 Change %
54 59 5 +8%
MLS: ACTRIS Period: 2 years (monthly) Price: All Construction Type: All Bedrooms: All Bathrooms: All Lot Size: All
Property Types: Residential: (House, Condo, Townhouse, Half Duplex, Modular) Sq Ft: All
MLS Areas: 10N, 10S
Clarus MarketMetrics® 1 of 2 01/04/2012
Information not guaranteed. © 2009-2010 Terradatum and its suppliers and licensors (www.terradatum.com/about/licensors.td).
www.TaylorRealEstateAustin.com | Direct: 512.796.4447 | Fax: 512.628.7720 | 2525 Wallingwood Bldg. 7C Austin, TX 78746
17 of 20
- 18. Blake Taylor Taylor Real Estate
The Average Days on Market by Month
Dec-09 vs. Dec-11: The average days on market is up 8%
Time Period Average DOM # UC Units
Dec-11 59 51
Nov-11 75 61
Oct-11 68 81
Sep-11 60 77
Aug-11 62 79
Jul-11 52 96
Jun-11 62 88
May-11 50 95
Apr-11 58 81
Mar-11 68 94
Feb-11 60 56
Jan-11 118 51
Dec-10 84 53
Nov-10 87 47
Oct-10 71 63
Sep-10 75 47
Aug-10 47 57
Jul-10 62 62
Jun-10 47 61
May-10 41 51
Apr-10 38 146
Mar-10 35 111
Feb-10 50 84
Jan-10 38 65
Dec-09 54 52
Clarus MarketMetrics® 2 of 2 01/04/2012
Information not guaranteed. © 2009-2010 Terradatum and its suppliers and licensors (www.terradatum.com/about/licensors.td).
www.TaylorRealEstateAustin.com | Direct: 512.796.4447 | Fax: 512.628.7720 | 2525 Wallingwood Bldg. 7C Austin, TX 78746
18 of 20
- 19. Blake Taylor Taylor Real Estate
Months Supply of Inventory
Dec-09 vs. Dec-11: The average months supply of inventory is down 16%
Dec-09 vs. Dec-11
Dec-09 Dec-11 Change %
4.0 3.3 -0.6 -16%
MLS: ACTRIS Period: 2 years (monthly) Price: All Construction Type: All Bedrooms: All Bathrooms: All Lot Size: All
Property Types: Residential: (House, Condo, Townhouse, Half Duplex, Modular) Sq Ft: All
MLS Areas: 10N, 10S
Clarus MarketMetrics® 1 of 2 01/04/2012
Information not guaranteed. © 2009-2010 Terradatum and its suppliers and licensors (www.terradatum.com/about/licensors.td).
www.TaylorRealEstateAustin.com | Direct: 512.796.4447 | Fax: 512.628.7720 | 2525 Wallingwood Bldg. 7C Austin, TX 78746
19 of 20
- 20. Blake Taylor Taylor Real Estate
Months Supply of Inventory
Dec-09 vs. Dec-11: The average months supply of inventory is down 16%
# Units For Sale # UC Units UC Average
Time Period Last Day of Month During Month MSI DOM
Dec-11 169 51 3.3 59
Nov-11 193 61 3.2 75
Oct-11 217 81 2.7 68
Sep-11 235 77 3.1 60
Aug-11 266 79 3.4 62
Jul-11 292 96 3.0 52
Jun-11 341 88 3.9 62
May-11 322 95 3.4 50
Apr-11 327 81 4.0 58
Mar-11 326 94 3.5 68
Feb-11 303 56 5.4 60
Jan-11 300 51 5.9 118
Dec-10 286 53 5.4 84
Nov-10 341 47 7.3 87
Oct-10 374 63 5.9 71
Sep-10 406 47 8.6 75
Aug-10 404 57 7.1 47
Jul-10 434 62 7.0 62
Jun-10 416 61 6.8 47
May-10 401 51 7.9 41
Apr-10 382 146 2.6 38
Mar-10 328 111 3.0 35
Feb-10 270 84 3.2 50
Jan-10 229 65 3.5 38
Dec-09 206 52 4.0 54
Clarus MarketMetrics® 2 of 2 01/04/2012
Information not guaranteed. © 2009-2010 Terradatum and its suppliers and licensors (www.terradatum.com/about/licensors.td).
www.TaylorRealEstateAustin.com | Direct: 512.796.4447 | Fax: 512.628.7720 | 2525 Wallingwood Bldg. 7C Austin, TX 78746
20 of 20