Contenu connexe
Similaire à Area 2 allandale, brentwood, crestview
6,7, 78704, travis heights, bouldin creek, barton hills6,7, 78704, travis heights, bouldin creek, barton hillsTaylor Real Estate
Similaire à Area 2 allandale, brentwood, crestview (16)
Area 2 allandale, brentwood, crestview
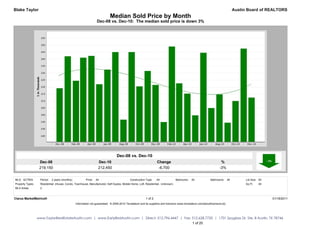
- 1. Blake Taylor Austin Board of REALTORS
Median Sold Price by Month
Dec-08 vs. Dec-10: The median sold price is down 3%
Dec-08 vs. Dec-10
Dec-08 Dec-10 Change %
219,150 212,450 -6,700 -3%
MLS: ACTRIS Period: 2 years (monthly) Price: All Construction Type: All Bedrooms: All Bathrooms: All Lot Size: All
Property Types: Residential: (House, Condo, Townhouse, Manufactured, Half Duplex, Mobile Home, Loft, Residential - Unknown) Sq Ft: All
MLS Areas: 2
Clarus MarketMetrics® 1 of 2 01/18/2011
Information not guaranteed. © 2009-2010 Terradatum and its suppliers and licensors (www.terradatum.com/about/licensors.td).
www.TaylorRealEstateAustin.com | www.EarlyBirdAustin.com | Direct: 512.796.4447 | Fax: 512.628.7720 | 1701 Spyglass Dr. Ste. 8 Austin, TX 78746
1 of 20
- 2. Blake Taylor Austin Board of REALTORS
Median Sold Price by Month
Dec-08 vs. Dec-10: The median sold price is down 3%
Time Period Median Price # Units Average DOM
Dec-10 212,450 22 60
Nov-10 247,500 22 60
Oct-10 210,000 21 88
Sep-10 194,500 26 61
Aug-10 214,750 40 64
Jul-10 205,000 27 71
Jun-10 244,500 30 49
May-10 199,750 38 66
Apr-10 215,335 60 64
Mar-10 222,650 28 56
Feb-10 249,000 15 77
Jan-10 195,000 13 129
Dec-09 221,500 29 53
Nov-09 231,500 50 78
Oct-09 220,500 42 61
Sep-09 245,000 38 71
Aug-09 196,700 40 43
Jul-09 245,000 43 52
Jun-09 232,450 46 49
May-09 222,000 43 62
Apr-09 242,250 32 54
Mar-09 241,000 26 69
Feb-09 224,500 24 52
Jan-09 242,000 13 75
Dec-08 219,150 24 64
Clarus MarketMetrics® 2 of 2 01/18/2011
Information not guaranteed. © 2009-2010 Terradatum and its suppliers and licensors (www.terradatum.com/about/licensors.td).
www.TaylorRealEstateAustin.com | www.EarlyBirdAustin.com | Direct: 512.796.4447 | Fax: 512.628.7720 | 1701 Spyglass Dr. Ste. 8 Austin, TX 78746
2 of 20
- 3. Blake Taylor Austin Board of REALTORS
Median For Sale vs. Median Sold
Dec-08 vs. Dec-10: The median price of for sale properties is down 13% and the median price of sold properties is down 3%
Dec-08 vs. Dec-10 Dec-08 vs. Dec-10
Dec-08 Dec-10 Change % Dec-08 Dec-10 Change %
244,900 212,500 -32,400 -13% 219,150 212,450 -6,700 -3%
MLS: ACTRIS Period: 2 years (monthly) Price: All Construction Type: All Bedrooms: All Bathrooms: All Lot Size: All
Property Types: Residential: (House, Condo, Townhouse, Manufactured, Half Duplex, Mobile Home, Loft, Residential - Unknown) Sq Ft: All
MLS Areas: 2
Clarus MarketMetrics® 1 of 2 01/18/2011
Information not guaranteed. © 2009-2010 Terradatum and its suppliers and licensors (www.terradatum.com/about/licensors.td).
www.TaylorRealEstateAustin.com | www.EarlyBirdAustin.com | Direct: 512.796.4447 | Fax: 512.628.7720 | 1701 Spyglass Dr. Ste. 8 Austin, TX 78746
3 of 20
- 4. Blake Taylor Austin Board of REALTORS
Median For Sale vs. Median Sold
Dec-08 vs. Dec-10: The median price of for sale properties is down 13% and the median price of sold properties is down 3%
For Sale # Properties Sold # Properties Price
Time Period Median For Sale Median Sold Difference
Dec-10 212,500 208 212,450 22 -50
Nov-10 210,000 243 247,500 22 37,500
Oct-10 206,500 272 210,000 21 3,500
Sep-10 209,975 280 194,500 26 -15,475
Aug-10 219,900 299 214,750 40 -5,150
Jul-10 219,450 302 205,000 27 -14,450
Jun-10 219,450 296 244,500 30 25,050
May-10 214,500 266 199,750 38 -14,750
Apr-10 212,250 276 215,335 60 3,085
Mar-10 210,000 260 222,650 28 12,650
Feb-10 209,900 209 249,000 15 39,100
Jan-10 204,250 184 195,000 13 -9,250
Dec-09 209,000 172 221,500 29 12,500
Nov-09 220,000 197 231,500 50 11,500
Oct-09 220,000 235 220,500 42 500
Sep-09 229,000 245 245,000 38 16,000
Aug-09 229,500 261 196,700 40 -32,800
Jul-09 229,000 260 245,000 43 16,000
Jun-09 246,800 252 232,450 46 -14,350
May-09 232,450 238 222,000 43 -10,450
Apr-09 225,000 225 242,250 32 17,250
Mar-09 237,000 204 241,000 26 4,000
Feb-09 233,450 194 224,500 24 -8,950
Jan-09 235,000 185 242,000 13 7,000
Dec-08 244,900 191 219,150 24 -25,750
Clarus MarketMetrics® 2 of 2 01/18/2011
Information not guaranteed. © 2009-2010 Terradatum and its suppliers and licensors (www.terradatum.com/about/licensors.td).
www.TaylorRealEstateAustin.com | www.EarlyBirdAustin.com | Direct: 512.796.4447 | Fax: 512.628.7720 | 1701 Spyglass Dr. Ste. 8 Austin, TX 78746
4 of 20
- 5. Blake Taylor Austin Board of REALTORS
Sold Properties by Month
Dec-08 vs. Dec-10: The number of Sold properties is down 8%
Dec-08 vs. Dec-10
Dec-08 Dec-10 Change %
24 22 -2 -8%
MLS: ACTRIS Period: 2 years (monthly) Price: All Construction Type: All Bedrooms: All Bathrooms: All Lot Size: All
Property Types: Residential: (House, Condo, Townhouse, Manufactured, Half Duplex, Mobile Home, Loft, Residential - Unknown) Sq Ft: All
MLS Areas: 2
Clarus MarketMetrics® 1 of 2 01/18/2011
Information not guaranteed. © 2009-2010 Terradatum and its suppliers and licensors (www.terradatum.com/about/licensors.td).
www.TaylorRealEstateAustin.com | www.EarlyBirdAustin.com | Direct: 512.796.4447 | Fax: 512.628.7720 | 1701 Spyglass Dr. Ste. 8 Austin, TX 78746
5 of 20
- 6. Blake Taylor Austin Board of REALTORS
Sold Properties by Month
Dec-08 vs. Dec-10: The number of Sold properties is down 8%
Full Market Bank Properties Non-Bank Properties
Time Period # Properties Median Price Average DOM # Properties % Bank Median Price # Properties % Non-Bank Median Price
Dec-10 22 212,450 60 0 22 100.0 212,450
Nov-10 22 247,500 60 1 4.5 60,000 21 95.5 249,000
Oct-10 21 210,000 88 0 21 100.0 210,000
Sep-10 26 194,500 61 0 26 100.0 194,500
Aug-10 40 214,750 64 1 2.5 69,900 39 97.5 220,000
Jul-10 27 205,000 71 1 3.7 50,852 26 96.3 207,500
Jun-10 30 244,500 49 1 3.3 52,500 29 96.7 250,000
May-10 38 199,750 66 1 2.6 75,000 37 97.4 200,000
Apr-10 60 215,335 64 1 1.7 225,000 59 98.3 215,000
Mar-10 28 222,650 56 0 28 100.0 222,650
Feb-10 15 249,000 77 0 15 100.0 249,000
Jan-10 13 195,000 129 0 13 100.0 195,000
Dec-09 29 221,500 53 2 6.9 62,800 27 93.1 230,865
Nov-09 50 231,500 78 0 50 100.0 231,500
Oct-09 42 220,500 61 0 42 100.0 220,500
Sep-09 38 245,000 71 1 2.6 272,000 37 97.4 245,000
Aug-09 40 196,700 43 1 2.5 105,000 39 97.5 199,500
Jul-09 43 245,000 52 3 7.0 181,900 40 93.0 249,000
Jun-09 46 232,450 49 1 2.2 102,000 45 97.8 235,000
May-09 43 222,000 62 1 2.3 139,000 42 97.7 222,750
Apr-09 32 242,250 54 2 6.2 110,000 30 93.8 249,000
Mar-09 26 241,000 69 2 7.7 283,500 24 92.3 241,000
Feb-09 24 224,500 52 0 24 100.0 224,500
Jan-09 13 242,000 75 1 7.7 300,000 12 92.3 236,500
Dec-08 24 219,150 64 2 8.3 221,000 22 91.7 219,150
Clarus MarketMetrics® 2 of 2 01/18/2011
Information not guaranteed. © 2009-2010 Terradatum and its suppliers and licensors (www.terradatum.com/about/licensors.td).
www.TaylorRealEstateAustin.com | www.EarlyBirdAustin.com | Direct: 512.796.4447 | Fax: 512.628.7720 | 1701 Spyglass Dr. Ste. 8 Austin, TX 78746
6 of 20
- 7. Blake Taylor Austin Board of REALTORS
Under Contract Properties by Month
Dec-08 vs. Dec-10: The number of Under Contract properties is up 93%
Dec-08 vs. Dec-10
Dec-08 Dec-10 Change %
15 29 14 +93%
MLS: ACTRIS Period: 2 years (monthly) Price: All Construction Type: All Bedrooms: All Bathrooms: All Lot Size: All
Property Types: Residential: (House, Condo, Townhouse, Manufactured, Half Duplex, Mobile Home, Loft, Residential - Unknown) Sq Ft: All
MLS Areas: 2
Clarus MarketMetrics® 1 of 2 01/18/2011
Information not guaranteed. © 2009-2010 Terradatum and its suppliers and licensors (www.terradatum.com/about/licensors.td).
www.TaylorRealEstateAustin.com | www.EarlyBirdAustin.com | Direct: 512.796.4447 | Fax: 512.628.7720 | 1701 Spyglass Dr. Ste. 8 Austin, TX 78746
7 of 20
- 8. Blake Taylor Austin Board of REALTORS
Under Contract Properties by Month
Dec-08 vs. Dec-10: The number of Under Contract properties is up 93%
Full Market Bank Properties Non-Bank Properties
Time Period # Properties Median Price Average DOM # Properties % Bank Median Price # Properties % Non-Bank Median Price
Dec-10 29 229,900 82 3 10.3 275,000 26 89.7 229,900
Nov-10 29 234,900 65 2 6.9 147,400 27 93.1 239,000
Oct-10 20 236,500 48 1 5.0 134,900 19 95.0 239,000
Sep-10 26 217,450 88 0 26 100.0 217,450
Aug-10 27 239,900 60 0 27 100.0 239,900
Jul-10 38 237,000 67 1 2.6 69,900 37 97.4 239,000
Jun-10 27 239,000 77 0 27 100.0 239,000
May-10 25 210,000 44 2 8.0 55,100 23 92.0 215,000
Apr-10 44 237,000 62 1 2.3 84,900 43 97.7 239,000
Mar-10 57 220,000 57 1 1.8 229,900 56 98.2 219,495
Feb-10 26 223,450 77 0 26 100.0 223,450
Jan-10 21 185,000 112 0 21 100.0 185,000
Dec-09 12 222,445 42 0 12 100.0 222,445
Nov-09 24 288,950 66 0 24 100.0 288,950
Oct-09 54 225,000 59 2 3.7 54,900 52 96.3 227,450
Sep-09 39 239,900 72 0 39 100.0 239,900
Aug-09 41 234,777 66 0 41 100.0 234,777
Jul-09 40 227,450 54 2 5.0 207,500 38 95.0 227,450
Jun-09 47 250,000 54 2 4.3 139,900 45 95.7 259,500
May-09 44 219,500 50 2 4.5 130,800 42 95.5 220,000
Apr-09 43 235,000 60 2 4.7 118,900 41 95.3 239,000
Mar-09 34 237,400 45 1 2.9 189,900 33 97.1 239,900
Feb-09 25 259,500 71 2 8.0 292,495 23 92.0 259,500
Jan-09 23 245,000 55 0 23 100.0 245,000
Dec-08 15 235,000 85 0 15 100.0 235,000
Clarus MarketMetrics® 2 of 2 01/18/2011
Information not guaranteed. © 2009-2010 Terradatum and its suppliers and licensors (www.terradatum.com/about/licensors.td).
www.TaylorRealEstateAustin.com | www.EarlyBirdAustin.com | Direct: 512.796.4447 | Fax: 512.628.7720 | 1701 Spyglass Dr. Ste. 8 Austin, TX 78746
8 of 20
- 9. Blake Taylor Austin Board of REALTORS
New Properties by Month
Dec-08 vs. Dec-10: The number of New properties is down 18%
Dec-08 vs. Dec-10
Dec-08 Dec-10 Change %
33 27 -6 -18%
MLS: ACTRIS Period: 2 years (monthly) Price: All Construction Type: All Bedrooms: All Bathrooms: All Lot Size: All
Property Types: Residential: (House, Condo, Townhouse, Manufactured, Half Duplex, Mobile Home, Loft, Residential - Unknown) Sq Ft: All
MLS Areas: 2
Clarus MarketMetrics® 1 of 2 01/18/2011
Information not guaranteed. © 2009-2010 Terradatum and its suppliers and licensors (www.terradatum.com/about/licensors.td).
www.TaylorRealEstateAustin.com | www.EarlyBirdAustin.com | Direct: 512.796.4447 | Fax: 512.628.7720 | 1701 Spyglass Dr. Ste. 8 Austin, TX 78746
9 of 20
- 10. Blake Taylor Austin Board of REALTORS
New Properties by Month
Dec-08 vs. Dec-10: The number of New properties is down 18%
Full Market Bank Properties Non-Bank Properties
Time Period # Properties Median Price # Properties % Bank Median Price # Properties % Non-Bank Median Price
Dec-10 27 239,900 2 7.4 185,750 25 92.6 239,900
Nov-10 35 249,000 1 2.9 109,900 34 97.1 249,450
Oct-10 53 227,000 3 5.7 134,900 50 94.3 228,450
Sep-10 58 212,500 3 5.2 159,900 55 94.8 215,000
Aug-10 58 224,750 2 3.5 144,945 56 96.5 229,700
Jul-10 67 219,000 5 7.5 164,900 62 92.5 219,900
Jun-10 78 225,000 0 78 100.0 225,000
May-10 50 219,450 2 4.0 204,950 48 96.0 219,450
Apr-10 97 229,900 2 2.1 184,900 95 97.9 229,900
Mar-10 92 232,200 2 2.2 145,100 90 97.8 234,750
Feb-10 61 215,000 0 61 100.0 215,000
Jan-10 54 189,450 1 1.9 110,000 53 98.2 189,900
Dec-09 24 199,900 2 8.3 84,900 22 91.7 202,450
Nov-09 39 229,500 0 39 100.0 229,500
Oct-09 55 229,900 0 55 100.0 229,900
Sep-09 57 235,000 1 1.8 59,900 56 98.2 237,000
Aug-09 74 229,700 0 74 100.0 229,700
Jul-09 71 222,000 1 1.4 350,000 70 98.6 220,950
Jun-09 67 250,000 0 67 100.0 250,000
May-09 76 265,000 2 2.6 199,950 74 97.4 265,000
Apr-09 68 206,250 1 1.5 138,600 67 98.5 208,000
Mar-09 59 219,500 8 13.6 126,500 51 86.4 239,000
Feb-09 51 235,000 1 2.0 199,990 50 98.0 237,375
Jan-09 48 234,900 1 2.1 385,000 47 97.9 234,900
Dec-08 33 224,500 2 6.1 120,400 31 93.9 225,000
Clarus MarketMetrics® 2 of 2 01/18/2011
Information not guaranteed. © 2009-2010 Terradatum and its suppliers and licensors (www.terradatum.com/about/licensors.td).
www.TaylorRealEstateAustin.com | www.EarlyBirdAustin.com | Direct: 512.796.4447 | Fax: 512.628.7720 | 1701 Spyglass Dr. Ste. 8 Austin, TX 78746
10 of 20
- 11. Blake Taylor Austin Board of REALTORS
For Sale Properties by Month
Dec-08 vs. Dec-10: The number of For Sale properties is up 9%
Dec-08 vs. Dec-10
Dec-08 Dec-10 Change %
191 208 17 +9%
MLS: ACTRIS Period: 2 years (monthly) Price: All Construction Type: All Bedrooms: All Bathrooms: All Lot Size: All
Property Types: Residential: (House, Condo, Townhouse, Manufactured, Half Duplex, Mobile Home, Loft, Residential - Unknown) Sq Ft: All
MLS Areas: 2
Clarus MarketMetrics® 1 of 2 01/18/2011
Information not guaranteed. © 2009-2010 Terradatum and its suppliers and licensors (www.terradatum.com/about/licensors.td).
www.TaylorRealEstateAustin.com | www.EarlyBirdAustin.com | Direct: 512.796.4447 | Fax: 512.628.7720 | 1701 Spyglass Dr. Ste. 8 Austin, TX 78746
11 of 20
- 12. Blake Taylor Austin Board of REALTORS
For Sale Properties by Month
Dec-08 vs. Dec-10: The number of For Sale properties is up 9%
Full Market Bank Properties Non-Bank Properties
Time Period # Properties Median Price Average DOM # Properties % Bank Median Price # Properties % Non-Bank Median Price
Dec-10 208 212,500 137 13 6.2 164,900 195 93.8 215,000
Nov-10 243 210,000 138 14 5.8 162,400 229 94.2 215,000
Oct-10 272 206,500 144 14 5.2 162,400 258 94.8 209,500
Sep-10 280 209,975 150 11 3.9 164,900 269 96.1 215,000
Aug-10 299 219,900 152 9 3.0 169,990 290 97.0 220,000
Jul-10 302 219,450 149 8 2.6 177,450 294 97.3 219,900
Jun-10 296 219,450 151 3 1.0 319,900 293 99.0 219,000
May-10 266 214,500 153 6 2.3 77,400 260 97.7 214,700
Apr-10 276 212,250 149 6 2.2 84,900 270 97.8 214,700
Mar-10 260 210,000 142 5 1.9 84,900 255 98.1 210,000
Feb-10 209 209,900 157 4 1.9 97,450 205 98.1 210,000
Jan-10 184 204,250 176 4 2.2 97,450 180 97.8 204,750
Dec-09 172 209,000 191 3 1.7 84,900 169 98.3 210,000
Nov-09 197 220,000 172 1 0.5 220,000 196 99.5 222,500
Oct-09 235 220,000 150 3 1.3 59,900 232 98.7 224,950
Sep-09 245 229,000 156 3 1.2 59,900 242 98.8 229,000
Aug-09 261 229,500 153 3 1.1 220,000 258 98.8 229,700
Jul-09 260 229,000 146 6 2.3 175,000 254 97.7 229,000
Jun-09 252 246,800 146 7 2.8 130,000 245 97.2 249,000
May-09 238 232,450 146 10 4.2 134,300 228 95.8 235,000
Apr-09 225 225,000 151 10 4.4 126,500 215 95.6 234,900
Mar-09 204 237,000 149 11 5.4 130,000 193 94.6 244,500
Feb-09 194 233,450 159 7 3.6 189,900 187 96.4 234,900
Jan-09 185 235,000 161 6 3.2 162,400 179 96.8 239,500
Dec-08 191 244,900 160 5 2.6 134,900 186 97.4 245,758
Clarus MarketMetrics® 2 of 2 01/18/2011
Information not guaranteed. © 2009-2010 Terradatum and its suppliers and licensors (www.terradatum.com/about/licensors.td).
www.TaylorRealEstateAustin.com | www.EarlyBirdAustin.com | Direct: 512.796.4447 | Fax: 512.628.7720 | 1701 Spyglass Dr. Ste. 8 Austin, TX 78746
12 of 20
- 13. Blake Taylor Austin Board of REALTORS
Expired Properties by Month
Dec-08 vs. Dec-10: The number of Expired properties is down 13%
Dec-08 vs. Dec-10
Dec-08 Dec-10 Change %
39 34 -5 -13%
MLS: ACTRIS Period: 2 years (monthly) Price: All Construction Type: All Bedrooms: All Bathrooms: All Lot Size: All
Property Types: Residential: (House, Condo, Townhouse, Manufactured, Half Duplex, Mobile Home, Loft, Residential - Unknown) Sq Ft: All
MLS Areas: 2
Clarus MarketMetrics® 1 of 2 01/18/2011
Information not guaranteed. © 2009-2010 Terradatum and its suppliers and licensors (www.terradatum.com/about/licensors.td).
www.TaylorRealEstateAustin.com | www.EarlyBirdAustin.com | Direct: 512.796.4447 | Fax: 512.628.7720 | 1701 Spyglass Dr. Ste. 8 Austin, TX 78746
13 of 20
- 14. Blake Taylor Austin Board of REALTORS
Expired Properties by Month
Dec-08 vs. Dec-10: The number of Expired properties is down 13%
Full Market Bank Properties Non-Bank Properties
Time Period # Properties Median Price Average DOM # Properties % Bank Median Price # Properties % Non-Bank Median Price
Dec-10 34 196,950 132 0 34 100.0 196,950
Nov-10 33 219,900 117 1 3.0 119,900 32 97.0 219,950
Oct-10 44 202,250 140 0 44 100.0 202,250
Sep-10 35 239,950 112 0 35 100.0 239,950
Aug-10 50 238,000 126 1 2.0 190,000 49 98.0 239,000
Jul-10 23 189,900 101 0 23 100.0 189,900
Jun-10 34 210,000 102 0 34 100.0 210,000
May-10 23 210,000 105 1 4.3 84,900 22 95.7 212,250
Apr-10 16 167,200 96 1 6.2 110,000 15 93.8 169,900
Mar-10 24 224,450 119 0 24 100.0 224,450
Feb-10 15 229,900 136 1 6.7 220,000 14 93.3 232,450
Jan-10 15 199,000 122 0 15 100.0 199,000
Dec-09 30 198,950 150 0 30 100.0 198,950
Nov-09 25 249,875 94 0 25 100.0 249,875
Oct-09 23 224,900 115 0 23 100.0 224,900
Sep-09 26 288,400 149 0 26 100.0 288,400
Aug-09 32 269,950 106 1 3.1 350,000 31 96.9 265,000
Jul-09 33 215,000 94 1 3.0 79,900 32 97.0 219,950
Jun-09 16 259,450 105 0 16 100.0 259,450
May-09 9 204,900 97 1 11.1 204,900 8 88.9 204,900
Apr-09 20 280,504 82 0 20 100.0 280,504
Mar-09 13 246,515 90 1 7.7 134,900 12 92.3 248,108
Feb-09 24 156,450 96 2 8.3 152,700 22 91.7 156,450
Jan-09 19 245,000 111 0 19 100.0 245,000
Dec-08 39 270,000 125 0 39 100.0 270,000
Clarus MarketMetrics® 2 of 2 01/18/2011
Information not guaranteed. © 2009-2010 Terradatum and its suppliers and licensors (www.terradatum.com/about/licensors.td).
www.TaylorRealEstateAustin.com | www.EarlyBirdAustin.com | Direct: 512.796.4447 | Fax: 512.628.7720 | 1701 Spyglass Dr. Ste. 8 Austin, TX 78746
14 of 20
- 15. Blake Taylor Austin Board of REALTORS
Supply & Demand by Month
Dec-08 vs. Dec-10: The number of for sale properties is up 9% and the number of sold properties is down 8%
Dec-08 vs. Dec-10 Dec-08 vs. Dec-10
Dec-08 Dec-10 Change % Dec-08 Dec-10 Change %
191 208 17 +9% 24 22 -2 -8%
MLS: ACTRIS Period: 2 years (monthly) Price: All Construction Type: All Bedrooms: All Bathrooms: All Lot Size: All
Property Types: Residential: (House, Condo, Townhouse, Manufactured, Half Duplex, Mobile Home, Loft, Residential - Unknown) Sq Ft: All
MLS Areas: 2
Clarus MarketMetrics® 1 of 2 01/18/2011
Information not guaranteed. © 2009-2010 Terradatum and its suppliers and licensors (www.terradatum.com/about/licensors.td).
www.TaylorRealEstateAustin.com | www.EarlyBirdAustin.com | Direct: 512.796.4447 | Fax: 512.628.7720 | 1701 Spyglass Dr. Ste. 8 Austin, TX 78746
15 of 20
- 16. Blake Taylor Austin Board of REALTORS
Supply & Demand by Month
Dec-08 vs. Dec-10: The number of for sale properties is up 9% and the number of sold properties is down 8%
# Properties Average DOM # Properties Average DOM
Time Period For Sale For Sale Sold Sold
Dec-10 208 137 22 60
Nov-10 243 138 22 60
Oct-10 272 144 21 88
Sep-10 280 150 26 61
Aug-10 299 152 40 64
Jul-10 302 149 27 71
Jun-10 296 151 30 49
May-10 266 153 38 66
Apr-10 276 149 60 64
Mar-10 260 142 28 56
Feb-10 209 157 15 77
Jan-10 184 176 13 129
Dec-09 172 191 29 53
Nov-09 197 172 50 78
Oct-09 235 150 42 61
Sep-09 245 156 38 71
Aug-09 261 153 40 43
Jul-09 260 146 43 52
Jun-09 252 146 46 49
May-09 238 146 43 62
Apr-09 225 151 32 54
Mar-09 204 149 26 69
Feb-09 194 159 24 52
Jan-09 185 161 13 75
Dec-08 191 160 24 64
Clarus MarketMetrics® 2 of 2 01/18/2011
Information not guaranteed. © 2009-2010 Terradatum and its suppliers and licensors (www.terradatum.com/about/licensors.td).
www.TaylorRealEstateAustin.com | www.EarlyBirdAustin.com | Direct: 512.796.4447 | Fax: 512.628.7720 | 1701 Spyglass Dr. Ste. 8 Austin, TX 78746
16 of 20
- 17. Blake Taylor Austin Board of REALTORS
The Average Days on Market by Month
Dec-08 vs. Dec-10: The average days on market is down 3%
Dec-08 vs. Dec-10
Dec-08 Dec-10 Change %
85 82 -3 -3%
MLS: ACTRIS Period: 2 years (monthly) Price: All Construction Type: All Bedrooms: All Bathrooms: All Lot Size: All
Property Types: Residential: (House, Condo, Townhouse, Manufactured, Half Duplex, Mobile Home, Loft, Residential - Unknown) Sq Ft: All
MLS Areas: 2
Clarus MarketMetrics® 1 of 2 01/18/2011
Information not guaranteed. © 2009-2010 Terradatum and its suppliers and licensors (www.terradatum.com/about/licensors.td).
www.TaylorRealEstateAustin.com | www.EarlyBirdAustin.com | Direct: 512.796.4447 | Fax: 512.628.7720 | 1701 Spyglass Dr. Ste. 8 Austin, TX 78746
17 of 20
- 18. Blake Taylor Austin Board of REALTORS
The Average Days on Market by Month
Dec-08 vs. Dec-10: The average days on market is down 3%
Time Period Average DOM # UC Units
Dec-10 82 29
Nov-10 65 29
Oct-10 48 20
Sep-10 88 26
Aug-10 60 27
Jul-10 67 38
Jun-10 77 27
May-10 44 25
Apr-10 62 44
Mar-10 57 57
Feb-10 77 26
Jan-10 112 21
Dec-09 42 12
Nov-09 66 24
Oct-09 59 54
Sep-09 72 39
Aug-09 66 41
Jul-09 54 40
Jun-09 54 47
May-09 50 44
Apr-09 60 43
Mar-09 45 34
Feb-09 71 25
Jan-09 55 23
Dec-08 85 15
Clarus MarketMetrics® 2 of 2 01/18/2011
Information not guaranteed. © 2009-2010 Terradatum and its suppliers and licensors (www.terradatum.com/about/licensors.td).
www.TaylorRealEstateAustin.com | www.EarlyBirdAustin.com | Direct: 512.796.4447 | Fax: 512.628.7720 | 1701 Spyglass Dr. Ste. 8 Austin, TX 78746
18 of 20
- 19. Blake Taylor Austin Board of REALTORS
Months Supply of Inventory
Dec-08 vs. Dec-10: The average months supply of inventory is down 45%
Dec-08 vs. Dec-10
Dec-08 Dec-10 Change %
9.1 5.0 -4.1 -45%
MLS: ACTRIS Period: 2 years (monthly) Price: All Construction Type: All Bedrooms: All Bathrooms: All Lot Size: All
Property Types: Residential: (House, Condo, Townhouse, Manufactured, Half Duplex, Mobile Home, Loft, Residential - Unknown) Sq Ft: All
MLS Areas: 2
Clarus MarketMetrics® 1 of 2 01/18/2011
Information not guaranteed. © 2009-2010 Terradatum and its suppliers and licensors (www.terradatum.com/about/licensors.td).
www.TaylorRealEstateAustin.com | www.EarlyBirdAustin.com | Direct: 512.796.4447 | Fax: 512.628.7720 | 1701 Spyglass Dr. Ste. 8 Austin, TX 78746
19 of 20
- 20. Blake Taylor Austin Board of REALTORS
Months Supply of Inventory
Dec-08 vs. Dec-10: The average months supply of inventory is down 45%
# Units For Sale # UC Units UC Average
Time Period Last Day of Month During Month MSI DOM
Dec-10 145 29 5.0 82
Nov-10 181 29 6.2 65
Oct-10 208 20 10.4 48
Sep-10 219 26 8.4 88
Aug-10 222 27 8.2 60
Jul-10 241 38 6.3 67
Jun-10 235 27 8.7 77
May-10 218 25 8.7 44
Apr-10 216 44 4.9 62
Mar-10 179 57 3.1 57
Feb-10 168 26 6.5 77
Jan-10 148 21 7.0 112
Dec-09 130 12 10.8 42
Nov-09 148 24 6.2 66
Oct-09 158 54 2.9 59
Sep-09 180 39 4.6 72
Aug-09 188 41 4.6 66
Jul-09 187 40 4.7 54
Jun-09 189 47 4.0 54
May-09 185 44 4.2 50
Apr-09 162 43 3.8 60
Mar-09 157 34 4.6 45
Feb-09 145 25 5.8 71
Jan-09 143 23 6.2 55
Dec-08 137 15 9.1 85
Clarus MarketMetrics® 2 of 2 01/18/2011
Information not guaranteed. © 2009-2010 Terradatum and its suppliers and licensors (www.terradatum.com/about/licensors.td).
www.TaylorRealEstateAustin.com | www.EarlyBirdAustin.com | Direct: 512.796.4447 | Fax: 512.628.7720 | 1701 Spyglass Dr. Ste. 8 Austin, TX 78746
20 of 20