Contenu connexe
Similaire à Dt, downtown austin metrics (11)
Dt, downtown austin metrics
- 1. Blake Taylor Taylor Real Estate
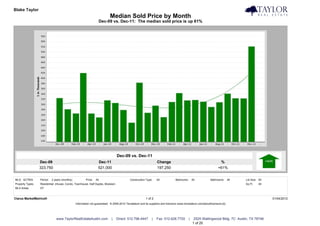
Median Sold Price by Month
Dec-09 vs. Dec-11: The median sold price is up 61%
Dec-09 vs. Dec-11
Dec-09 Dec-11 Change %
323,750 521,000 197,250 +61%
MLS: ACTRIS Period: 2 years (monthly) Price: All Construction Type: All Bedrooms: All Bathrooms: All Lot Size: All
Property Types: Residential: (House, Condo, Townhouse, Half Duplex, Modular) Sq Ft: All
MLS Areas: DT
Clarus MarketMetrics® 1 of 2 01/04/2012
Information not guaranteed. © 2009-2010 Terradatum and its suppliers and licensors (www.terradatum.com/about/licensors.td).
www.TaylorRealEstateAustin.com | Direct: 512.796.4447 | Fax: 512.628.7720 | 2525 Wallingwood Bldg. 7C Austin, TX 78746
1 of 20
- 2. Blake Taylor Taylor Real Estate
Median Sold Price by Month
Dec-09 vs. Dec-11: The median sold price is up 61%
Time Period Median Price # Units Average DOM
Dec-11 521,000 16 97
Nov-11 322,500 9 88
Oct-11 323,000 15 66
Sep-11 341,000 16 76
Aug-11 307,850 22 86
Jul-11 290,000 25 77
Jun-11 310,000 29 55
May-11 316,500 26 56
Apr-11 315,000 21 104
Mar-11 343,000 16 99
Feb-11 308,803 16 138
Jan-11 251,000 7 128
Dec-10 295,000 20 103
Nov-10 267,500 12 119
Oct-10 382,500 8 74
Sep-10 229,890 13 106
Aug-10 278,450 16 57
Jul-10 305,092 15 70
Jun-10 315,196 18 100
May-10 250,000 25 115
Apr-10 264,800 15 114
Mar-10 419,450 20 122
Feb-10 265,000 9 50
Jan-10 281,140 6 127
Dec-09 323,750 8 59
Clarus MarketMetrics® 2 of 2 01/04/2012
Information not guaranteed. © 2009-2010 Terradatum and its suppliers and licensors (www.terradatum.com/about/licensors.td).
www.TaylorRealEstateAustin.com | Direct: 512.796.4447 | Fax: 512.628.7720 | 2525 Wallingwood Bldg. 7C Austin, TX 78746
2 of 20
- 3. Blake Taylor Taylor Real Estate
Median For Sale vs. Median Sold
Dec-09 vs. Dec-11: The median price of for sale properties is up 16% and the median price of sold properties is up 61%
Dec-09 vs. Dec-11 Dec-09 vs. Dec-11
Dec-09 Dec-11 Change % Dec-09 Dec-11 Change %
385,000 445,000 60,000 +16% 323,750 521,000 197,250 +61%
MLS: ACTRIS Period: 2 years (monthly) Price: All Construction Type: All Bedrooms: All Bathrooms: All Lot Size: All
Property Types: Residential: (House, Condo, Townhouse, Half Duplex, Modular) Sq Ft: All
MLS Areas: DT
Clarus MarketMetrics® 1 of 2 01/04/2012
Information not guaranteed. © 2009-2010 Terradatum and its suppliers and licensors (www.terradatum.com/about/licensors.td).
www.TaylorRealEstateAustin.com | Direct: 512.796.4447 | Fax: 512.628.7720 | 2525 Wallingwood Bldg. 7C Austin, TX 78746
3 of 20
- 4. Blake Taylor Taylor Real Estate
Median For Sale vs. Median Sold
Dec-09 vs. Dec-11: The median price of for sale properties is up 16% and the median price of sold properties is up 61%
For Sale # Properties Sold # Properties Price
Time Period Median For Sale Median Sold Difference
Dec-11 445,000 103 521,000 16 76,000
Nov-11 423,500 112 322,500 9 -101,000
Oct-11 409,000 125 323,000 15 -86,000
Sep-11 410,950 132 341,000 16 -69,950
Aug-11 414,000 145 307,850 22 -106,151
Jul-11 414,000 165 290,000 25 -124,000
Jun-11 369,900 165 310,000 29 -59,900
May-11 359,800 169 316,500 26 -43,300
Apr-11 349,900 154 315,000 21 -34,900
Mar-11 349,450 158 343,000 16 -6,450
Feb-11 375,000 137 308,803 16 -66,197
Jan-11 349,500 128 251,000 7 -98,500
Dec-10 366,500 146 295,000 20 -71,500
Nov-10 368,000 169 267,500 12 -100,500
Oct-10 352,200 188 382,500 8 30,300
Sep-10 325,950 206 229,890 13 -96,060
Aug-10 325,000 206 278,450 16 -46,550
Jul-10 325,000 225 305,092 15 -19,908
Jun-10 319,945 244 315,196 18 -4,749
May-10 325,000 220 250,000 25 -75,000
Apr-10 325,000 253 264,800 15 -60,200
Mar-10 354,450 244 419,450 20 65,000
Feb-10 365,000 229 265,000 9 -100,000
Jan-10 361,750 218 281,140 6 -80,610
Dec-09 385,000 217 323,750 8 -61,250
Clarus MarketMetrics® 2 of 2 01/04/2012
Information not guaranteed. © 2009-2010 Terradatum and its suppliers and licensors (www.terradatum.com/about/licensors.td).
www.TaylorRealEstateAustin.com | Direct: 512.796.4447 | Fax: 512.628.7720 | 2525 Wallingwood Bldg. 7C Austin, TX 78746
4 of 20
- 5. Blake Taylor Taylor Real Estate
Sold Properties by Month
Dec-09 vs. Dec-11: The number of Sold properties is up 100%
Dec-09 vs. Dec-11
Dec-09 Dec-11 Change %
8 16 8 +100%
MLS: ACTRIS Period: 2 years (monthly) Price: All Construction Type: All Bedrooms: All Bathrooms: All Lot Size: All
Property Types: Residential: (House, Condo, Townhouse, Half Duplex, Modular) Sq Ft: All
MLS Areas: DT
Clarus MarketMetrics® 1 of 2 01/04/2012
Information not guaranteed. © 2009-2010 Terradatum and its suppliers and licensors (www.terradatum.com/about/licensors.td).
www.TaylorRealEstateAustin.com | Direct: 512.796.4447 | Fax: 512.628.7720 | 2525 Wallingwood Bldg. 7C Austin, TX 78746
5 of 20
- 6. Blake Taylor Taylor Real Estate
Sold Properties by Month
Dec-09 vs. Dec-11: The number of Sold properties is up 100%
Full Market Bank Properties Non-Bank Properties
Time Period # Properties Median Price Average DOM # Properties % Bank Median Price # Properties % Non-Bank Median Price
Dec-11 16 521,000 97 0 16 100.0 521,000
Nov-11 9 322,500 88 0 9 100.0 322,500
Oct-11 15 323,000 66 0 15 100.0 323,000
Sep-11 16 341,000 76 0 16 100.0 341,000
Aug-11 22 307,850 86 2 9.1 257,850 20 90.9 309,750
Jul-11 25 290,000 77 1 4.0 253,700 24 96.0 290,000
Jun-11 29 310,000 55 4 13.8 254,500 25 86.2 325,000
May-11 26 316,500 56 1 3.9 310,000 25 96.2 318,000
Apr-11 21 315,000 104 3 14.3 275,000 18 85.7 342,500
Mar-11 16 343,000 99 2 12.5 180,750 14 87.5 369,250
Feb-11 16 308,803 138 0 16 100.0 308,803
Jan-11 7 251,000 128 2 28.6 180,450 5 71.4 280,500
Dec-10 20 295,000 103 1 5.0 180,200 19 95.0 300,000
Nov-10 12 267,500 119 0 12 100.0 267,500
Oct-10 8 382,500 74 0 8 100.0 382,500
Sep-10 13 229,890 106 2 15.4 158,076 11 84.6 235,000
Aug-10 16 278,450 57 1 6.2 310,000 15 93.8 274,900
Jul-10 15 305,092 70 0 15 100.0 305,092
Jun-10 18 315,196 100 2 11.1 298,000 16 88.9 315,196
May-10 25 250,000 115 1 4.0 187,000 24 96.0 259,000
Apr-10 15 264,800 114 1 6.7 101,000 14 93.3 277,400
Mar-10 20 419,450 122 2 10.0 201,750 18 90.0 445,000
Feb-10 9 265,000 50 0 9 100.0 265,000
Jan-10 6 281,140 127 1 16.7 266,000 5 83.3 296,280
Dec-09 8 323,750 59 0 8 100.0 323,750
Clarus MarketMetrics® 2 of 2 01/04/2012
Information not guaranteed. © 2009-2010 Terradatum and its suppliers and licensors (www.terradatum.com/about/licensors.td).
www.TaylorRealEstateAustin.com | Direct: 512.796.4447 | Fax: 512.628.7720 | 2525 Wallingwood Bldg. 7C Austin, TX 78746
6 of 20
- 7. Blake Taylor Taylor Real Estate
Under Contract Properties by Month
Dec-09 vs. Dec-11: The number of Under Contract properties is up 220%
Dec-09 vs. Dec-11
Dec-09 Dec-11 Change %
5 16 11 +220%
MLS: ACTRIS Period: 2 years (monthly) Price: All Construction Type: All Bedrooms: All Bathrooms: All Lot Size: All
Property Types: Residential: (House, Condo, Townhouse, Half Duplex, Modular) Sq Ft: All
MLS Areas: DT
Clarus MarketMetrics® 1 of 2 01/04/2012
Information not guaranteed. © 2009-2010 Terradatum and its suppliers and licensors (www.terradatum.com/about/licensors.td).
www.TaylorRealEstateAustin.com | Direct: 512.796.4447 | Fax: 512.628.7720 | 2525 Wallingwood Bldg. 7C Austin, TX 78746
7 of 20
- 8. Blake Taylor Taylor Real Estate
Under Contract Properties by Month
Dec-09 vs. Dec-11: The number of Under Contract properties is up 220%
Full Market Bank Properties Non-Bank Properties
Time Period # Properties Median Price Average DOM # Properties % Bank Median Price # Properties % Non-Bank Median Price
Dec-11 16 362,000 95 0 16 100.0 362,000
Nov-11 11 499,000 92 0 11 100.0 499,000
Oct-11 14 372,000 64 0 14 100.0 372,000
Sep-11 14 376,000 85 0 14 100.0 376,000
Aug-11 16 264,825 72 0 16 100.0 264,825
Jul-11 23 369,000 77 1 4.3 174,900 22 95.7 393,750
Jun-11 24 324,950 56 2 8.3 300,000 22 91.7 325,000
May-11 24 311,500 63 3 12.5 249,900 21 87.5 325,000
Apr-11 24 310,900 52 3 12.5 259,900 21 87.5 319,900
Mar-11 25 310,000 87 3 12.0 185,500 22 88.0 317,500
Feb-11 14 455,000 119 1 7.1 287,500 13 92.9 475,000
Jan-11 10 369,000 98 0 10 100.0 369,000
Dec-10 17 299,000 153 0 17 100.0 299,000
Nov-10 12 352,000 104 1 8.3 169,900 11 91.7 385,000
Oct-10 13 275,000 123 0 13 100.0 275,000
Sep-10 9 275,000 71 3 33.3 179,900 6 66.7 312,250
Aug-10 15 295,000 68 1 6.7 332,500 14 93.3 292,450
Jul-10 16 288,700 87 0 16 100.0 288,700
Jun-10 25 274,800 93 2 8.0 145,200 23 92.0 275,000
May-10 10 499,750 118 0 10 100.0 499,750
Apr-10 29 275,000 114 1 3.5 184,900 28 96.5 277,450
Mar-10 20 344,950 121 1 5.0 531,900 19 95.0 339,900
Feb-10 18 272,000 86 1 5.6 180,000 17 94.4 275,000
Jan-10 8 305,000 59 2 25.0 192,450 6 75.0 330,000
Dec-09 5 249,900 112 0 5 100.0 249,900
Clarus MarketMetrics® 2 of 2 01/04/2012
Information not guaranteed. © 2009-2010 Terradatum and its suppliers and licensors (www.terradatum.com/about/licensors.td).
www.TaylorRealEstateAustin.com | Direct: 512.796.4447 | Fax: 512.628.7720 | 2525 Wallingwood Bldg. 7C Austin, TX 78746
8 of 20
- 9. Blake Taylor Taylor Real Estate
New Properties by Month
Dec-09 vs. Dec-11: The number of New properties is down 31%
Dec-09 vs. Dec-11
Dec-09 Dec-11 Change %
26 18 -8 -31%
MLS: ACTRIS Period: 2 years (monthly) Price: All Construction Type: All Bedrooms: All Bathrooms: All Lot Size: All
Property Types: Residential: (House, Condo, Townhouse, Half Duplex, Modular) Sq Ft: All
MLS Areas: DT
Clarus MarketMetrics® 1 of 2 01/04/2012
Information not guaranteed. © 2009-2010 Terradatum and its suppliers and licensors (www.terradatum.com/about/licensors.td).
www.TaylorRealEstateAustin.com | Direct: 512.796.4447 | Fax: 512.628.7720 | 2525 Wallingwood Bldg. 7C Austin, TX 78746
9 of 20
- 10. Blake Taylor Taylor Real Estate
New Properties by Month
Dec-09 vs. Dec-11: The number of New properties is down 31%
Full Market Bank Properties Non-Bank Properties
Time Period # Properties Median Price # Properties % Bank Median Price # Properties % Non-Bank Median Price
Dec-11 18 550,000 0 18 100.0 550,000
Nov-11 16 349,950 1 6.2 285,000 15 93.8 390,000
Oct-11 27 399,000 0 27 100.0 399,000
Sep-11 20 336,500 0 20 100.0 336,500
Aug-11 26 327,500 0 26 100.0 327,500
Jul-11 40 405,950 0 40 100.0 405,950
Jun-11 41 405,000 3 7.3 295,000 38 92.7 417,000
May-11 55 369,900 0 55 100.0 369,900
Apr-11 36 339,925 1 2.8 253,500 35 97.2 339,950
Mar-11 52 323,875 5 9.6 259,900 47 90.4 325,000
Feb-11 32 434,900 2 6.2 268,700 30 93.8 442,500
Jan-11 28 335,000 1 3.6 249,900 27 96.4 335,000
Dec-10 16 362,000 0 16 100.0 362,000
Nov-10 17 339,000 0 17 100.0 339,000
Oct-10 26 366,500 0 26 100.0 366,500
Sep-10 27 379,900 1 3.7 169,900 26 96.3 389,450
Aug-10 30 368,500 2 6.7 256,200 28 93.3 369,450
Jul-10 41 325,000 1 2.4 189,900 40 97.6 325,000
Jun-10 63 289,900 2 3.2 154,900 61 96.8 299,000
May-10 43 349,900 1 2.3 332,500 42 97.7 352,400
Apr-10 50 262,500 0 50 100.0 262,500
Mar-10 46 312,450 2 4.3 191,950 44 95.7 322,450
Feb-10 41 339,900 0 41 100.0 339,900
Jan-10 40 303,450 0 40 100.0 303,450
Dec-09 26 327,500 1 3.9 99,900 25 96.2 330,000
Clarus MarketMetrics® 2 of 2 01/04/2012
Information not guaranteed. © 2009-2010 Terradatum and its suppliers and licensors (www.terradatum.com/about/licensors.td).
www.TaylorRealEstateAustin.com | Direct: 512.796.4447 | Fax: 512.628.7720 | 2525 Wallingwood Bldg. 7C Austin, TX 78746
10 of 20
- 11. Blake Taylor Taylor Real Estate
For Sale Properties by Month
Dec-09 vs. Dec-11: The number of For Sale properties is down 53%
Dec-09 vs. Dec-11
Dec-09 Dec-11 Change %
217 103 -114 -53%
MLS: ACTRIS Period: 2 years (monthly) Price: All Construction Type: All Bedrooms: All Bathrooms: All Lot Size: All
Property Types: Residential: (House, Condo, Townhouse, Half Duplex, Modular) Sq Ft: All
MLS Areas: DT
Clarus MarketMetrics® 1 of 2 01/04/2012
Information not guaranteed. © 2009-2010 Terradatum and its suppliers and licensors (www.terradatum.com/about/licensors.td).
www.TaylorRealEstateAustin.com | Direct: 512.796.4447 | Fax: 512.628.7720 | 2525 Wallingwood Bldg. 7C Austin, TX 78746
11 of 20
- 12. Blake Taylor Taylor Real Estate
For Sale Properties by Month
Dec-09 vs. Dec-11: The number of For Sale properties is down 53%
Full Market Bank Properties Non-Bank Properties
Time Period # Properties Median Price Average DOM # Properties % Bank Median Price # Properties % Non-Bank Median Price
Dec-11 103 445,000 116 1 1.0 285,000 102 99.0 447,450
Nov-11 112 423,500 112 1 0.9 285,000 111 99.1 432,000
Oct-11 125 409,000 101 0 125 100.0 409,000
Sep-11 132 410,950 101 0 132 100.0 410,950
Aug-11 145 414,000 98 0 145 100.0 414,000
Jul-11 165 414,000 89 1 0.6 174,900 164 99.4 414,500
Jun-11 165 369,900 88 3 1.8 295,000 162 98.2 372,450
May-11 169 359,800 86 3 1.8 249,900 166 98.2 359,900
Apr-11 154 349,900 93 6 3.9 251,700 148 96.1 350,000
Mar-11 158 349,450 94 8 5.1 249,900 150 94.9 350,000
Feb-11 137 375,000 119 4 2.9 249,900 133 97.1 375,000
Jan-11 128 349,500 132 3 2.3 199,000 125 97.7 354,900
Dec-10 146 366,500 146 2 1.4 189,450 144 98.6 368,000
Nov-10 169 368,000 137 3 1.8 179,900 166 98.2 368,425
Oct-10 188 352,200 130 3 1.6 179,900 185 98.4 365,000
Sep-10 206 325,950 124 6 2.9 179,900 200 97.1 337,450
Aug-10 206 325,000 115 7 3.4 189,900 199 96.6 326,900
Jul-10 225 325,000 105 5 2.2 189,900 220 97.8 325,000
Jun-10 244 319,945 98 6 2.5 185,200 238 97.5 322,450
May-10 220 325,000 107 5 2.3 199,000 215 97.7 325,000
Apr-10 253 325,000 176 5 2.0 190,500 248 98.0 329,750
Mar-10 244 354,450 179 6 2.5 194,750 238 97.5 361,750
Feb-10 229 365,000 179 5 2.2 190,500 224 97.8 369,450
Jan-10 218 361,750 188 7 3.2 190,500 211 96.8 375,000
Dec-09 217 385,000 193 7 3.2 190,500 210 96.8 396,250
Clarus MarketMetrics® 2 of 2 01/04/2012
Information not guaranteed. © 2009-2010 Terradatum and its suppliers and licensors (www.terradatum.com/about/licensors.td).
www.TaylorRealEstateAustin.com | Direct: 512.796.4447 | Fax: 512.628.7720 | 2525 Wallingwood Bldg. 7C Austin, TX 78746
12 of 20
- 13. Blake Taylor Taylor Real Estate
Expired Properties by Month
Dec-09 vs. Dec-11: The number of Expired properties is down 59%
Dec-09 vs. Dec-11
Dec-09 Dec-11 Change %
34 14 -20 -59%
MLS: ACTRIS Period: 2 years (monthly) Price: All Construction Type: All Bedrooms: All Bathrooms: All Lot Size: All
Property Types: Residential: (House, Condo, Townhouse, Half Duplex, Modular) Sq Ft: All
MLS Areas: DT
Clarus MarketMetrics® 1 of 2 01/04/2012
Information not guaranteed. © 2009-2010 Terradatum and its suppliers and licensors (www.terradatum.com/about/licensors.td).
www.TaylorRealEstateAustin.com | Direct: 512.796.4447 | Fax: 512.628.7720 | 2525 Wallingwood Bldg. 7C Austin, TX 78746
13 of 20
- 14. Blake Taylor Taylor Real Estate
Expired Properties by Month
Dec-09 vs. Dec-11: The number of Expired properties is down 59%
Full Market Bank Properties Non-Bank Properties
Time Period # Properties Median Price Average DOM # Properties % Bank Median Price # Properties % Non-Bank Median Price
Dec-11 14 682,500 150 0 14 100.0 682,500
Nov-11 16 420,950 139 0 16 100.0 420,950
Oct-11 15 345,000 118 0 15 100.0 345,000
Sep-11 20 355,200 133 0 20 100.0 355,200
Aug-11 17 559,900 166 0 17 100.0 559,900
Jul-11 23 359,900 91 0 23 100.0 359,900
Jun-11 16 367,300 143 0 16 100.0 367,300
May-11 21 391,000 109 0 21 100.0 391,000
Apr-11 16 371,925 131 0 16 100.0 371,925
Mar-11 15 349,000 107 0 15 100.0 349,000
Feb-11 17 325,000 185 0 17 100.0 325,000
Jan-11 13 325,000 167 1 7.7 199,000 12 92.3 327,250
Dec-10 29 425,000 164 0 29 100.0 425,000
Nov-10 27 369,000 150 0 27 100.0 369,000
Oct-10 23 325,000 157 0 23 100.0 325,000
Sep-10 35 320,000 138 0 35 100.0 320,000
Aug-10 12 333,750 184 1 8.3 332,500 11 91.7 335,000
Jul-10 33 349,777 119 0 33 100.0 349,777
Jun-10 35 430,000 125 0 35 100.0 430,000
May-10 29 315,000 122 1 3.5 220,000 28 96.5 322,500
Apr-10 47 485,000 336 0 47 100.0 485,000
Mar-10 21 449,900 120 0 21 100.0 449,900
Feb-10 13 405,000 135 0 13 100.0 405,000
Jan-10 22 329,450 159 0 22 100.0 329,450
Dec-09 34 372,450 160 0 34 100.0 372,450
Clarus MarketMetrics® 2 of 2 01/04/2012
Information not guaranteed. © 2009-2010 Terradatum and its suppliers and licensors (www.terradatum.com/about/licensors.td).
www.TaylorRealEstateAustin.com | Direct: 512.796.4447 | Fax: 512.628.7720 | 2525 Wallingwood Bldg. 7C Austin, TX 78746
14 of 20
- 15. Blake Taylor Taylor Real Estate
Supply & Demand by Month
Dec-09 vs. Dec-11: The number of for sale properties is down 53% and the number of sold properties is up 100%
Dec-09 vs. Dec-11 Dec-09 vs. Dec-11
Dec-09 Dec-11 Change % Dec-09 Dec-11 Change %
217 103 -114 -53% 8 16 8 +100%
MLS: ACTRIS Period: 2 years (monthly) Price: All Construction Type: All Bedrooms: All Bathrooms: All Lot Size: All
Property Types: Residential: (House, Condo, Townhouse, Half Duplex, Modular) Sq Ft: All
MLS Areas: DT
Clarus MarketMetrics® 1 of 2 01/04/2012
Information not guaranteed. © 2009-2010 Terradatum and its suppliers and licensors (www.terradatum.com/about/licensors.td).
www.TaylorRealEstateAustin.com | Direct: 512.796.4447 | Fax: 512.628.7720 | 2525 Wallingwood Bldg. 7C Austin, TX 78746
15 of 20
- 16. Blake Taylor Taylor Real Estate
Supply & Demand by Month
Dec-09 vs. Dec-11: The number of for sale properties is down 53% and the number of sold properties is up 100%
# Properties Average DOM # Properties Average DOM
Time Period For Sale For Sale Sold Sold
Dec-11 103 116 16 97
Nov-11 112 112 9 88
Oct-11 125 101 15 66
Sep-11 132 101 16 76
Aug-11 145 98 22 86
Jul-11 165 89 25 77
Jun-11 165 88 29 55
May-11 169 86 26 56
Apr-11 154 93 21 104
Mar-11 158 94 16 99
Feb-11 137 119 16 138
Jan-11 128 132 7 128
Dec-10 146 146 20 103
Nov-10 169 137 12 119
Oct-10 188 130 8 74
Sep-10 206 124 13 106
Aug-10 206 115 16 57
Jul-10 225 105 15 70
Jun-10 244 98 18 100
May-10 220 107 25 115
Apr-10 253 176 15 114
Mar-10 244 179 20 122
Feb-10 229 179 9 50
Jan-10 218 188 6 127
Dec-09 217 193 8 59
Clarus MarketMetrics® 2 of 2 01/04/2012
Information not guaranteed. © 2009-2010 Terradatum and its suppliers and licensors (www.terradatum.com/about/licensors.td).
www.TaylorRealEstateAustin.com | Direct: 512.796.4447 | Fax: 512.628.7720 | 2525 Wallingwood Bldg. 7C Austin, TX 78746
16 of 20
- 17. Blake Taylor Taylor Real Estate
The Average Days on Market by Month
Dec-09 vs. Dec-11: The average days on market is down 15%
Dec-09 vs. Dec-11
Dec-09 Dec-11 Change %
112 95 -17 -15%
MLS: ACTRIS Period: 2 years (monthly) Price: All Construction Type: All Bedrooms: All Bathrooms: All Lot Size: All
Property Types: Residential: (House, Condo, Townhouse, Half Duplex, Modular) Sq Ft: All
MLS Areas: DT
Clarus MarketMetrics® 1 of 2 01/04/2012
Information not guaranteed. © 2009-2010 Terradatum and its suppliers and licensors (www.terradatum.com/about/licensors.td).
www.TaylorRealEstateAustin.com | Direct: 512.796.4447 | Fax: 512.628.7720 | 2525 Wallingwood Bldg. 7C Austin, TX 78746
17 of 20
- 18. Blake Taylor Taylor Real Estate
The Average Days on Market by Month
Dec-09 vs. Dec-11: The average days on market is down 15%
Time Period Average DOM # UC Units
Dec-11 95 16
Nov-11 92 11
Oct-11 64 14
Sep-11 85 14
Aug-11 72 16
Jul-11 77 23
Jun-11 56 24
May-11 63 24
Apr-11 52 24
Mar-11 87 25
Feb-11 119 14
Jan-11 98 10
Dec-10 153 17
Nov-10 104 12
Oct-10 123 13
Sep-10 71 9
Aug-10 68 15
Jul-10 87 16
Jun-10 93 25
May-10 118 10
Apr-10 114 29
Mar-10 121 20
Feb-10 86 18
Jan-10 59 8
Dec-09 112 5
Clarus MarketMetrics® 2 of 2 01/04/2012
Information not guaranteed. © 2009-2010 Terradatum and its suppliers and licensors (www.terradatum.com/about/licensors.td).
www.TaylorRealEstateAustin.com | Direct: 512.796.4447 | Fax: 512.628.7720 | 2525 Wallingwood Bldg. 7C Austin, TX 78746
18 of 20
- 19. Blake Taylor Taylor Real Estate
Months Supply of Inventory
Dec-09 vs. Dec-11: The average months supply of inventory is down 87%
Dec-09 vs. Dec-11
Dec-09 Dec-11 Change %
35.6 4.6 -31.0 -87%
MLS: ACTRIS Period: 2 years (monthly) Price: All Construction Type: All Bedrooms: All Bathrooms: All Lot Size: All
Property Types: Residential: (House, Condo, Townhouse, Half Duplex, Modular) Sq Ft: All
MLS Areas: DT
Clarus MarketMetrics® 1 of 2 01/04/2012
Information not guaranteed. © 2009-2010 Terradatum and its suppliers and licensors (www.terradatum.com/about/licensors.td).
www.TaylorRealEstateAustin.com | Direct: 512.796.4447 | Fax: 512.628.7720 | 2525 Wallingwood Bldg. 7C Austin, TX 78746
19 of 20
- 20. Blake Taylor Taylor Real Estate
Months Supply of Inventory
Dec-09 vs. Dec-11: The average months supply of inventory is down 87%
# Units For Sale # UC Units UC Average
Time Period Last Day of Month During Month MSI DOM
Dec-11 73 16 4.6 95
Nov-11 85 11 7.7 92
Oct-11 96 14 6.9 64
Sep-11 98 14 7.0 85
Aug-11 112 16 7.0 72
Jul-11 119 23 5.2 77
Jun-11 125 24 5.2 56
May-11 124 24 5.2 63
Apr-11 114 24 4.8 52
Mar-11 118 25 4.7 87
Feb-11 106 14 7.6 119
Jan-11 105 10 10.5 98
Dec-10 100 17 5.9 153
Nov-10 130 12 10.8 104
Oct-10 152 13 11.7 123
Sep-10 162 9 18.0 71
Aug-10 179 15 11.9 68
Jul-10 176 16 11.0 87
Jun-10 184 25 7.4 93
May-10 181 10 18.1 118
Apr-10 177 29 6.1 114
Mar-10 203 20 10.2 121
Feb-10 198 18 11.0 86
Jan-10 188 8 23.5 59
Dec-09 178 5 35.6 112
Clarus MarketMetrics® 2 of 2 01/04/2012
Information not guaranteed. © 2009-2010 Terradatum and its suppliers and licensors (www.terradatum.com/about/licensors.td).
www.TaylorRealEstateAustin.com | Direct: 512.796.4447 | Fax: 512.628.7720 | 2525 Wallingwood Bldg. 7C Austin, TX 78746
20 of 20