Contenu connexe
Similaire à Sww, circle c, western oaks, meridian, avana
Similaire à Sww, circle c, western oaks, meridian, avana (15)
Sww, circle c, western oaks, meridian, avana
- 1. Blake Taylor Taylor Real Estate
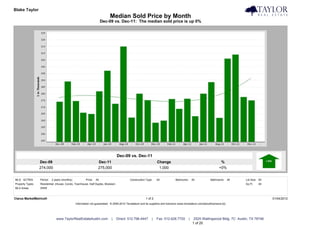
Median Sold Price by Month
Dec-09 vs. Dec-11: The median sold price is up 0%
Dec-09 vs. Dec-11
Dec-09 Dec-11 Change %
274,000 275,000 1,000 +0%
MLS: ACTRIS Period: 2 years (monthly) Price: All Construction Type: All Bedrooms: All Bathrooms: All Lot Size: All
Property Types: Residential: (House, Condo, Townhouse, Half Duplex, Modular) Sq Ft: All
MLS Areas: SWW
Clarus MarketMetrics® 1 of 2 01/04/2012
Information not guaranteed. © 2009-2010 Terradatum and its suppliers and licensors (www.terradatum.com/about/licensors.td).
www.TaylorRealEstateAustin.com | Direct: 512.796.4447 | Fax: 512.628.7720 | 2525 Wallingwood Bldg. 7C Austin, TX 78746
1 of 20
- 2. Blake Taylor Taylor Real Estate
Median Sold Price by Month
Dec-09 vs. Dec-11: The median sold price is up 0%
Time Period Median Price # Units Average DOM
Dec-11 275,000 50 62
Nov-11 277,500 41 48
Oct-11 309,000 38 47
Sep-11 306,000 49 58
Aug-11 262,000 59 48
Jul-11 288,500 63 45
Jun-11 280,000 63 53
May-11 263,250 64 33
Apr-11 276,200 56 37
Mar-11 268,733 50 60
Feb-11 276,000 31 78
Jan-11 260,000 38 68
Dec-10 258,450 44 56
Nov-10 275,000 35 78
Oct-10 280,000 39 83
Sep-10 262,250 40 65
Aug-10 315,000 39 60
Jul-10 272,500 58 42
Jun-10 297,000 61 41
May-10 281,750 84 38
Apr-10 264,900 61 37
Mar-10 265,850 48 44
Feb-10 274,500 40 56
Jan-10 289,000 15 89
Dec-09 274,000 45 88
Clarus MarketMetrics® 2 of 2 01/04/2012
Information not guaranteed. © 2009-2010 Terradatum and its suppliers and licensors (www.terradatum.com/about/licensors.td).
www.TaylorRealEstateAustin.com | Direct: 512.796.4447 | Fax: 512.628.7720 | 2525 Wallingwood Bldg. 7C Austin, TX 78746
2 of 20
- 3. Blake Taylor Taylor Real Estate
Median For Sale vs. Median Sold
Dec-09 vs. Dec-11: The median price of for sale properties is down 0% and the median price of sold properties is up 0%
Dec-09 vs. Dec-11 Dec-09 vs. Dec-11
Dec-09 Dec-11 Change % Dec-09 Dec-11 Change %
299,945 299,000 -945 -0% 274,000 275,000 1,000 +0%
MLS: ACTRIS Period: 2 years (monthly) Price: All Construction Type: All Bedrooms: All Bathrooms: All Lot Size: All
Property Types: Residential: (House, Condo, Townhouse, Half Duplex, Modular) Sq Ft: All
MLS Areas: SWW
Clarus MarketMetrics® 1 of 2 01/04/2012
Information not guaranteed. © 2009-2010 Terradatum and its suppliers and licensors (www.terradatum.com/about/licensors.td).
www.TaylorRealEstateAustin.com | Direct: 512.796.4447 | Fax: 512.628.7720 | 2525 Wallingwood Bldg. 7C Austin, TX 78746
3 of 20
- 4. Blake Taylor Taylor Real Estate
Median For Sale vs. Median Sold
Dec-09 vs. Dec-11: The median price of for sale properties is down 0% and the median price of sold properties is up 0%
For Sale # Properties Sold # Properties Price
Time Period Median For Sale Median Sold Difference
Dec-11 299,000 105 275,000 50 -24,000
Nov-11 299,000 144 277,500 41 -21,500
Oct-11 286,000 161 309,000 38 23,000
Sep-11 286,000 173 306,000 49 20,000
Aug-11 292,466 200 262,000 59 -30,466
Jul-11 279,900 217 288,500 63 8,600
Jun-11 289,252 240 280,000 63 -9,252
May-11 285,000 243 263,250 64 -21,750
Apr-11 295,625 234 276,200 56 -19,425
Mar-11 289,950 214 268,733 50 -21,216
Feb-11 285,000 184 276,000 31 -9,000
Jan-11 287,900 173 260,000 38 -27,900
Dec-10 279,900 184 258,450 44 -21,450
Nov-10 279,900 207 275,000 35 -4,900
Oct-10 294,500 230 280,000 39 -14,500
Sep-10 295,475 260 262,250 40 -33,225
Aug-10 289,250 288 315,000 39 25,750
Jul-10 299,900 312 272,500 58 -27,400
Jun-10 299,900 310 297,000 61 -2,900
May-10 300,000 296 281,750 84 -18,250
Apr-10 299,994 320 264,900 61 -35,094
Mar-10 299,995 262 265,850 48 -34,145
Feb-10 295,000 223 274,500 40 -20,500
Jan-10 292,250 190 289,000 15 -3,249
Dec-09 299,945 178 274,000 45 -25,945
Clarus MarketMetrics® 2 of 2 01/04/2012
Information not guaranteed. © 2009-2010 Terradatum and its suppliers and licensors (www.terradatum.com/about/licensors.td).
www.TaylorRealEstateAustin.com | Direct: 512.796.4447 | Fax: 512.628.7720 | 2525 Wallingwood Bldg. 7C Austin, TX 78746
4 of 20
- 5. Blake Taylor Taylor Real Estate
Sold Properties by Month
Dec-09 vs. Dec-11: The number of Sold properties is up 11%
Dec-09 vs. Dec-11
Dec-09 Dec-11 Change %
45 50 5 +11%
MLS: ACTRIS Period: 2 years (monthly) Price: All Construction Type: All Bedrooms: All Bathrooms: All Lot Size: All
Property Types: Residential: (House, Condo, Townhouse, Half Duplex, Modular) Sq Ft: All
MLS Areas: SWW
Clarus MarketMetrics® 1 of 2 01/04/2012
Information not guaranteed. © 2009-2010 Terradatum and its suppliers and licensors (www.terradatum.com/about/licensors.td).
www.TaylorRealEstateAustin.com | Direct: 512.796.4447 | Fax: 512.628.7720 | 2525 Wallingwood Bldg. 7C Austin, TX 78746
5 of 20
- 6. Blake Taylor Taylor Real Estate
Sold Properties by Month
Dec-09 vs. Dec-11: The number of Sold properties is up 11%
Full Market Bank Properties Non-Bank Properties
Time Period # Properties Median Price Average DOM # Properties % Bank Median Price # Properties % Non-Bank Median Price
Dec-11 50 275,000 62 5 10.0 280,000 45 90.0 275,000
Nov-11 41 277,500 48 0 41 100.0 277,500
Oct-11 38 309,000 47 1 2.6 205,000 37 97.4 310,000
Sep-11 49 306,000 58 1 2.0 315,500 48 98.0 300,500
Aug-11 59 262,000 48 0 59 100.0 262,000
Jul-11 63 288,500 45 2 3.2 338,000 61 96.8 288,500
Jun-11 63 280,000 53 2 3.2 222,500 61 96.8 280,000
May-11 64 263,250 33 6 9.4 271,500 58 90.6 263,250
Apr-11 56 276,200 37 2 3.6 272,750 54 96.4 276,200
Mar-11 50 268,733 60 1 2.0 267,466 49 98.0 270,000
Feb-11 31 276,000 78 3 9.7 330,000 28 90.3 268,000
Jan-11 38 260,000 68 1 2.6 220,000 37 97.4 265,000
Dec-10 44 258,450 56 0 44 100.0 258,450
Nov-10 35 275,000 78 1 2.9 253,000 34 97.1 275,500
Oct-10 39 280,000 83 0 39 100.0 280,000
Sep-10 40 262,250 65 2 5.0 282,500 38 95.0 262,250
Aug-10 39 315,000 60 1 2.6 500,000 38 97.4 310,000
Jul-10 58 272,500 42 0 58 100.0 272,500
Jun-10 61 297,000 41 1 1.6 425,000 60 98.4 295,500
May-10 84 281,750 38 2 2.4 246,375 82 97.6 281,750
Apr-10 61 264,900 37 1 1.6 311,000 60 98.4 264,600
Mar-10 48 265,850 44 1 2.1 245,000 47 97.9 267,500
Feb-10 40 274,500 56 1 2.5 352,900 39 97.5 274,000
Jan-10 15 289,000 89 0 15 100.0 289,000
Dec-09 45 274,000 88 5 11.1 290,000 40 88.9 273,550
Clarus MarketMetrics® 2 of 2 01/04/2012
Information not guaranteed. © 2009-2010 Terradatum and its suppliers and licensors (www.terradatum.com/about/licensors.td).
www.TaylorRealEstateAustin.com | Direct: 512.796.4447 | Fax: 512.628.7720 | 2525 Wallingwood Bldg. 7C Austin, TX 78746
6 of 20
- 7. Blake Taylor Taylor Real Estate
Under Contract Properties by Month
Dec-09 vs. Dec-11: The number of Under Contract properties is up 25%
Dec-09 vs. Dec-11
Dec-09 Dec-11 Change %
24 30 6 +25%
MLS: ACTRIS Period: 2 years (monthly) Price: All Construction Type: All Bedrooms: All Bathrooms: All Lot Size: All
Property Types: Residential: (House, Condo, Townhouse, Half Duplex, Modular) Sq Ft: All
MLS Areas: SWW
Clarus MarketMetrics® 1 of 2 01/04/2012
Information not guaranteed. © 2009-2010 Terradatum and its suppliers and licensors (www.terradatum.com/about/licensors.td).
www.TaylorRealEstateAustin.com | Direct: 512.796.4447 | Fax: 512.628.7720 | 2525 Wallingwood Bldg. 7C Austin, TX 78746
7 of 20
- 8. Blake Taylor Taylor Real Estate
Under Contract Properties by Month
Dec-09 vs. Dec-11: The number of Under Contract properties is up 25%
Full Market Bank Properties Non-Bank Properties
Time Period # Properties Median Price Average DOM # Properties % Bank Median Price # Properties % Non-Bank Median Price
Dec-11 30 272,000 51 1 3.3 298,000 29 96.7 269,000
Nov-11 49 299,000 61 5 10.2 265,000 44 89.8 299,450
Oct-11 43 279,000 47 1 2.3 279,900 42 97.7 277,000
Sep-11 38 297,000 55 0 38 100.0 297,000
Aug-11 51 312,000 59 1 2.0 319,000 50 98.0 310,000
Jul-11 60 269,942 41 1 1.7 224,500 59 98.3 269,983
Jun-11 59 299,000 50 2 3.4 349,900 57 96.6 299,000
May-11 67 274,900 51 2 3.0 199,950 65 97.0 274,975
Apr-11 56 280,450 29 4 7.1 272,950 52 92.9 289,500
Mar-11 68 269,942 40 3 4.4 269,900 65 95.6 269,983
Feb-11 45 269,900 62 3 6.7 276,900 42 93.3 264,500
Jan-11 33 284,900 67 2 6.1 347,450 31 93.9 284,900
Dec-10 38 274,975 75 1 2.6 234,900 37 97.4 275,000
Nov-10 37 265,000 53 0 37 100.0 265,000
Oct-10 37 283,000 74 0 37 100.0 283,000
Sep-10 45 269,000 87 2 4.4 234,950 43 95.6 269,900
Aug-10 38 289,900 67 2 5.3 452,500 36 94.7 279,900
Jul-10 44 295,992 52 0 44 100.0 295,992
Jun-10 59 275,900 42 0 59 100.0 275,900
May-10 52 299,000 42 1 1.9 383,675 51 98.1 299,000
Apr-10 81 285,000 34 1 1.2 339,900 80 98.8 282,950
Mar-10 62 264,950 43 2 3.2 231,700 60 96.8 264,950
Feb-10 43 254,900 42 1 2.3 241,900 42 97.7 254,932
Jan-10 44 296,750 43 1 2.3 352,900 43 97.7 296,000
Dec-09 24 279,000 118 1 4.2 299,900 23 95.8 259,000
Clarus MarketMetrics® 2 of 2 01/04/2012
Information not guaranteed. © 2009-2010 Terradatum and its suppliers and licensors (www.terradatum.com/about/licensors.td).
www.TaylorRealEstateAustin.com | Direct: 512.796.4447 | Fax: 512.628.7720 | 2525 Wallingwood Bldg. 7C Austin, TX 78746
8 of 20
- 9. Blake Taylor Taylor Real Estate
New Properties by Month
Dec-09 vs. Dec-11: The number of New properties is down 37%
Dec-09 vs. Dec-11
Dec-09 Dec-11 Change %
41 26 -15 -37%
MLS: ACTRIS Period: 2 years (monthly) Price: All Construction Type: All Bedrooms: All Bathrooms: All Lot Size: All
Property Types: Residential: (House, Condo, Townhouse, Half Duplex, Modular) Sq Ft: All
MLS Areas: SWW
Clarus MarketMetrics® 1 of 2 01/04/2012
Information not guaranteed. © 2009-2010 Terradatum and its suppliers and licensors (www.terradatum.com/about/licensors.td).
www.TaylorRealEstateAustin.com | Direct: 512.796.4447 | Fax: 512.628.7720 | 2525 Wallingwood Bldg. 7C Austin, TX 78746
9 of 20
- 10. Blake Taylor Taylor Real Estate
New Properties by Month
Dec-09 vs. Dec-11: The number of New properties is down 37%
Full Market Bank Properties Non-Bank Properties
Time Period # Properties Median Price # Properties % Bank Median Price # Properties % Non-Bank Median Price
Dec-11 26 309,950 0 26 100.0 309,950
Nov-11 47 288,500 5 10.6 267,500 42 89.4 289,000
Oct-11 40 319,700 1 2.5 279,900 39 97.5 319,900
Sep-11 48 299,950 2 4.2 292,400 46 95.8 301,900
Aug-11 60 287,950 1 1.7 279,900 59 98.3 289,900
Jul-11 55 279,900 1 1.8 319,000 54 98.2 279,900
Jun-11 80 282,491 1 1.2 299,900 79 98.8 279,999
May-11 78 273,950 2 2.6 177,500 76 97.4 274,900
Apr-11 98 280,000 4 4.1 272,950 94 95.9 280,000
Mar-11 89 299,990 3 3.4 356,000 86 96.6 299,945
Feb-11 60 282,450 2 3.3 273,400 58 96.7 285,000
Jan-11 48 288,938 4 8.3 291,125 44 91.7 288,938
Dec-10 39 255,000 2 5.1 227,400 37 94.9 259,500
Nov-10 52 269,900 4 7.7 292,100 48 92.3 264,950
Oct-10 45 280,000 0 45 100.0 280,000
Sep-10 44 296,500 2 4.5 288,400 42 95.5 296,500
Aug-10 47 269,900 1 2.1 200,000 46 97.9 269,950
Jul-10 91 279,950 3 3.3 219,900 88 96.7 287,200
Jun-10 83 275,000 4 4.8 288,000 79 95.2 275,000
May-10 82 299,925 1 1.2 383,675 81 98.8 299,900
Apr-10 137 290,000 2 1.5 332,450 135 98.5 290,000
Mar-10 91 294,950 1 1.1 339,900 90 98.9 294,125
Feb-10 91 299,000 2 2.2 200,150 89 97.8 299,950
Jan-10 71 274,900 0 71 100.0 274,900
Dec-09 41 299,990 4 9.8 272,400 37 90.2 305,000
Clarus MarketMetrics® 2 of 2 01/04/2012
Information not guaranteed. © 2009-2010 Terradatum and its suppliers and licensors (www.terradatum.com/about/licensors.td).
www.TaylorRealEstateAustin.com | Direct: 512.796.4447 | Fax: 512.628.7720 | 2525 Wallingwood Bldg. 7C Austin, TX 78746
10 of 20
- 11. Blake Taylor Taylor Real Estate
For Sale Properties by Month
Dec-09 vs. Dec-11: The number of For Sale properties is down 41%
Dec-09 vs. Dec-11
Dec-09 Dec-11 Change %
178 105 -73 -41%
MLS: ACTRIS Period: 2 years (monthly) Price: All Construction Type: All Bedrooms: All Bathrooms: All Lot Size: All
Property Types: Residential: (House, Condo, Townhouse, Half Duplex, Modular) Sq Ft: All
MLS Areas: SWW
Clarus MarketMetrics® 1 of 2 01/04/2012
Information not guaranteed. © 2009-2010 Terradatum and its suppliers and licensors (www.terradatum.com/about/licensors.td).
www.TaylorRealEstateAustin.com | Direct: 512.796.4447 | Fax: 512.628.7720 | 2525 Wallingwood Bldg. 7C Austin, TX 78746
11 of 20
- 12. Blake Taylor Taylor Real Estate
For Sale Properties by Month
Dec-09 vs. Dec-11: The number of For Sale properties is down 41%
Full Market Bank Properties Non-Bank Properties
Time Period # Properties Median Price Average DOM # Properties % Bank Median Price # Properties % Non-Bank Median Price
Dec-11 105 299,000 87 3 2.9 298,000 102 97.1 299,500
Nov-11 144 299,000 80 8 5.6 276,200 136 94.4 299,450
Oct-11 161 286,000 84 4 2.5 282,400 157 97.5 289,000
Sep-11 173 286,000 85 3 1.7 284,900 170 98.3 286,250
Aug-11 200 292,466 83 3 1.5 279,900 197 98.5 294,983
Jul-11 217 279,900 78 3 1.4 224,500 214 98.6 279,948
Jun-11 240 289,252 72 5 2.1 294,900 235 97.9 288,505
May-11 243 285,000 74 7 2.9 244,900 236 97.1 286,000
Apr-11 234 295,625 66 9 3.9 280,900 225 96.2 299,000
Mar-11 214 289,950 71 8 3.7 279,600 206 96.3 292,500
Feb-11 184 285,000 86 9 4.9 276,900 175 95.1 285,000
Jan-11 173 287,900 96 10 5.8 292,100 163 94.2 286,900
Dec-10 184 279,900 99 7 3.8 289,300 177 96.2 279,900
Nov-10 207 279,900 90 6 2.9 292,100 201 97.1 279,900
Oct-10 230 294,500 97 7 3.0 250,000 223 97.0 295,950
Sep-10 260 295,475 96 11 4.2 250,000 249 95.8 299,000
Aug-10 288 289,250 90 13 4.5 244,900 275 95.5 295,000
Jul-10 312 299,900 80 13 4.2 244,900 299 95.8 299,950
Jun-10 310 299,900 75 10 3.2 250,000 300 96.8 299,900
May-10 296 300,000 67 7 2.4 250,000 289 97.6 300,000
Apr-10 320 299,994 60 8 2.5 294,950 312 97.5 299,994
Mar-10 262 299,995 68 8 3.0 277,500 254 97.0 299,995
Feb-10 223 295,000 67 8 3.6 247,450 215 96.4 298,900
Jan-10 190 292,250 77 7 3.7 305,000 183 96.3 289,999
Dec-09 178 299,945 97 8 4.5 302,450 170 95.5 299,945
Clarus MarketMetrics® 2 of 2 01/04/2012
Information not guaranteed. © 2009-2010 Terradatum and its suppliers and licensors (www.terradatum.com/about/licensors.td).
www.TaylorRealEstateAustin.com | Direct: 512.796.4447 | Fax: 512.628.7720 | 2525 Wallingwood Bldg. 7C Austin, TX 78746
12 of 20
- 13. Blake Taylor Taylor Real Estate
Expired Properties by Month
Dec-09 vs. Dec-11: The number of Expired properties is down 54%
Dec-09 vs. Dec-11
Dec-09 Dec-11 Change %
35 16 -19 -54%
MLS: ACTRIS Period: 2 years (monthly) Price: All Construction Type: All Bedrooms: All Bathrooms: All Lot Size: All
Property Types: Residential: (House, Condo, Townhouse, Half Duplex, Modular) Sq Ft: All
MLS Areas: SWW
Clarus MarketMetrics® 1 of 2 01/04/2012
Information not guaranteed. © 2009-2010 Terradatum and its suppliers and licensors (www.terradatum.com/about/licensors.td).
www.TaylorRealEstateAustin.com | Direct: 512.796.4447 | Fax: 512.628.7720 | 2525 Wallingwood Bldg. 7C Austin, TX 78746
13 of 20
- 14. Blake Taylor Taylor Real Estate
Expired Properties by Month
Dec-09 vs. Dec-11: The number of Expired properties is down 54%
Full Market Bank Properties Non-Bank Properties
Time Period # Properties Median Price Average DOM # Properties % Bank Median Price # Properties % Non-Bank Median Price
Dec-11 16 309,750 106 0 16 100.0 309,750
Nov-11 16 305,950 89 0 16 100.0 305,950
Oct-11 21 270,900 110 0 21 100.0 270,900
Sep-11 14 297,000 159 0 14 100.0 297,000
Aug-11 24 300,000 99 1 4.2 279,900 23 95.8 300,000
Jul-11 17 309,000 104 0 17 100.0 309,000
Jun-11 19 300,000 84 1 5.3 294,900 18 94.7 307,500
May-11 16 283,650 106 1 6.2 289,300 15 93.8 278,000
Apr-11 13 309,500 77 0 13 100.0 309,500
Mar-11 10 356,050 101 0 10 100.0 356,050
Feb-11 14 322,400 96 1 7.1 294,900 13 92.9 329,900
Jan-11 16 302,450 119 1 6.2 429,900 15 93.8 295,000
Dec-10 21 283,400 112 0 21 100.0 283,400
Nov-10 25 299,000 99 1 4.0 276,900 24 96.0 299,000
Oct-10 38 297,000 137 5 13.2 235,000 33 86.8 319,000
Sep-10 30 322,200 107 2 6.7 263,000 28 93.3 322,200
Aug-10 34 277,000 111 2 5.9 207,400 32 94.1 279,400
Jul-10 27 316,500 129 1 3.7 244,900 26 96.3 320,750
Jun-10 30 319,000 90 0 30 100.0 319,000
May-10 17 299,100 61 0 17 100.0 299,100
Apr-10 25 324,950 109 1 4.0 475,000 24 96.0 321,975
Mar-10 17 324,900 120 0 17 100.0 324,900
Feb-10 9 250,000 56 0 9 100.0 250,000
Jan-10 14 284,750 129 0 14 100.0 284,750
Dec-09 35 319,900 90 0 35 100.0 319,900
Clarus MarketMetrics® 2 of 2 01/04/2012
Information not guaranteed. © 2009-2010 Terradatum and its suppliers and licensors (www.terradatum.com/about/licensors.td).
www.TaylorRealEstateAustin.com | Direct: 512.796.4447 | Fax: 512.628.7720 | 2525 Wallingwood Bldg. 7C Austin, TX 78746
14 of 20
- 15. Blake Taylor Taylor Real Estate
Supply & Demand by Month
Dec-09 vs. Dec-11: The number of for sale properties is down 41% and the number of sold properties is up 11%
Dec-09 vs. Dec-11 Dec-09 vs. Dec-11
Dec-09 Dec-11 Change % Dec-09 Dec-11 Change %
178 105 -73 -41% 45 50 5 +11%
MLS: ACTRIS Period: 2 years (monthly) Price: All Construction Type: All Bedrooms: All Bathrooms: All Lot Size: All
Property Types: Residential: (House, Condo, Townhouse, Half Duplex, Modular) Sq Ft: All
MLS Areas: SWW
Clarus MarketMetrics® 1 of 2 01/04/2012
Information not guaranteed. © 2009-2010 Terradatum and its suppliers and licensors (www.terradatum.com/about/licensors.td).
www.TaylorRealEstateAustin.com | Direct: 512.796.4447 | Fax: 512.628.7720 | 2525 Wallingwood Bldg. 7C Austin, TX 78746
15 of 20
- 16. Blake Taylor Taylor Real Estate
Supply & Demand by Month
Dec-09 vs. Dec-11: The number of for sale properties is down 41% and the number of sold properties is up 11%
# Properties Average DOM # Properties Average DOM
Time Period For Sale For Sale Sold Sold
Dec-11 105 87 50 62
Nov-11 144 80 41 48
Oct-11 161 84 38 47
Sep-11 173 85 49 58
Aug-11 200 83 59 48
Jul-11 217 78 63 45
Jun-11 240 72 63 53
May-11 243 74 64 33
Apr-11 234 66 56 37
Mar-11 214 71 50 60
Feb-11 184 86 31 78
Jan-11 173 96 38 68
Dec-10 184 99 44 56
Nov-10 207 90 35 78
Oct-10 230 97 39 83
Sep-10 260 96 40 65
Aug-10 288 90 39 60
Jul-10 312 80 58 42
Jun-10 310 75 61 41
May-10 296 67 84 38
Apr-10 320 60 61 37
Mar-10 262 68 48 44
Feb-10 223 67 40 56
Jan-10 190 77 15 89
Dec-09 178 97 45 88
Clarus MarketMetrics® 2 of 2 01/04/2012
Information not guaranteed. © 2009-2010 Terradatum and its suppliers and licensors (www.terradatum.com/about/licensors.td).
www.TaylorRealEstateAustin.com | Direct: 512.796.4447 | Fax: 512.628.7720 | 2525 Wallingwood Bldg. 7C Austin, TX 78746
16 of 20
- 17. Blake Taylor Taylor Real Estate
The Average Days on Market by Month
Dec-09 vs. Dec-11: The average days on market is down 57%
Dec-09 vs. Dec-11
Dec-09 Dec-11 Change %
118 51 -67 -57%
MLS: ACTRIS Period: 2 years (monthly) Price: All Construction Type: All Bedrooms: All Bathrooms: All Lot Size: All
Property Types: Residential: (House, Condo, Townhouse, Half Duplex, Modular) Sq Ft: All
MLS Areas: SWW
Clarus MarketMetrics® 1 of 2 01/04/2012
Information not guaranteed. © 2009-2010 Terradatum and its suppliers and licensors (www.terradatum.com/about/licensors.td).
www.TaylorRealEstateAustin.com | Direct: 512.796.4447 | Fax: 512.628.7720 | 2525 Wallingwood Bldg. 7C Austin, TX 78746
17 of 20
- 18. Blake Taylor Taylor Real Estate
The Average Days on Market by Month
Dec-09 vs. Dec-11: The average days on market is down 57%
Time Period Average DOM # UC Units
Dec-11 51 30
Nov-11 61 49
Oct-11 47 43
Sep-11 55 38
Aug-11 59 51
Jul-11 41 60
Jun-11 50 59
May-11 51 67
Apr-11 29 56
Mar-11 40 68
Feb-11 62 45
Jan-11 67 33
Dec-10 75 38
Nov-10 53 37
Oct-10 74 37
Sep-10 87 45
Aug-10 67 38
Jul-10 52 44
Jun-10 42 59
May-10 42 52
Apr-10 34 81
Mar-10 43 62
Feb-10 42 43
Jan-10 43 44
Dec-09 118 24
Clarus MarketMetrics® 2 of 2 01/04/2012
Information not guaranteed. © 2009-2010 Terradatum and its suppliers and licensors (www.terradatum.com/about/licensors.td).
www.TaylorRealEstateAustin.com | Direct: 512.796.4447 | Fax: 512.628.7720 | 2525 Wallingwood Bldg. 7C Austin, TX 78746
18 of 20
- 19. Blake Taylor Taylor Real Estate
Months Supply of Inventory
Dec-09 vs. Dec-11: The average months supply of inventory is down 60%
Dec-09 vs. Dec-11
Dec-09 Dec-11 Change %
5.0 2.0 -3.0 -60%
MLS: ACTRIS Period: 2 years (monthly) Price: All Construction Type: All Bedrooms: All Bathrooms: All Lot Size: All
Property Types: Residential: (House, Condo, Townhouse, Half Duplex, Modular) Sq Ft: All
MLS Areas: SWW
Clarus MarketMetrics® 1 of 2 01/04/2012
Information not guaranteed. © 2009-2010 Terradatum and its suppliers and licensors (www.terradatum.com/about/licensors.td).
www.TaylorRealEstateAustin.com | Direct: 512.796.4447 | Fax: 512.628.7720 | 2525 Wallingwood Bldg. 7C Austin, TX 78746
19 of 20
- 20. Blake Taylor Taylor Real Estate
Months Supply of Inventory
Dec-09 vs. Dec-11: The average months supply of inventory is down 60%
# Units For Sale # UC Units UC Average
Time Period Last Day of Month During Month MSI DOM
Dec-11 59 30 2.0 51
Nov-11 79 49 1.6 61
Oct-11 97 43 2.3 47
Sep-11 121 38 3.2 55
Aug-11 125 51 2.5 59
Jul-11 140 60 2.3 41
Jun-11 162 59 2.7 50
May-11 160 67 2.4 51
Apr-11 165 56 2.9 29
Mar-11 136 68 2.0 40
Feb-11 125 45 2.8 62
Jan-11 124 33 3.8 67
Dec-10 125 38 3.3 75
Nov-10 145 37 3.9 53
Oct-10 155 37 4.2 74
Sep-10 185 45 4.1 87
Aug-10 216 38 5.7 67
Jul-10 241 44 5.5 52
Jun-10 221 59 3.7 42
May-10 227 52 4.4 42
Apr-10 214 81 2.6 34
Mar-10 183 62 3.0 43
Feb-10 171 43 4.0 42
Jan-10 132 44 3.0 43
Dec-09 119 24 5.0 118
Clarus MarketMetrics® 2 of 2 01/04/2012
Information not guaranteed. © 2009-2010 Terradatum and its suppliers and licensors (www.terradatum.com/about/licensors.td).
www.TaylorRealEstateAustin.com | Direct: 512.796.4447 | Fax: 512.628.7720 | 2525 Wallingwood Bldg. 7C Austin, TX 78746
20 of 20