KDD Analytics 2014 - Experts in Marketing Analytics
•
2 j'aime•46,952 vues

KDD Analytics provides expertise in marketing predictive analytics and insightful dashboards for management striving for better data driven solutions. KDD is pioneering the use of ai-one's Analyst Toolbox for conversion of unstructured text documents into exciting BI visualizations.

Recommandé
Recommandé
Contenu connexe
Tendances
Tendances (20)
En vedette
En vedette (20)
Similaire à KDD Analytics 2014 - Experts in Marketing Analytics
Similaire à KDD Analytics 2014 - Experts in Marketing Analytics (20)
Dernier
Dernier (20)
KDD Analytics 2014 - Experts in Marketing Analytics
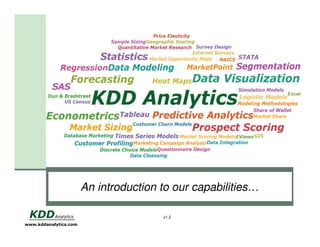
- 1. An introduction to subtitle style Click to edit Masterour capabilities… v1.2 www.kddanalytics.com
- 2. Who are we? A team of statisticians, economists, business and industry subject matter experts; Specialists in database marketing analytics (market sizing; market simulation; segmentation; predictive prospect, campaign and churn scoring; etc), with extensive experience in the B2B space; Data junkies who love to get their hands dirty integrating, cleaning, modeling and visualizing client and 3rd party databases; Experienced professionals with particularly deep experience in the telecom, IT and energy industries. www.kddanalytics.com
- 3. Who do we serve? Our clients range from large providers of B2B marketing data to small consulting groups; We typically wholesale our services but can and have worked directly with end users. www.kddanalytics.com
- 4. What do we do? Simply put, we help you help your clients make more informed decisions via data analytics: Statistical Modeling Data Modeling •Market Sizing •Prospect/Campaign Scoring •Market Simulation •Customer Churn Scoring •Forecasting Cross pollination •Market Opportunity Mapping •Segmentation •Data Integration •Survey Sample Design •Customer Profiling •Data Visualization •Demand/Price Elasticity Estimation What do we know? www.kddanalytics.com How can we organize it? Can we predict what will happen?
- 5. Statistical Modeling Predictive modeling is all about finding more of those you wish to find. Scoring… Best customers What you want to find Churners Modeling Buyers Responders Competitors Attributes Using model identifies more prospects than using no model = “lift” www.kddanalytics.com Target Target Population Population Target list scored from most likely prospect to least. ID 105343236 138021163 147116482 201002390 101047263 202075210 123136008 105639354 106080974 111180060 134079517 144439822 207068360 114185643 124073515 143104099 138019692 134110988 144390826 132020465 134107700 120017332 141080328 133209000 136196993 144430916 118052109 110296359 207093595 207057547 PERCENTILE 6 8 16 17 19 19 19 21 24 24 28 29 36 37 37 40 40 46 49 57 62 71 73 74 75 77 81 84 86 97
- 6. Statistical Modeling Churn Likelihood Customer Churn… 0.60 Median Tenure Churn Probability Internal Validation - Lift Analysis 3.50 Cum Lift Lift Baseline 3.00 Top decile 2.3 times average predicted churn potential Lift 2.50 2.00 FULL 0.50 CARE BDM PAM Mean Tenure 0.40 0.30 0.20 0.10 0.00 0 1.50 1000 2000 3000 4000 5000 Tenure (days) 1.00 External Validation - Lift Analysis 0.50 0.00 3.00 1 2 3 4 2.50 5 Cum Lift 6 7 Decile 9 Baseline 10 Top decile 1.6 times average predicted churn potential 2.00 Lift Lift 8 1.50 1.00 0.50 0.00 1 2 3 www.kddanalytics.com 4 5 6 Decile 7 8 9 10 Models should be validated on data external to the modeling sample; such as the ~1,400 additional accounts which churned in the month following the model build. 6000
- 7. Statistical Modeling Customer segmentation can be Customer segmentation made actionable by enhancing enhanced with with opportunity mapping… opportunity mapping. Segmentation… Segment 1 2 3 4 5 6 7 8 9 10 11 12 13 14 15 16 17 18 19 20 21 22 23 Total Segments Customers (sites) Percent Market (CiTDB) Percent Penetration Segment 404 4.1% 33,362 0.9% 381 374 327 259 608 444 404 378 367 270 227 454 400 366 285 285 235 197 195 173 169 151 9,780 7,353 3.9% 3.8% 3.3% 2.6% 6.2% 4.5% 4.1% 3.9% 3.8% 2.8% 2.3% 4.6% 4.1% 3.7% 2.9% 2.9% 2.4% 2.0% 2.0% 1.8% 1.7% 1.5% 100.0% 92,016 40,582 52,166 55,559 119,341 104,702 96,113 135,668 11,703 49,856 119,048 143,270 190,813 232,119 16,929 88,629 83,420 24,242 27,189 59,592 6,974 79,154 3,593,931 1,862,447 2.6% 1.1% 1.5% 1.5% 3.3% 2.9% 2.7% 3.8% 0.3% 1.4% 3.3% 4.0% 5.3% 6.5% 0.5% 2.5% 2.3% 0.7% 0.8% 1.7% 0.2% 2.2% 100.0% www.kddanalytics.com 1.2% 1 0.4% 2 0.9% 3 0.6% 4 0.5% 5 0.5% 6 0.4% 7 0.4% 8 0.3% 9 3.1% 10 0.5% 11 0.2% 12 0.3% 13 0.2% 14 0.2% 15 1.7% 16 0.3% 17 0.3% 18 0.8% 19 0.7% 20 0.3% 21 2.4% 22 0.2% 23 0.3% Total 0.4% Segments Average IT Spend per Employee: Customers Total IT Spend ($M): Customers $ 18 $ $ 16 $ 58 $ 51 $ 32 $ 62 $ 59 $ 7 $ 18 $Average IT 232 Spend (Gap) $ 97 $ 179 $ 104 $ 13 $ 13 $ 351 $ 145 $ 77 $ 41 $ 124 $ 19 $ 806 $ Average 14 $ 5,147 $ 2,536 $ $ $ $ $ $ $ $ $ $ $ $ $ $ $ $ $ $ $ $ $ $ $ $ Average IT Spend per Employee: NonCustomers Total IT Spend ($M): NonCustomers 1,367 $ 1,535 $ 5,293 $ 4,658 $ 4,582 $ 3,304 $ 4,583 $ 571 $ 1,539 $ 3,492 $ 13,180 $ 27,050 $ High 6,168 $ Spend/Low 938 $ 1,158 $ Penetration 6,207 $ 15,373 $ 8,721 $ 1,044 $ 24,045 $ 3,298 $ 24,558 $ 2,831 $ 4,647 $ 6,460 $ Low Spend/Low Penetration 836 $ 2,379 3,825 4,065 4,112 7,716 6,880 1,391 3,853 12 6,787 9,447 35,355 13,294 3,453 5,600 17 11,710 23,923 12,574 3,986 9,523 4,056 24,195 18 3,864 507,689 13 202,824 21 1,331 $ $ $ $ $ $ $ $ $ $ $ $ $ $ $ $ $ 11 $ $ $ $ $ $ 75 $ 6 1,652 5,271 4,164 4,334 3,228 4,151 776 1,538 3,413 20 11,408 21,043 4,044 855 1,249 3,730 14,720 6,504 919 19,618 3,176 19,278 2,355 4,110 4 4,501 22 High Spend/High Penetration 3 16 23 15 9 14 2 8 Average 19 1 10 Low Spend/High Penetration Market Penetration
- 8. Statistical Modeling Time series and econometric forecast modeling. Forecasting… Non-Dynamic Simulation: 3 AR Model Average 1.60 1.40 1.20 1.00 Risk Signature 0.80 0.60 100% 44,000,000 90% 43,000,000 80% 0.40 0.20 70% 42,000,000 60% 11 /6 /2 2/ 005 6/ 2 5/ 006 6/ 2 8/ 006 6/ 11 2 00 /6 6 /2 2/ 006 6/ 2 5/ 007 6/ 2 8/ 007 6/ 11 2 00 /6 7 /2 2/ 007 6/ 2 5/ 008 6/ 2 8/ 008 6/ 11 2 00 /6 8 /2 2/ 008 6/ 2 5/ 009 6/ 2 8/ 009 6/ 11 2 00 /6 9 /2 2/ 009 6/ 2 5/ 010 6/ 2 8/ 010 6/ 11 2 01 /6 0 /2 2/ 010 6/ 20 11 0.00 41,000,000 50% Hold Out Test (18 Months) 40,000,000 Actual 32,000,000 Average Predicted 39,000,000 MIN LC 40% MAX UC 30% 31,000,000 38,000,000 20% 30,000,000 37,000,000 2014Q1 18_F_ARIMA(114) 18_F_LOG_ARIMA(112) 18_F_LOG_ARIMA(214) 12_F_ARIMA(214) 12_F_LOG_ARIMA(110) 6_F_LOG_ARIMA(211) 6_F_LOG_ARIMA(114)_GARCH(01) 10% 2014Q3 2015Q1 2015Q3 29,000,000 2016Q1 2016Q3 0% ± 2 S.E. 20 11 Q 20 4 12 Q 20 2 12 Q 20 4 13 Q 20 2 13 Q 20 4 14 Q 20 2 14 Q 20 4 15 Q 20 2 15 Q 20 4 16 Q 20 2 16 Q 20 4 17 Q 20 2 17 Q 20 4 18 Q 20 2 18 Q 20 4 19 Q 20 2 19 Q 20 4 20 Q 20 2 20 Q 20 4 21 Q 20 2 21 Q 20 4 22 Q 20 2 22 Q 4 CRAF_FC 28,000,000 Actual 27,000,000 18_F_ARIMA(114) 18_F_LOG_ARIMA(112) 26,000,000 18_F_LOG_ARIMA(214) 20 11 Q 3 20 11 Q 2 20 11 Q 1 20 10 Q 4 20 10 Q 3 20 10 Q 2 20 10 Q 1 20 09 Q 4 20 09 Q 3 20 09 Q 2 www.kddanalytics.com 20 09 Q 1 25,000,000
- 9. Statistical Modeling Survey sample design… www.kddanalytics.com 280 cell design to yield representative sample of US business sites with overall 1.3% sampling error.
- 10. Data Modeling Data Integration… …to eliminate database whitespace or append a new field, such as sales revenue or IT spend, to a particular business site or customer. Industry Analyst Reports Private 3rd Party Data Commerce Dept. Gov’t Agency Budget Reports Census Dept. Bureau Labor Stats 10K Reports Factors (e.g. $/employee) Client Customer or Marketing Database www.kddanalytics.com
- 11. Data Modeling Market Sizing… 2008 Market size + Customer Sales => Market Gap (how many $ left on the table) Market Potential Total Spend (m) Accounts Spend per Account Agriculture Education Education Other F-I-RE $ 9,744 703,477 $ $ 9,993 135,989 $ 73,485 $ 21,469 175,066 $ 122,636 $ 68,695 1,527,733 $ Health Services $ 21,173 932,780 $ Health Services Other Manufacturing Manufacturing Other Mining/Construction Public Administration Retail Services Other Services-Personal Transportation/Telecom Wholesale $ 7,429 26,686 $ 278,398 $ 31,836 803,147 $ 39,639 $ 3,391 $ 23,622 $ 24,263 Total $ $ 58,709 $ 129,777 $ 78,797 $ 25,721 $ 32,207 546,828 13,852 44,966 2008 34,903 $ Agriculture 1,509,277 $ Education 293,066 $ Education Other 2,965,485 $ F-I-RE 1,480,184 Services Health $ 22,698 Client Bookings (m) Client Share 97,154 $ 9,744 $ 75 15,651 $ 9,993 $ 250 2.5% 82,790 $ 21,469 $ 200 0.9% 19,797 $ 68,695 $ 6,800 9.9% 87,676 $ 21,173 $ 3,000 14.2% Other 18,045 $ 7,429 $ 575 7.7% 737,019 $ 34,899 Manufacturing 866,932 $ Manufacturing Other 37,151 16,558,534 $ Mining/Construction 33,024 $ 31,836 $ $ 3,391 $ $ 23,622 $ $ 24,263 $ $ 58,709 $ $ 129,777 $ $ 78,797 $ $ 25,721 $ $ 32,207 $ 4,366,790 Services Health $ Public Administration Retail Services Other Services-Personal Transportation/Telecom Wholesale Total www.kddanalytics.com Market Size (m) $ 546,828 $ 1,200 F-I-RE 0.8% Accounts Gap Value (m) Value per Account 3,636 $ 23,503 $ 2,360 $ 10,375 $ 4,395,409 12.3% 2,679 $ 3,435 $ 1,282,042 49.5% 5,605 $ 6,388 $ 1,139,616 6,042 $ 6,500 $ 1,075,787 10,000 Manufacturing Other 7.7% 2,173 $ 1,746 $ 803,341 8,000 Public Administration 10.2% 5,956 $ 3,879 $ 651,282 44.7% 36,961 $ 13,051 $ 353,097 8.5% 10,735 $ 2,742 $ 255,387 64,500 Wholesale 11.8% Mining/Construction Education Other Services-Personal Agriculture Retail Total 6,654 $ 1,546 $ 232,377 6,714 $ 1,362 $ 202,822 16,407 $ 2,713 $ 165,362 19,466 $ 2,569 $ 131,958 1,571 $ 153 $ 97,141 33,408 $ 627 $ 18,758 3.8% 250 Transportation/Telecom 7.4% 2,900 Services Other 12,000 Education 5,000 Health Services Other 8.5% 11,500 Manufacturing 2,750 Health Services 160,369 $ 80,588 $ 6,464,684 502,515
- 12. Data Modeling Market Simulation… www.kddanalytics.com Excel based models allowing user to conduct “what if” analyses by changing values of model parameters.
- 13. Data Modeling Data Visualization… www.kddanalytics.com Interactive Tableau dashboards…see www.kddanalytics.com
- 14. Data Modeling KDD MarketPoint… www.kddanalytics.com Segmentation and prioritization Segmentation and prioritization solution driven by: solution driven by: * Clients’ customer data data * Clients’ customer * 3rd party enrichment data * 3rd party enrichment * KDDdata Analytics * KDD Analytics Three components: * MP Profile => “What”? Three components: * MP Opportunity => “Where”? * MarketPoint Profile => “What”? * MP Prospect => “Who”? * MarketPoint Opportunity => Deliverables “Where”? * Static and interactive => * MarketPoint Prospect dashboards/Excel workbooks “Who”? * Scored and ranked prospecting lists Deliverables * Static and interactive See www.kddanalytics.com. dashboards/Excel workbooks * Scored and ranked prospecting lists
- 15. Contact Info Let us know how we can help you: info@kddanalytics.com www.kddanalytics.com www.kddanalytics.com