Strategic long question1 (1) (1)
•Télécharger en tant que DOC, PDF•
0 j'aime•432 vues

strategic management

Recommandé
Recommandé
Contenu connexe
Tendances
Tendances (20)
Similaire à Strategic long question1 (1) (1)
Similaire à Strategic long question1 (1) (1) (20)
Dernier
Dernier (20)
Strategic long question1 (1) (1)
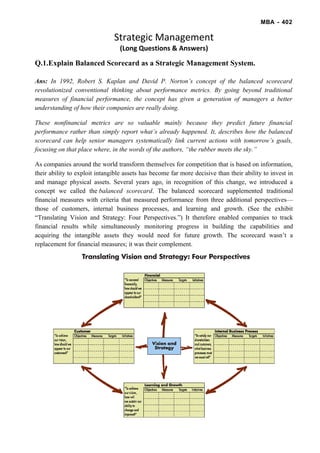
- 1. .MBA - 402 Strategic Management (Long Questions & Answers) Q.1.Explain Balanced Scorecard as a Strategic Management System. Ans: In 1992, Robert S. Kaplan and David P. Norton’s concept of the balanced scorecard revolutionized conventional thinking about performance metrics. By going beyond traditional measures of financial performance, the concept has given a generation of managers a better understanding of how their companies are really doing. These nonfinancial metrics are so valuable mainly because they predict future financial performance rather than simply report what’s already happened. It, describes how the balanced scorecard can help senior managers systematically link current actions with tomorrow’s goals, focusing on that place where, in the words of the authors, “the rubber meets the sky.” As companies around the world transform themselves for competition that is based on information, their ability to exploit intangible assets has become far more decisive than their ability to invest in and manage physical assets. Several years ago, in recognition of this change, we introduced a concept we called the balanced scorecard. The balanced scorecard supplemented traditional financial measures with criteria that measured performance from three additional perspectives— those of customers, internal business processes, and learning and growth. (See the exhibit “Translating Vision and Strategy: Four Perspectives.”) It therefore enabled companies to track financial results while simultaneously monitoring progress in building the capabilities and acquiring the intangible assets they would need for future growth. The scorecard wasn’t a replacement for financial measures; it was their complement.
- 2. Recently, we have seen some companies move beyond our early vision for the scorecard to discover its value as the cornerstone of a new strategic management system. Used this way, the scorecard addresses a serious deficiency in traditional management systems: their inability to link a company’s long-term strategy with its short-term actions. Most companies’ operational and management control systems are built around financial measures and targets, which bear little relation to the company’s progress in achieving long-term strategic objectives. Thus the emphasis most companies place on short-term financial measures leaves a gap between the development of a strategy and its implementation. Managers using the balanced scorecard do not have to rely on short-term financial measures as the sole indicators of the company’s performance. The scorecard lets them introduce four new management processes that, separately and in combination, contribute to linking long-term strategic objectives with short-term actions. (See the exhibit “Managing Strategy: Four Processes.”) The first new process—translating the vision—helps managers build a consensus around the organization’s vision and strategy. Despite the best intentions of those at the top, lofty statements about becoming “best in class,” “the number one supplier,” or an “empowered organization” don’t translate easily into operational terms that provide useful guides to action at the local level. For people to act on the words in vision and strategy statements, those statements must be expressed as an integrated set of objectives and measures, agreed upon by all senior executives, that describe the long-term drivers of success. The second process—communicating and linking—lets managers communicate their strategy up and down the organization and link it to departmental and individual objectives. Traditionally, departments are evaluated by their financial performance, and individual incentives are tied to short-term financial goals. The scorecard gives managers a way of ensuring that all levels of the organization understand the long-term strategy and that both departmental and individual objectives are aligned with it.
- 3. The third process—business planning—enables companies to integrate their business and financial plans. Almost all organizations today are implementing a variety of change programs, each with its own champions, gurus, and consultants, and each competing for senior executives’ time, energy, and resources. Managers find it difficult to integrate those diverse initiatives to achieve their strategic goals—a situation that leads to frequent disappointments with the programs’ results. But when managers use the ambitious goals set for balanced scorecard measures as the basis for allocating resources and setting priorities, they can undertake and coordinate only those initiatives that move them toward their long-term strategic objectives. The fourth process—feedback and learning—gives companies the capacity for what we call strategic learning. Existing feedback and review processes focus on whether the company, its departments, or its individual employees have met their budgeted financial goals. With the balanced scorecard at the center of its management systems, a company can monitor short-term results from the three additional perspectives—customers, internal business processes, and learning and growth—and evaluate strategy in the light of recent performance. The scorecard thus enables companies to modify strategies to reflect real-time learning. Q.2. Discuss McKinsey 7s framework and its application Ans: Definition “McKinsey 7s model is a tool that analyzes firm’s organizational design by looking at 7 key internal elements: strategy, structure, systems, shared values, style, staff and skills, in order to identify if they are effectively aligned and allow organization to achieve its objectives.” Understanding the tool McKinsey 7s model was developed in 1980s by McKinsey consultants Tom Peters, Robert Waterman and Julien Philips with a help from Richard Pascale and Anthony G. Athos. Since the introduction, the model has been widely used by academics and practitioners and remains one of the most popular strategic planning tools. It sought to present an emphasis on human resources (Soft S), rather than the traditional mass production tangibles of capital, infrastructure and equipment, as a key to higher organizational performance. The goal of the model was to show how 7 elements of the company: Structure, Strategy, Skills, Staff, Style, Systems, and Shared values, can be aligned together to achieve effectiveness in a company. The key point of the model is that all the seven areas are interconnected and a change in one area requires change in the rest of a firm for it to function effectively. Below you can find the McKinsey model, which represents the connections between seven areas and divides them into ‘Soft Ss’ and ‘Hard Ss’. The shape of the model emphasizes interconnectedness of the elements.
- 4. The model can be applied to many situations and is a valuable tool when organizational design is at question. The most common uses of the framework are: • To facilitate organizational change. • To help implement new strategy. • To identify how each area may change in a future. • To facilitate the merger of organizations. 7s factors In McKinsey model, the seven areas of organization are divided into the ‘soft’ and ‘hard’ areas. Strategy, structure and systems are hard elements that are much easier to identify and manage when compared to soft elements. On the other hand, soft areas, although harder to manage, are the foundation of the organization and are more likely to create the sustained competitive advantage. Hard Ss Soft Ss Strategy Style Structure Staff Systems Skills Shared Values Strategy is a plan developed by a firm to achieve sustained competitive advantage and successfully compete in the market. What does a well-aligned strategy mean in 7s McKinsey model? In general, a sound strategy is the one that’s clearly articulated, is long-term, helps to achieve competitive advantage and is reinforced by strong vision, mission and values. But it’s hard to tell if such strategy is well-aligned with other elements when analyzed alone. So the key in 7s model is not to look at your company to find the great strategy, structure, systems and etc. but to look if its aligned with other elements. For example, short-term strategy is usually a poor choice for a company but if its aligned with other 6 elements, then it may provide strong results.
- 5. Structure represents the way business divisions and units are organized and includes the information of who is accountable to whom. In other words, structure is the organizational chart of the firm. It is also one of the most visible and easy to change elements of the framework. Systems are the processes and procedures of the company, which reveal business’ daily activities and how decisions are made. Systems are the area of the firm that determines how business is done and it should be the main focus for managers during organizational change. Skills are the abilities that firm’s employees perform very well. They also include capabilities and competences. During organizational change, the question often arises of what skills the company will really need to reinforce its new strategy or new structure. Staff element is concerned with what type and how many employees an organization will need and how they will be recruited, trained, motivated and rewarded. Style represents the way the company is managed by top-level managers, how they interact, what actions do they take and their symbolic value. In other words, it is the management style of company’s leaders. Shared Values are at the core of McKinsey 7s model. They are the norms and standards that guide employee behavior and company actions and thus, are the foundation of every organization. The authors of the framework emphasize that all elements must be given equal importance to achieve the best results. How to use the tool? As we pointed out earlier, the McKinsey 7s framework is often used when organizational design and effectiveness are at question. It is easy to understand the model but much harder to apply it for your organization due to a common misunderstanding of what should a well-aligned elements be like. There is a useful paper from excellencegateway.org.uk, which provides examples showing how effective and ineffective elements look like. Yet, separate elements that are effective on their own do not necessarily lead to optimal organizational alignment. We provide the following steps that should help you to apply this tool: Step 1. Identify the areas that are not effectively aligned During the first step, your aim is to look at McKinsey 7s and identify if they are effectively aligned with each other. Normally, you should already be aware of how 7 elements are aligned in your company, but if you don’t you can use the checklist to do that. After you’ve answered the questions outlined there you should look for the gaps, inconsistencies and weaknesses between the relationships of the elements. For example, you designed the strategy that relies on quick product introduction but the matrix structure with conflicting relationships hinders that so there’s a conflict that requires the change in strategy or structure. Step 2. Determine the optimal organization design With the help from top management, your second step is to find out what effective organizational design you want to achieve. By knowing the desired alignment you can set your goals and make the action plans much easier. This step is not as straightforward as identifying how seven areas are currently aligned in your organization for a few reasons. First, you need to find the best optimal alignment, which is not known to you at the moment, so it requires more than answering the
- 6. questions or collecting data. Second, there are no templates or predetermined organizational designs that you could use and you’ll have to do a lot of research or benchmarking to find out how other similar organizations coped with organizational change or what organizational designs they are using. Step 3. Decide where and what changes should be made This is basically your action plan, which will detail the areas you want to realign and how would you like to do that. If you find that your firm’s structure and management style are not aligned with company’s values, you should decide how to reorganize the reporting relationships and which top managers should the company let go or how to influence them to change their management style so the company could work more effectively. Step 4. Make the necessary changes The implementation is the most important stage in any process, change or analysis and only the well-implemented changes have positive effects. Therefore, you should find the people in your company or hire consultants that are the best suited to implement the changes. Step 5. Continuously review the 7s The seven elements: strategy, structure, systems, skills, staff, style and values are dynamic and change constantly. A change in one element always has effects on the others and new organizational design is required. Thus, continuous review of each area is very important. Q.3. Explain Porter's Five Forces and its application. Ans: Definition 1. “Porter’s five forces model is an analysis tool that uses five forces to determine the profitability of an industry and shape a firm’s competitive strategy” 2. “It is a framework that classifies and analyzes the most important forces affecting the intensity of competition in an industry and its profitability level.” Porter's Five Forces Understanding the tool Five forces model was created by M. Porter in 1979 to understand how five key competitive forces are affecting an industry. The five forces identified are: These forces determine an industry structure and the level of competition in that industry. The stronger competitive forces in the industry are the less profitable it is. An industry with low barriers
- 7. to enter, having few buyers and suppliers but many substitute products and competitors will be seen as very competitive and thus, not so attractive due to its low profitability. Porter's Five Forces It is every strategist’s job to evaluate company’s competitive position in the industry and to identify what strengths or weakness can be exploited to strengthen that position. The tool is very useful in formulating firm’s strategy as it reveals how powerful each of the five key forces is in a particular industry. Threat of new entrants: This force determines how easy (or not) it is to enter a particular industry. If an industry is profitable and there are few barriers to enter, rivalry soon intensifies. When more organizations compete for the same market share, profits start to fall. It is essential for existing organizations to create high barriers to enter to deter new entrants. Threat of new entrants is high when: • Low amount of capital is required to enter a market; • Existing companies can do little to retaliate; • Existing firms do not possess patents, trademarks or do not have established brand reputation; • There is no government regulation; • Customer switching costs are low (it doesn’t cost a lot of money for a firm to switch to other industries); • There is low customer loyalty; • Products are nearly identical; • Economies of scale can be easily achieved. Bargaining power of suppliers: Strong bargaining power allows suppliers to sell higher priced or low quality raw materials to their buyers. This directly affects the buying firms’ profits because it has to pay more for materials. Suppliers have strong bargaining power when: • There are few suppliers but many buyers; • Suppliers are large and threaten to forward integrate; • Few substitute raw materials exist; • Suppliers hold scarce resources; • Cost of switching raw materials is especially high.
- 8. Bargaining power of buyers: Buyers have the power to demand lower price or higher product quality from industry producers when their bargaining power is strong. Lower price means lower revenues for the producer, while higher quality products usually raise production costs. Both scenarios result in lower profits for producers. Buyers exert strong bargaining power when: • Buying in large quantities or control many access points to the final customer; • Only few buyers exist; • Switching costs to other supplier are low; • They threaten to backward integrate; • There are many substitutes; • Buyers are price sensitive. Threat of substitutes: This force is especially threatening when buyers can easily find substitute products with attractive prices or better quality and when buyers can switch from one product or service to another with little cost. For example, to switch from coffee to tea doesn’t cost anything, unlike switching from car to bicycle. Rivalry among existing competitors: This force is the major determinant on how competitive and profitable an industry is. In competitive industry, firms have to compete aggressively for a market share, which results in low profits. Rivalry among competitors is intense when: • There are many competitors; • Exit barriers are high; • Industry of growth is slow or negative; • Products are not differentiated and can be easily substituted; • Competitors are of equal size; • Low customer loyalty. Although, Porter originally introduced five forces affecting an industry, scholars have suggested including the sixth force: complements. Complements increase the demand of the primary product with which they are used, thus, increasing firm’s and industry’s profit potential. For example, iTunes was created to complement iPod and added value for both products. As a result, both iTunes and iPod sales increased, increasing Apple’s profits. How to perform the analysis? We now understand that Porter’s five forces framework is used to analyze industry’s competitive forces and to shape organization’s strategy according to the results of the analysis. But how to use this tool? We have identified the following steps: • Step 1. Gather the information on each of the five forces • Step 2. Analyze the results and display them on a diagram • Step 3. Formulate strategies based on the conclusions Step 1. Gather the information on each of the five forces. What managers should do during this step is to gather information about their industry and to check it against each of the factors (such as “number of competitors in the industry”) influencing the force. We have already identified the most important factors in the table below.
- 9. Threat of new entry Supplier power Buyer power • Amount of capital required • Retaliation by existing companies • Legal barriers (patents, copyrights, etc.) • Brand reputation • Product differentiation • Access to suppliers and distributors • Economies of scale • Sunk costs • Government regulation • Number of suppliers • Suppliers’ size • Ability to find substitute materials • Materials scarcity • Cost of switching to alternative materials • Threat of integrating forward • Number of buyers • Size of buyers • Size of each order • Buyers’ cost of switching suppliers • There are many substitutes • Price sensitivity • Threat of integrating backward Threat of substitutes Rivalry among existing competitors • Number of substitutes • Performance of substitutes • Cost of changing • Number of competitors • Cost of leaving an industry • Industry growth rate and size • Product differentiation • Competitors’ size • Customer loyalty • Threat of horizontal integration • Level of advertising expense Step2. Analyze the results and display them on a diagram: After gathering all the information, you should analyze it and determine how each force is affecting an industry. For example, if there are many companies of equal size operating in the slow growth industry, it means that rivalry between existing companies is strong. Remember that five forces affect different industries differently so don’t use the same results of analysis for even similar industries! Step3. Formulate strategies based on the conclusions: At this stage, managers should formulate firm’s strategies using the results of the analysis For example, if it is hard to achieve economies of scale in the market, the company should pursue cost leadership strategy. Product development strategy should be used if the current market growth is slow and the market is saturated. Although, Porter’s five forces is a great tool to analyze industry’s structure and use the results to formulate firm’s strategy, it has its limitations and requires further analysis to be done, such as SWOT, PEST or Value Chain analysis.
- 10. Example This is Porter’s five forces analysis example for an automotive industry. Porter's Five Forces Threat of new entry (very weak) ++ Supplier power (weak) + • Large amount of capital required • High retaliation possible from existing companies, if new entrants would bring innovative products and ideas to the industry • Few legal barriers protect existing companies from new entrants • All automotive companies have established brand image and reputation • Products are mainly differentiated by design and engineering quality • New entrant could easily access suppliers and distributors • A firm has to produce at least 5 million (by some estimations) vehicles to be cost competitive, therefore it is very hard to achieve economies of scale • Governments often protect their home markets by introducing high import taxes • Large number of suppliers • Some suppliers are large but the most of them are pretty small • Companies use another type of material (use one metal instead of another) but only to some extent (plastic instead of metal) • Materials widely accessible • Suppliers do not pose any threat of forward integration Buyer power (strong) - Threat of substitutes (weak) + • There are many buyers • Most of the buyers are individuals that buy one car, but corporates or governments usually buy large fleets and can bargain for lower prices • It doesn’t cost much for buyers to switch to another • There are many alternative types of transportation, such as bicycles, motorcycles, trains, buses or planes • Substitutes can rarely offer the same convenience
- 11. brand of vehicle or to start using other type of transportation • Buyers can easily choose alternative car brand • Buyers are price sensitive and their decision is often based on how much does a vehicle cost • Buyers do not threaten backward integration • Alternative types of transportation almost always cost less and sometimes are more environment friendly Competitive rivalry (very strong) -- • Moderate number of competitors • If a firm would decide to leave an industry it would incur huge losses, so most of the time it either bankrupts or stays in automotive industry for the lifetime • Industry is very large but matured • Size of competing firm’s vary but they usually compete for different consumer segments • Customers are loyal to their brands • There is moderate threat of being acquired by a competitor Q.4. Explain BCG growth-share matrix, highlighting its importance as well as limitations if any. Ans: Definition 1. “BCG matrix (or growth-share matrix) is a corporate planning tool, which is used to portray firm’s brand portfolio or SBUs on a quadrant along relative market share axis (horizontal axis) and speed of market growth (vertical axis) axis.” 2. “Growth-share matrix is a business tool, which uses relative market share and industry growth rate factors to evaluate the potential of business brand portfolio and suggest further investment strategies.” Understanding the tool BCG matrix is a framework created by Boston Consulting Group to evaluate the strategic position of the business brand portfolio and its potential. It classifies business portfolio into four categories based on industry attractiveness (growth rate of that industry) and competitive position (relative market share). These two dimensions reveal likely profitability of the business portfolio in terms of cash needed to support that unit and cash generated by it. The general purpose of the analysis is to help understand, which brands the firm should invest in and which ones should be divested.
- 12. Relative market share. One of the dimensions used to evaluate business portfolio is relative market share. Higher corporate’s market share results in higher cash returns. This is because a firm that produces more, benefits from higher economies of scale and experience curve, which results in higher profits. Nonetheless, it is worth to note that some firms may experience the same benefits with lower production outputs and lower market share. Market growth rate. High market growth rate means higher earnings and sometimes profits but it also consumes lots of cash, which is used as investment to stimulate further growth. Therefore, business units that operate in rapid growth industries are cash users and are worth investing in only when they are expected to grow or maintain market share in the future. There are four quadrants into which firms brands are classified: Dogs. Dogs hold low market share compared to competitors and operate in a slowly growing market. In general, they are not worth investing in because they generate low or negative cash returns. But this is not always the truth. Some dogs may be profitable for long period of time, they may provide synergies for other brands or SBUs or simple act as a defense to counter competitors moves. Therefore, it is always important to perform deeper analysis of each brand or SBU to make sure they are not worth investing in or have to be divested. Strategic choices: Retrenchment, divestiture, liquidation Cash cows. Cash cows are the most profitable brands and should be “milked” to provide as much cash as possible. The cash gained from “cows” should be invested into stars to support their further growth. According to growth-share matrix, corporates should not invest into cash cows to induce growth but only to support them so they can maintain their current market share. Again, this is not always the truth. Cash cows are usually large corporations or SBUs that are capable of innovating new products or processes, which may become new stars. If there would be no support for cash cows, they would not be capable of such innovations. Strategic choices: Product development, diversification, divestiture, retrenchment
- 13. Stars. Stars operate in high growth industries and maintain high market share. Stars are both cash generators and cash users. They are the primary units in which the company should invest its money, because stars are expected to become cash cows and generate positive cash flows. Yet, not all stars become cash flows. This is especially true in rapidly changing industries, where new innovative products can soon be outcompeted by new technological advancements, so a star instead of becoming a cash cow, becomes a dog. Strategic choices: Vertical integration, horizontal integration, market penetration, market development, product development Question marks. Question marks are the brands that require much closer consideration. They hold low market share in fast growing markets consuming large amount of cash and incurring losses. It has potential to gain market share and become a star, which would later become cash cow. Question marks do not always succeed and even after large amount of investments they struggle to gain market share and eventually become dogs. Therefore, they require very close consideration to decide if they are worth investing in or not. Strategic choices: Market penetration, market development, product development, divestiture Advantages and disadvantages Benefits of the matrix: • Easy to perform; • Helps to understand the strategic positions of business portfolio; • It’s a good starting point for further more thorough analysis. Growth-share analysis has been heavily criticized for its oversimplification and lack of useful application. Following are the main limitations of the analysis: • Business can only be classified to four quadrants. It can be confusing to classify an SBU that falls right in the middle. • It does not define what ‘market’ is. Businesses can be classified as cash cows, while they are actually dogs, or vice versa. • Does not include other external factors that may change the situation completely. • Market share and industry growth are not the only factors of profitability. Besides, high market share does not necessarily mean high profits. • It denies that synergies between different units exist. Dogs can be as important as cash cows to businesses if it helps to achieve competitive advantage for the rest of the company. Q.5. How to perform BCG matrix analysis? Ans:Although BCG analysis has lost its importance due to many limitations, it can still be a useful tool if performed by following these steps: • Step 1. Choose the unit • Step 2. Define the market • Step 3. Calculate relative market share • Step 4. Find out market growth rate • Step 5. Draw the circles on a matrix
- 14. Step 1. Choose the unit. BCG matrix can be used to analyze SBUs, separate brands, products or a firm as a unit itself. Which unit will be chosen will have an impact on the whole analysis. Therefore, it is essential to define the unit for which you’ll do the analysis. Step 2. Define the market. Defining the market is one of the most important things to do in this analysis. This is because incorrectly defined market may lead to poor classification. For example, if we would do the analysis for the Daimler’s Mercedes-Benz car brand in the passenger vehicle market it would end up as a dog (it holds less than 20% relative market share), but it would be a cash cow in the luxury car market. It is important to clearly define the market to better understand firm’s portfolio position. Step 3. Calculate relative market share. Relative market share can be calculated in terms of revenues or market share. It is calculated by dividing your own brand’s market share (revenues) by the market share (or revenues) of your largest competitor in that industry. For example, if your competitor’s market share in refrigerator’s industry was 25% and your firm’s brand market share was 10% in the same year, your relative market share would be only 0.4. Relative market share is given on x-axis. It’s top left corner is set at 1, midpoint at 0.5 and top right corner at 0 (see the example below for this). Step 4. Find out market growth rate. The industry growth rate can be found in industry reports, which are usually available online for free. It can also be calculated by looking at average revenue growth of the leading industry firms. Market growth rate is measured in percentage terms. The midpoint of the y-axis is usually set at 10% growth rate, but this can vary. Some industries grow for years but at average rate of 1 or 2% per year. Therefore, when doing the analysis you should find out what growth rate is seen as significant (midpoint) to separate cash cows from stars and question marks from dogs. Step 5. Draw the circles on a matrix. After calculating all the measures, you should be able to map your brands on the matrix. You should do this by drawing a circle for each brand. The size of the circle should correspond to the proportion of business revenue generated by that brand. Q.6. Describe Value Chain Analysis Ans: Definition 1. “Value chain analysis (VCA) is a process where a firm identifies its primary and support activities that add value to its final product and then analyze these activities to reduce costs or increase differentiation.” 2. “Value chain represents the internal activities a firm engages in when transforming inputs into outputs.” Understanding the tool VCA is a strategy tool used to analyze internal firm activities. Its goal is to recognize, which activities are the most valuable (i.e. are the source of cost or differentiation advantage) to the firm and which ones could be improved to provide competitive advantage. In other words, by looking
- 15. into internal activities, the analysis reveals where a firm’s competitive advantages or disadvantages are. The firm that competes through differentiation advantage will try to perform its activities better than competitors would do. If it competes through cost advantage, it will try to perform internal activities at lower costs than competitors would do. When a company is capable of producing goods at lower costs than the market price or to provide superior products, it earns profits. M. Porter introduced the generic value chain model in 1985. Value chain represents all the internal activities a firm engages in to produce goods and services. VC is formed of primary activities that add value to the final product directly and support activities that add value indirectly. Below you can see the Porter’s VC model. Primary Activities Support Activities Although, primary activities add value directly to the production process, they are not necessarily more important than support activities. Nowadays, competitive advantage mainly derives from technological improvements or innovations in business models or processes. Therefore, such support activities as ‘information systems’, ‘R&D’ or ‘general management’ are usually the most important source of differentiation advantage. On the other hand, primary activities are usually the source of cost advantage, where costs can be easily identified for each activity and properly managed. Firm’s VC is a part of a larger industry VC. The more activities a company undertakes compared to industry VC, the more vertically integrated it is. Below you can find an industry value chain and its relation to a firm level VC. Industry Value Chain
- 16. Primary Activities Primary value chain activities include: Primary Activity Description Inbound logistics All those activities concerned with receiving and storing externally sourced materials Operations The manufacture of products and services - the way in which resource inputs(e.g. materials) are converted to outputs (e.g. products) Outbound logistics All those activities associated with getting finished goods and services to buyers
- 17. Marketing and sales Essentially an information activity - informing buyers and consumers about products and services (benefits, use, price etc.) Service All those activities associated with maintaining product performance after the product has been sold Support Activities Support activities include: Secondary Activity Description Procurement This concerns how resources are acquired for a business (e.g. sourcing and negotiating with materials suppliers) Human Resource Management Those activities concerned with recruiting, developing, motivating and rewarding the workforce of a business Technology Development Activities concerned with managing information processing and the development and protection of "knowledge" in a business Infrastructure Concerned with a wide range of support systems and functions such as finance, planning, quality control and general senior management Q.7. How to perform VALUE CHAIN analysis? Ans: There are two different approaches on how to perform the analysis, which depend on what type of competitive advantage a company wants to create (cost or differentiation advantage). The table below lists all the steps needed to achieve cost or differentiation advantage using VCA. Cost advantage Differentiation advantage This approach is used when organizations try to compete on costs and want to understand the sources of their cost advantage or disadvantage and what factors drive those costs. The firms that strive to create superior products or services use differentiation advantage approach. • Step 1. Identify the firm’s primary and support activities. • Step 2. Establish the relative importance of each activity in the total cost of the product. • Step 3. Identify cost drivers for each activity. • Step 4. Identify links between activities. Step 1. Identify the customers’ value- creating activities. Step 2. Evaluate the differentiation strategies for improving customer value. Step 3. Identify the best sustainable differentiation.
- 18. • Step 5. Identify opportunities for reducing costs. Cost advantage To gain cost advantage a firm has to go through 5 analysis steps: Step 1. Identify the firm’s primary and support activities. All the activities (form receiving and storing materials to marketing, selling and after sales support) that are undertaken to produce goods or services have to be clearly identified and separated from each other. This requires an adequate knowledge of company’s operations because value chain activities are not organized in the same way as the company itself. The managers who identify value chain activities have to look into how work is done to deliver customer value. Step 2. Establish the relative importance of each activity in the total cost of the product. The total costs of producing a product or service must be broken down and assigned to each activity. Activity based costing is used to calculate costs for each process. Activities that are the major sources of cost or done inefficiently (when benchmarked against competitors) must be addressed first. Step 3. Identify cost drivers for each activity. Only by understanding what factors drive the costs, managers can focus on improving them. Costs for labor-intensive activities will be driven by work hours, work speed, wage rate, etc. Different activities will have different cost drivers. Step 4. Identify links between activities. Reduction of costs in one activity may lead to further cost reductions in subsequent activities. For example, fewer components in the product design may lead to less faulty parts and lower service costs. Therefore identifying the links between activities will lead to better understanding how cost improvements would affect he whole value chain. Sometimes, cost reductions in one activity lead to higher costs for other activities. Step 5. Identify opportunities for reducing costs. When the company knows its inefficient activities and cost drivers, it can plan on how to improve them. Too high wage rates can be dealt with by increasing production speed, outsourcing jobs to low wage countries or installing more automated processes. Differentiation advantage VCA is done differently when a firm competes on differentiation rather than costs. This is because the source of differentiation advantage comes from creating superior products, adding more features and satisfying varying customer needs, which results in higher cost structure. Step 1. Identify the customers’ value-creating activities. After identifying all value chain activities, managers have to focus on those activities that contribute the most to creating customer value. For example, Apple products’ success mainly comes not from great product features (other companies have high-quality offerings too) but from successful marketing activities. Step 2. Evaluate the differentiation strategies for improving customer value. Managers can use the following strategies to increase product differentiation and customer value: • Add more product features; • Focus on customer service and responsiveness;
- 19. • Increase customization; • Offer complementary products. Step 3. Identify the best sustainable differentiation. Usually, superior differentiation and customer value will be the result of many interrelated activities and strategies used. The best combination of them should be used to pursue sustainable differentiation advantage. Q.8. Discuss in details VRIO framework. Explain the process of using the tools. Ans: Definition “VRIO framework is the tool used to analyze firm’s internal resources and capabilities to find out if they can be a source of sustained competitive advantage.” Understanding the tool In order to understand the sources of competitive advantage firms are using many tools to analyze their external (Porter’s 5 Forces, PEST analysis) and internal (Value Chain analysis, BCG Matrix) environments. One of such tools that analyze firm’s internal resources is VRIO analysis. The tool was originally developed by Barney, J. B. (1991) in his work ‘Firm Resources and Sustained Competitive Advantage’, where the author identified four attributes that firm’s resources must possess in order to become a source of sustained competitive advantage. According to him, the resources must be Valuable, Rare, imperfectly Imitable and Non-substitutable. His original framework was called VRIN. In 1995, in his later work ‘Looking Inside for Competitive Advantage’ Barney has introduced VRIO framework, which was the improvement of VRIN model. VRIO analysis stands for four questions that ask if a resource is: Valuable? Rare? Costly to Imitate? And is a firm Organized to capture the value of the resources? A resource or capability that meets all four requirements can bring sustained competitive advantage for the company. Adopted from Rothaermel’s (2013) ‘Strategic Management’ Valuable The first question of the framework asks if a resource adds value by enabling a firm to exploit opportunities or defend against threats. If the answer is yes, then a resource is considered valuable. Resources are also valuable if they help organizations to increase the perceived customer value. This is done by increasing differentiation or/and decreasing the price of the product. The resources that cannot meet this condition, lead to competitive disadvantage. It is important to continually review the value of the resources because constantly changing internal or external conditions can make them less valuable or useless at all.
- 20. Rare Resources that can only be acquired by one or very few companies are considered rare. Rare and valuable resources grant temporary competitive advantage. On the other hand, the situation when more than few companies have the same resource or uses the capability in the similar way, leads to competitive parity. This is because firms can use identical resources to implement the same strategies and no organization can achieve superior performance. Even though competitive parity is not the desired position, a firm should not neglect the resources that are valuable but common. Losing valuable resources and capabilities would hurt an organization because they are essential for staying in the market. Costly to Imitate A resource is costly to imitate if other organizations that doesn’t have it can’t imitate, buy or substitute it at a reasonable price. Imitation can occur in two ways: by directly imitating (duplicating) the resource or providing the comparable product/service (substituting). A firm that has valuable, rare and costly to imitate resources can (but not necessarily will) achieve sustained competitive advantage. Barney has identified three reasons why resources can be hard to imitate: • Historical conditions. Resources that were developed due to historical events or over a long period usually are costly to imitate. • Causal ambiguity. Companies can’t identify the particular resources that are the cause of competitive advantage. • Social Complexity. The resources and capabilities that are based on company’s culture or interpersonal relationships. Organized to Capture Value The resources itself do not confer any advantage for a company if it’s not organized to capture the value from them. A firm must organize its management systems, processes, policies, organizational structure and culture to be able to fully realize the potential of its valuable, rare and costly to imitate resources and capabilities. Only then the companies can achieve sustained competitive advantage. How to use the tool? Step 1. Identify valuable, rare and costly to imitate resources There are two types of resources: tangible and intangible. Tangible assets are physical things like land, buildings and machinery. Companies can easily by them in the market so tangible assets are rarely the source of competitive advantage. On the other hand, intangible assets, such as brand reputation, trademarks, intellectual property, unique training system or unique way of performing tasks, can’t be acquired so easily and offer the benefits of sustained competitive advantage. Therefore, to find valuable, rare and costly to imitate resources, you should first look at company’s intangible assets. Finding valuable resources: An easy way to identify such resources is to look at the value chain and SWOT analyses. Value chain analysis identifies the most valuable activities, which are the source of cost or differentiation advantage. By looking into the analysis, you can easily find the valuable resources or capabilities. In addition, SWOT analysis recognizes the strengths of the company that are used to exploit opportunities or defend against threats (which is exactly what a valuable resource does). If you still struggle finding valuable resources, you can identify them by asking the following questions: • Which activities lower the cost of production without decreasing perceived customer value?
- 21. • Which activities increase product or service differentiation and perceived customer value? • Have your company won an award or been recognized as the best in something? (most innovative, best employer, highest customer retention or best exporter) • Do you have an access to scarce raw materials or hard to get in distribution channels? • Do you have special relationship with your suppliers? Such as tightly integrated order and distribution system powered by unique software? • Do you have employees with unique skills and capabilities? • Do you have brand reputation for quality, innovation, customer service? • Do you do perform any tasks better than your competitors do? (Benchmarking is useful here) • Does your company hold any other strengths compared to rivals? Finding rare resources: • How many other companies own a resource or can perform capability in the same way in your industry? • Can a resource be easily bought in the market by rivals? • Can competitors obtain the resource or capability in the near future? Finding costly to imitate resources: • Do other companies can easily duplicate a resource? • Can competitors easily develop a substitute resource? • Do patents protect it? • Is a resource or capability socially complex? • Is it hard to identify the particular processes, tasks, or other factors that form the resource? Step 2. Find out if your company is organized to exploit these resources Following questions might be helpful: • Does your company have effective strategic management process in organization? • Are there effective motivation and reward systems in place? • Does your company’s culture reward innovative ideas? • Is an organizational structure designed to use a resource? • Are there excellent management and control systems? Step 3. Protect the resources When you identified a resource or capability that has all 4 VRIO attributes, you should protect it using all possible means. After all, it is the source of your sustained competitive advantage. The first thing you should do is to make the top management aware of such resource and suggest how it can be used to lower the costs or to differentiate the products and services. Then you should think of ideas how to make it more costly to imitate. If other companies won’t be able to imitate a resource at reasonable prices, it will stay rare for much longer. Step 4. Constantly review VRIO resources and capabilities
- 22. The value of the resources changes over time and they must be reviewed constantly to find out if they are as valuable as they once were. Competitors are also keen to achieve the same competitive advantages so they’ll be keen to replicate the resources, which means that they will no longer be rare. Often, new VRIO resources or capabilities are developed inside an organization and by identifying them you can protect you sources of competitive advantage more easily. Q.9. EXPLAIN GE nine cell Matrix. STATE ITS ADVANTAGES AND DISADVANTAGES GE Matrix also called McKinsey Matrix is a strategic management tool for conducting portfolio analysis. The portfolio which is analyzed with the matrix may include products, services or entire SBUs (strategic business units) owned by the company. This tool is very similar to the BCG Matrix and you can actually view the GE or McKinsey Matrix is a kind of extension of the BCG Matrix (the multifactor portfolio analysis tool). The main difference is that the GE Matrix compares different products or businesses on "Business Strength" and "Market Attractiveness" variables and in addition the size of the bubbles represents the market size instead of the business sales or revenue used in the BCG Matrix and the share of the market or business sales vs. market size is represented as a pie chart inside the bubbles. GE Matrix Excel Chart Template This allows the business user to easily analyze and compare business strength, market attractiveness, market size, and market share for different strategic business units (SBUs) or different product offerings. This strategic portfolio analysis tool has been initially developed by GE and McKinsey. GE Matrix Positions and Strategy The GE / McKinsey Matrix is actually divided into nine cells. These 9 cells represent the nine alternatives for positioning of any SBU or product / service offering. Based on the strength of the business and its market attractiveness each SBU will have a different position in the matrix. Further, the market size and the current sales will distinguish each SBU. Based on clear understanding of all of these factors decision makers are able to develop effective strategies. The nine cells in the matrix can be grouped into three major segments: Segment 1: This is mostly the best segment. The business in this position is strong and the market is attractive. In this case the company should allocate resources in this business and focus on growing the business and increase its current market share. Segment 2: The business is either strong but the market is not attractive or the market is strong and the business is not strong enough to pursue potential
- 23. opportunities. Decision makers should make judgment on how to further deal with these SBUs or products. Some of them may consume to much resources and are not really promising any strong potential while others may need additional resources and better strategy for growth. Segment 3: This is the worst positioning segment. Businesses or products and services in this segment are very weak and their market is not attractive. Decision makers should consider either repositioning these SBUs into a different market segment, develop better cost-effective offering, or get rid of these SBUs and invest the resources into more promising and attractive SBUs. Advantages : 1) It used 9 cells instead of 4 cells of BCG 2) It considers many variables and does not lead to simplistic conclusions 3) High/medium/low and strong/average/low classification enables a finer distinction among business portfolio 4) It uses multiple factors to assess industry attractiveness and business strength, which allow users to select criteria appropriate to their situation Limitations : 1) It can get quite complicated and cumbersome with the increase in businesses 2) Though industry attractiveness and business strength appear to be objective, they are in reality subjective judgements that may vary from one person to another 3) It cannot effectively depict the position of new business units in developing industry 4) It only provides broad strategic prescriptions rather than specifics of business policy Q.10. WHAT IS MERGER AND ACQUISATION. EXPLAIN DIFFERENT TYPE OF MERGER AND ACQUSITION. Ans: A merger refers to the process whereby at least two companies combine to form one single company. Business firms make use of mergers and acquisitions for consolidation of markets as well as for gaining a competitive edge in the industry. Merger types can be broadly classified into the following five subheads as described below. They are Horizontal Merger, Conglomeration, Vertical Merger, Product-Extension Merger and Market-Extension Merger. Horizontal Merger refers to the merger of two companies who are direct competitors of one another. They serve the same market and sell the same product. Delta and Nothwest Airline Merger in USA is an example
- 24. Conglomeration refers to the merger of companies, which do not either sell any related products or cater to any related markets. Here, the two companies entering the merger process do not possess any common business ties. Vertical Merger is effected either between a company and a customer or between a company and a supplier. Product-Extension Merger is executed among companies, which sell different products of a related category. They also seek to serve a common market. This type of merger enables the new company to go in for a pooling in of their products so as to serve a common market, which was earlier fragmented among them. Acquisition essentially means ‘to acquire’ or ‘to takeover’. And when we talk about acquisition, it is always clubbed with mergers. In short mergers and acquisitions are referred to as M&A. The process of acquisition is a case of dominance of one company over the other. Here a bigger company will take over the shares and assets of the smaller company and either run it under the bigger company’s name or might run it under a combined name. Types There are four types of acquisitions: Friendly acquisition Both the companies approve of the acquisition under friendly terms. There is no forceful acquisition and the entire process is cordial. Reverse acquisition A private company takes over a public company. Back flip acquisition A very rare case of acquisition in which, the purchasing company becomes a subsidiary of the purchased company. Hostile acquisition Here, as the name suggests, the entire process is done by force. The smaller company is either driven to such a condition that it has no option but to say yes to the acquisition to save its skin or the bigger company just buys off all its share, their by establishing majority and hence initiating the acquisition Q- 10- EXPLAIN STRATEGIC CONTROL SYSTEMS AND TYPES OF CONTROL Strategic control systems provide managers with required information to find out whether strategy and structure move in the same direction. It includes target setting, monitoring, evaluation and feedback system. The importance of strategic control • Achieving operational efficiency
- 25. • Maintaining focus on quality • Fostering innovation • Insuring responsiveness to customers Strategic control process The basic control process involves mainly these steps as shown in Figure a) The Establishment of Standards:
- 26. Because plans are the standards against which controls must be revised, it follows logically that the first step in the control process would be to accomplish plans. Plans can be considered as the criterion or the standards against which we compare the actual performance in order to figure out the deviations. Examples for the standards • Profitability standards: In general, these standards indicate how much the company would like to make as profit over a given time period- that is, its return on investment. • Market position standards: These standards indicate the share of total sales in a particular market that the company would like to have relative to its competitors. • Productivity standards: How much that various segments of the organization should produce is the focus of these standards. • Product leadership standards: These indicate what must be done to attain such a position. • Employee attitude standards: These standards indicate what types of attitudes the company managers should strive to indicate in the company’s employees. • Social responsibility standards: Such as making contribution to the society. • Standards reflecting the relative balance between short and long range goals. b) Measurement of Performance: The measurement of performance against standards should be on a forward looking basis so that deviations may be detected in advance by appropriate actions. The degree of difficulty in measuring various types of organizational performance, of course, is determined primarily by the activity being measured. For example, it is far more difficult to measure the performance of highway maintenance worker than to measure the performance of a student enrolled in a college level management course. c) Comparing Measured Performance to Stated Standards: When managers have taken a measure of organizational performance, their next step in controlling is to compare this measure against some standard. A standard is the level of activity established to serve as a model for evaluating organizational performance. The performance evaluated can be for the organization as a whole or for some individuals working within the organization. In essence, standards are the yardsticks that determine whether organizational performance is adequate or inadequate.
- 27. d) Taking Corrective Actions: After actual performance has been measured compared with established performance standards, the next step in the controlling process is to take corrective action, if necessary. Corrective action is managerial activity aimed at bringing organizational performance up to the level of performance standards. In other words, corrective action focuses on correcting organizational mistakes that hinder organizational performance. Before taking any corrective action, however, managers should make sure that the standards they are using were properly established and that their measurements of organizational performance are valid and reliable. At first glance, it seems a fairly simple proposition that managers should take corrective action to eliminate problems - the factors within an organization that are barriers to organizational goal attainment. In practice, however, it is often difficult to pinpoint the problem causing some undesirable organizational effect. Levels of strategic control The various levels of strategic control are
- 28. a) Corporate level control: The corporate level control is done by the top level management. They set controls which provide context for the divisional level managers. b) Divisional level control: The divisional level control is done by the managers of the division. They set controls which provide context for the functional managers. c) Functional level control: The functional level control is done by the managers of each department. They set controls which provide context for the first level managers. d) First level control: The first level control is done by the first line managers. They set controls which provide context for the workers. Types of control systems The various types of the control systems are a) Financial Controls Since one of the primary purposes of every business firm is to earn a profit, managers need financial controls. Two specific financial controls include budgets and financial ratio analysis. i) Budgets act as a planning tool and control tools as well. They provide managers with quantitative standards against which to measure and compare resource consumption. ii) Financial ratios are calculated by taking numbers from the organization's primary financial statements the income statement and the balance sheet.
- 29. b) Operations Controls Operations control techniques are designed to assess how efficiently and effectively an organization's transformation processes are working.. However, two operations control tools deserve elaboration: TQM control charts and EOQ model. i) Control charts show results of measurements over a period of time with statistically determined upper and lower limits. They provide a visual means of determining whether a specific process is staying within predefined limits ii) The EOQ model helps managers know how much inventory to order and how often to order. The EOQ model seeks to balance four costs associated with ordering and carrying inventory. c) Behavioral Controls Managers accomplish organizational goals by working with other people. It's important for managers to ensure that employees are performing as they're supposed to. We'll be looking at three explicit ways that managers control employee behavior: direct supervision, performance appraisals, and discipline. i) Direct supervision is the daily overseeing of employees' work performance and correcting problems as they occur. It is also known as MBWA (management by walking around). ii) Performance appraisal is the evaluation of an individual's work performance in order to arrive at objective personnel decisions. iii) Discipline includes actions taken by a manager to enforce the organization's standards and regulations. The most common types of discipline problems involve attendance, on-the-job behaviors, dishonesty, and outside activities. Q-12 – DEFINE STRATEGIC MANAGEMENT. EXPLAIN STRATEGIC PLANNING PROCESS
- 30. Strategic management is defined as the art and science of formulating, implementing, and evaluating cross-functional decisions that enable the organization to achieve its objectives." Generally, strategic management is not only related to a single specialization but covers cross-functional or overall organization. • Strategic management is a comprehensive area that covers almost all the functional areas of the organization. It is an umbrella concept of management that comprises all such functional areas as marketing, finance & account, human resource, and production & operation into a top level management discipline. Therefore, strategic management has an importance in the organizational success and failure than any specific functional areas. • Strategic management deals with organizational level and top level issues whereas functional or operational level management deals with the specific areas of the business. • Top-level managers such as Chairman, Managing Director, and corporate level planners involve more in strategic management process. • Strategic management relates to setting vision, mission, objectives, and strategies that can be the guideline to design functional strategies in other functional areas • Therefore, it is top-level management that paves the way for other functional or operational management in an organization Definition: “The determination of the basic long-term goals & objectives of an enterprise and the adoption of the course of action and the allocation of resources necessary for carrying out these goals”. -Chandler STRATEGIC MANAGEMENT MODEL / STRATEGIC PLANNING PROCESS In today's highly competitive business environment, budget-oriented planning or forecast-based planning methods are insufficient for a large corporation to survive and prosper. The firm must engage in strategic planning that clearly defines objectives and assesses both the internal and external situation to formulate strategy, implement the strategy, evaluate the progress, and make adjustments as necessary to stay on track. A simplified view of the strategic planning process is shown by the following diagram:
- 31. a) STRATEGIC INTENT Strategic intent takes the form of a number of corporate challenges and opportunities, specified as short term projects. The strategic intent must convey a significant stretch for the company, a sense of direction, which can be communicated to all employees. It should not focus so much on today's problems, but rather on tomorrow's opportunities. Strategic intent should specify the competitive factors, the factors critical to success in the future.
- 32. Strategic intent gives a picture about what an organization must get into immediately in order to use the opportunity. Strategic intent helps management to emphasize and concentrate on the priorities. Strategic intent is, nothing but, the influencing of an organization’s resource potential and core competencies to achieve what at first may seem to be unachievable goals in the competitive environment. b) Environmental Scan The environmental scan includes the following components: • Analysis of the firm (Internal environment) • Analysis of the firm's industry (micro or task environment) • Analysis of the External macro environment (PEST analysis) The internal analysis can identify the firm's strengths and weaknesses and the external analysis reveals opportunities and threats. A profile of the strengths, weaknesses, opportunities, and threats is generated by means of a SWOT analysis An industry analysis can be performed using a framework developed by Michael Porter known as Porter's five forces. This framework evaluates entry barriers, suppliers, customers, substitute products, and industry rivalry. c) Strategy Formulation Strategy Formulation is the development of long-range plans for the effective management of environmental opportunities and threats, in light of corporate strengths & weakness. It includes defining the corporate mission, specifying achievable objectives, developing strategy & setting policy guidelines. i) Mission Mission is the purpose or reason for the organization’s existence. It tells what the company is providing to society, either a service like housekeeping or a product like automobiles. ii) Objectives Objectives are the end results of planned activity. They state what is to be accomplished by when and should be quantified, if possible. The achievement of corporate objectives should result in the fulfillment of a corporation’s mission. iii) Strategies
- 33. Strategy is the complex plan for bringing the organization from a given posture to a desired position in a future period of time. d) Policies A policy is a broad guide line for decision-making that links the formulation of strategy with its implementation. Companies use policies to make sure that employees throughout the firm make decisions & take actions that support the corporation’s mission, objectives & strategy. d) Strategy Implementation It is the process by which strategy & policies are put into actions through the development of programs, budgets & procedures. This process might involve changes within the overall culture, structure and/or management system of the entire organization. i) Programs: It is a statement of the activities or steps needed to accomplish a single-use plan. It makes the strategy action oriented. It may involve restructuring the corporation, changing the company’s internal culture or beginning a new research effort. ii) Budgets: A budget is a statement of a corporations program in terms of dollars. Used in planning & control, a budget lists the detailed cost of each program. The budget thus not only serves as a detailed plan of the new strategy in action, but also specifies through proforma financial statements the expected impact on the firm’s financial future iii) Procedures: Procedures, sometimes termed Standard Operating Procedures (SOP) are a system of sequential steps or techniques that describe in detail how a particular task or job is to be done. They typically detail the various activities that must be carried out in order to complete e) Evaluation & Control After the strategy is implemented it is vital to continually measure and evaluate progress so that changes can be made if needed to keep the overall plan on track. This is known as the control phase of the strategic planning process. While it may be
- 34. necessary to develop systems to allow for monitoring progress, it is well worth the effort. This is also where performance standards should be set so that performance may be measured and leadership can make adjustments as needed to ensure success. Evaluation and control consists of the following steps: i) Define parameters to be measured ii) Define target values for those parameters iii) Perform measurements iv) Compare measured results to the pre-defined standard v) Make necessary changes