Contenu connexe
Plus de Tobiah Bilski (20)
JLL Pittsburgh Office Insight & Statistics - Q4 2016
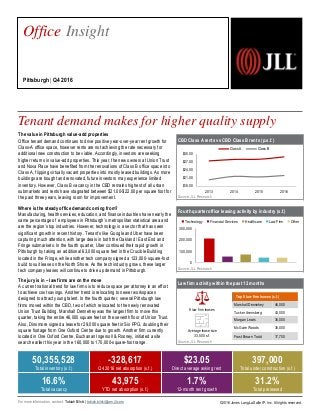
- 1. CBD Class A rents vs CBD Class B rents (p.s.f.)
Source: JLL Research
Fourth quarter office leasing activity by industry (s.f.)
Source: JLL Research
Law firm activity within the past 12 months
Source: JLL Research
The value in Pittsburgh value-add properties
Office tenant demand continues to drive positive year-over-year rent growth for
Class-A office space, however rents are not achieving the rate necessary for
additional new construction to be viable. Accordingly, investors are seeking
higher returns in value-add properties. This year, the new owners at Union Trust
and Nova Place have benefited from the renovations of Class B office space into
Class A, flipping virtually vacant properties into mostly leased buildings. As more
buildings are bought and renovated, future investors may experience limited
inventory. However, Class B vacancy in the CBD remains highest of all urban
submarkets and rents have stagnated between $21.00-$22.00 per square foot for
the past three years, leaving room for improvement.
Where is the steady office demand coming from?
Manufacturing, health services, education, and finance industries have nearly the
same percentage of employees in Pittsburgh’s metropolitan statistical area and
are the region’s top industries. However, technology is a sector that has seen
significant growth in recent history. Tenant’s like Google and Uber have been
capturing much attention, with large deals in both the Oakland / East End and
Fringe submarkets. In the fourth quarter, Uber continued their rapid growth in
Pittsburgh by taking an additional 63,000 square feet in the Crucible Building
located in the Fringe, while another tech company signed a 123,000-square-foot
build to suit lease on the North Shore. As the tech industry grows, these larger
tech company leases will continue to drive up demand in Pittsburgh.
The jury is in – law firms are on the move
A current national trend for law firms is to reduce space per attorney in an effort
to achieve cost savings. Another trend is relocating to newer workspaces
designed to attract young talent. In the fourth quarter, several Pittsburgh law
firms moved within the CBD, two of which relocated to the newly renovated
Union Trust Building. Marshall Dennehey was the largest firm to move this
quarter, taking the entire 46,000 square feet on the seventh floor of Union Trust.
Also, Dinsmore signed a lease for 29,000 square feet in Six PPG, doubling their
square footage from One Oxford Centre due to growth. Another firm currently
located in One Oxford Centre, Buchanan Ingersoll & Rooney, initiated a site
search earlier this year in the 160,000 to 170,000-square-foot range.
2,257
Office Insight
Pittsburgh | Q4 2016
50,355,528
Total inventory (s.f.)
-328,617
Q4 2016 net absorption (s.f.)
$23.05
Direct average asking rent
397,000
Total under construction (s.f.)
16.6%
Total vacancy
43,975
YTD net absorption (s.f.)
1.7%
12-month rent growth
31.2%
Total preleased
©2016 Jones Lang LaSalle IP, Inc. All rights reserved.For more information, contact: Tobiah Bilski | tobiah.bilski@am.jll.com
Tenant demand makes for higher quality supply
$18.00
$21.00
$24.00
$27.00
$30.00
2013 2014 2015 2016
Class A Class B
0
100,000
200,000
300,000
Technology Financial Services Healthcare Law Firm Other
8.0%
9 law firm leases
Average lease size
33,500 s.f.
Top 5 law firm leases (s.f.)
Marshall Dennehey 46,000
Tucker Arensberg 43,000
Morgan Lewis 36,000
McGuire Woods 36,000
Frost Brown Todd 17,700
- 2. Current conditions – submarket Historical leasing activity (s.f.)
Source: JLL Research Source: JLL Research
Total net absorption (s.f.)
Source: JLL Research
Total vacancy rate (%)
Source: JLL Research
Direct average asking rent ($ p.s.f.)
Source: JLL Research
1,614,997
12,115
293,166 227,090
1,015,146
195,790 214,337
742,463
406,913
43,975
-30,000
570,000
1,170,000
1,770,000
2007 2008 2009 2010 2011 2012 2013 2014 2015 2016
$20.14
$20.44
$20.21
$20.42
$20.60
$20.97
$21.29
$21.99
$22.69
$23.05
$19.50
$20.75
$22.00
$23.25
2007 2008 2009 2010 2011 2012 2013 2014 2015 2016
15.5%
16.3%
16.9% 17.0%
15.3% 15.4%
15.9% 15.9% 15.8%
16.6%
13.0%
15.0%
17.0%
19.0%
2007 2008 2009 2010 2011 2012 2013 2014 2015 2016
Landlordleverage
Tenantleverage
Peaking
market
Falling
market
Bottoming
market
Rising
market
4,500,000
4,000,000
5,000,000
4,500,000
4,100,000
0
1,500,000
3,000,000
4,500,000
6,000,000
2012 2013 2014 2015 2016
©2016 Jones Lang LaSalle IP, Inc. All rights reserved.
Suburbs
CBD
Pittsburgh
For more information, contact: Tobiah Bilski | tobiah.bilski@am.jll.com
- 3. Class Inventory (s.f.)
Total net
absorption
(s.f.)
YTD total net
absorption
(s.f.)
YTD total net
absorption (%)
Direct vacancy
(%)
Total vacancy
(%)
Average direct
asking rent ($
p.s.f.)
YTD
completions
(s.f.)
Under
construction
(s.f.)
CBD Totals 18,928,135 -150,589 66,636 0.4% 12.2% 14.0% $25.95 128,000 0
Fringe Totals 7,526,595 93,128 182,078 2.4% 12.9% 13.5% $23.02 105,000 105,000
Oakland/East End Totals 1,993,356 -1,078 218,961 11.0% 8.2% 8.4% $33.46 209,000 0
Urban Totals 28,448,086 -58,539 467,675 1.6% 12.1% 13.5% $25.43 442,000 105,000
North Totals 3,417,734 4,861 -35,348 -1.0% 9.4% 9.6% $21.45 168,000 168,000
Northern I-79/Cranberry Totals 3,442,781 -86,380 -113,697 -3.3% 11.8% 16.5% $23.82 0 0
East Totals 3,045,135 -70,341 -108,533 -3.6% 34.2% 36.0% $20.29 0 0
South Totals 2,267,259 188 33,552 1.5% 10.4% 10.4% $20.45 0 0
Southpointe Totals 2,822,107 -88,406 -225,600 -8.0% 23.6% 27.6% $22.88 150,000 80,000
West Totals 6,912,426 -30,000 25,926 0.4% 20.5% 21.8% $20.91 90,000 44,000
Suburban Totals 21,907,442 -270,078 -423,700 -1.9% 18.7% 20.6% $21.29 408,000 292,000
Pittsburgh Totals 50,355,528 -328,617 43,975 0.1% 15.0% 16.6% $23.05 850,000 397,000
CBD A 13,102,880 -233,069 -265,150 -2.0% 9.8% 11.9% $28.94 128,000 0
Fringe A 1,905,907 169,117 294,205 15.4% 4.7% 5.6% $24.12 105,000 105,000
Oakland/East End A 969,243 -751 213,198 22.0% 13.7% 14.0% $36.23 209,000 0
Urban A 15,978,030 -64,703 242,253 1.5% 9.4% 11.3% $29.23 442,000 105,000
North A 706,347 10,298 -8,969 -1.3% 9.0% 9.4% $24.71 168,000 138,000
Northern I-79/Cranberry A 2,766,249 -19,230 50,527 1.8% 9.7% 13.7% $24.75 0 0
East A 1,580,784 -24,889 -76,203 -4.8% 32.9% 34.2% $22.26 0 0
South A 0 0 0 0.0% 0.0% 0.0% $0.00 0 0
Southpointe A 1,759,754 -1,744 -79,910 -4.5% 16.1% 20.8% $23.82 150,000 80,000
West A 3,767,504 -10,675 -15,207 -0.4% 17.3% 19.6% $22.61 90,000 0
Suburban A 10,580,638 -46,240 -129,762 -1.2% 16.9% 19.7% $23.33 408,000 218,000
Pittsburgh A 26,558,668 -110,943 112,491 0.4% 12.4% 14.7% $25.93 850,000 323,000
CBD B 5,825,255 82,480 331,786 5.7% 17.6% 18.6% $21.97 0 0
Fringe B 5,620,688 -75,989 -112,127 -2.0% 15.6% 16.2% $22.90 0 0
Oakland/East End B 1,024,113 -327 5,763 0.6% 3.0% 3.0% $21.41 0 0
Urban B 12,470,056 6,164 225,422 1.8% 15.5% 16.2% $22.40 0 0
North B 2,711,387 -5,437 -26,379 -1.0% 9.5% 9.7% $18.63 0 30,000
Northern I-79/Cranberry B 676,532 -67,150 -164,224 -24.3% 20.5% 28.2% $21.89 0 0
East B 1,464,351 -45,452 -32,330 -2.2% 35.7% 38.0% $18.68 0 0
South B 2,267,259 188 33,552 1.5% 10.4% 10.4% $20.45 0 0
Southpointe B 1,062,353 -86,662 -145,690 -13.7% 36.0% 39.0% $22.16 0 0
West B 3,144,922 -19,325 41,133 1.3% 24.4% 24.4% $19.51 0 44,000
Suburban B 11,326,804 -223,838 -293,938 -2.6% 20.3% 21.4% $19.86 0 74,000
Pittsburgh B 23,796,860 -217,674 -68,516 -0.3% 17.8% 18.7% $20.91 0 74,000
Office Statistics
Pittsburgh | Q4 2016
©2016 Jones Lang LaSalle IP, Inc. All rights reserved.For more information, contact: Tobiah Bilski | tobiah.bilski@am.jll.com