Contenu connexe
Similaire à Williams sonoma model (20)
Williams sonoma model
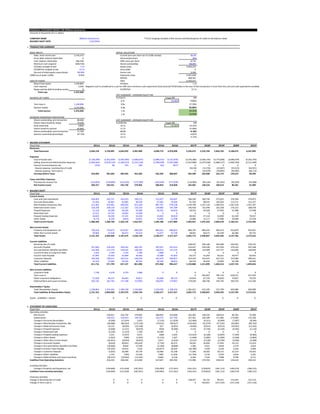
- 1. FINANCIAL STATEMENT MODEL FOR Williams-Sonoma Inc. FALSE 2
Amounts in thousands of U.S. dollars
COMPANY NAME Williams-Sonoma Inc. **Error trapping included in Net income and Revolving line of credit on the balance sheet
BALANCE SHEET DATE 1/31/2016
x TRANSACTION SUMMARY
BASIC INPUTS INITIAL VALUATION
Sales, most recent year 5,234,472 Current price per share (as of 12/06 closing) 56.29
Gross debt, balance sheet date 0 Discount/premium 20%
Cash, balance sheet date 366,540 Offer price per share 67.55
Minimum cash required (369,744) Shares outstanding 88,000
EV/Sales multiple at exit 1.1x Equity value 5,944,224
EV/EBITDA multiple at exit 12.7x Gross debt 0
Percent of initial equity repurchased 90.00% Excess cash 3,204
LIBOR (as of week 12/06) 0.93% Enterprise value 5,947,428
EBITDA 468,361
USES OF FUNDS Sales 5,234,472
Repurchase equity 5,349,802 EV/Sales 1.1x
Cash required 3,204 Negative cash is considered as a use for KKR since minimum cash requirment (Cash forecast*2018 Sales) in the year of the transaction is more than the cash and cash equivalents available.
Repay existing debt (including revolve 0 EV/EBITDA 12.7x
Total uses 5,353,006
EXIT SUMMARY - SPONSOR EQUITY IRR
SOURCES OF FUNDS EV/SALES Target IRR IRR
0.7x 25.00% 9.82%
Term loan A 1,100,000 0.9x 17.55%
Sponsor equity 4,253,006 1.1x 23.85%
Total sources 5,353,006 1.3x 29.22%
1.5x 33.93%
SPONSOR OWNERSHIP PERCENTAGE
Shares outstanding, pre-transaction 88,000 EXIT SUMMARY - SPONSOR EQUITY IRR
Shares repurchased by target 79,200 EV/EBITDA Target IRR IRR
Stub ownership 8,800 10.7x 25.00% -14.42%
Shares issued to sponsor 62,963 11.7x -11.68%
Shares outstanding, post-transaction 71,763 12.7x -9.18%
Sponsor ownership percentage 87.74% 13.7x -6.87%
14.7x -4.72%
x INCOME STATEMENT
Fiscal Year 2011A 2012A 2013A 2014A 2015A 2016A 2017P 2018P 2019P 2020P 2021P
Revenues
Total Revenues 3,504,158 3,720,895 4,042,870 4,387,889 4,698,719 4,976,090 5,234,472 5,516,769 5,826,702 6,168,675 6,547,895
Expenses
Cost of Goods Sold (2,130,299) (2,261,039) (2,450,394) (2,683,673) (2,898,215) (3,131,876) (3,376,386) (3,566,735) (3,775,838) (4,006,679) (4,262,793)
Selling, General and Administrative Expenses (1,050,445) (1,078,124) (1,183,313) (1,252,118) (1,298,239) (1,355,580) (1,557,086) (1,675,558) (1,806,127) (1,950,704) (2,111,569)
Interest Income/expense-net (354) 98 793 584 (62) (627) 0 0 0 0 0
Interest expense, revolving line of credit (6,610) (15,726) (22,667) (32,613) (44,921)
Interest expense, Term loan A 0 (32,670) (59,895) (49,005) (38,115)
Earnings before Taxes 323,060 381,830 409,956 452,682 502,203 488,007 294,390 226,080 162,176 129,674 90,496
Taxes and Other Expenses
Provision for Income Tax (122,833) (144,899) (153,226) (173,780) (193,349) (177,939) (110,985) (85,526) (61,562) (49,393) (34,588)
Net Income (Loss) 200,227 236,931 256,730 278,902 308,854 310,068 183,405 140,554 100,614 80,281 55,909
x BALANCE SHEET
Fiscal Year 2011A 2012A 2013A 2014A 2015A 2016A 2017P 2018P 2019P 2020P 2021P
Current Assets
Cash and Cash Equivalents 628,403 502,757 424,555 330,121 222,927 193,647 366,540 369,744 373,022 376,394 379,873
Accounts Receivables 41,565 45,961 62,985 60,330 67,465 79,304 91,764 98,075 105,024 112,711 121,257
Merchandise Inventories, Net 513,381 553,461 640,024 813,160 887,701 978,138 1,194,740 1,247,120 1,304,453 1,367,534 1,437,297
Deferred Income Taxes 118,258 104,126 112,162 135,310 134,883 141,784 146,430 155,444 165,358 176,312 188,478
Prepaid Expenses 21,120 24,188 26,339 35,309 36,265 44,654 39,525 43,269 47,403 51,988 57,098
Restricted Cash 12,512 14,732 16,055 14,289 0 0 0 0 0 0 0
Prepaid Catalog Expenses 36,825 34,294 37,231 33,556 33,942 28,919 40,942 47,110 53,940 61,534 70,017
Other Assets 8,176 9,229 9,819 10,852 13,005 11,438 13,086 15,171 17,480 20,048 22,918
Total Current Assets 1,380,240 1,288,748 1,329,170 1,432,927 1,396,188 1,477,884 1,893,027 1,975,933 2,066,678 2,166,521 2,276,936
Non Current Assets
Property and Equipment, net 730,556 734,672 812,037 849,293 883,012 886,813 884,703 894,342 904,373 914,879 925,931
Other Non Current Assets 20,966 37,418 46,472 54,514 51,077 52,730 58,042 60,572 63,340 66,386 69,755
Total Assets 2,131,762 2,060,838 2,187,679 2,336,734 2,330,277 2,417,427 2,835,772 2,930,847 3,034,392 3,147,785 3,272,622
Current Liabilities
Revolving line of credit 148,037 204,168 303,489 426,931 579,145
Accounts Payable 227,963 218,329 259,162 404,791 397,037 447,412 523,447 539,540 557,033 576,154 597,168
Accrued Salaries, Benefits and Other 122,440 111,774 120,632 138,181 136,012 127,122 128,488 132,909 137,727 143,006 148,820
Current Portion of Long-term Debt 1,542 1,795 1,724 1,785 1,968 0 0 0 0 0 0
Income Taxes Payable 41,997 22,435 41,849 49,365 32,488 67,052 50,272 53,202 56,421 59,977 63,923
Customer Deposits 192,450 190,417 207,415 228,193 261,679 296,827 314,333 332,637 352,752 374,966 399,621
Other Liabilities 25,324 27,049 26,345 38,781 46,764 58,014 46,310 49,443 52,893 56,708 60,949
Total Current Liabilities 611,716 571,799 657,127 861,096 875,948 996,427 1,210,888 1,311,899 1,460,314 1,637,742 1,849,626
Non Current Liabilities
Long-term Debt 7,130 5,478 3,753 1,968 0 0 0 0 0 0 0
Term Loan A 0 942,857 785,714 628,571 471,429
Other Long-term Obligations 51,918 46,537 46,463 59,812 62,698 49,713 63,824 67,159 70,820 74,857 79,333
Deferred Rent and Lease Incentives 202,135 181,762 171,198 157,856 166,925 173,061 179,430 186,746 194,745 203,535 213,246
Shareholders' Equity
Total Shareholders Equity 1,258,863 1,255,262 1,309,138 1,256,002 1,224,706 1,198,226 1,381,631 422,185 522,799 603,080 658,989
Total Liabilities & Shareholders Equity 2,131,762 2,060,838 2,187,679 2,336,734 2,330,277 2,417,427 2,835,772 2,930,847 3,034,392 3,147,785 3,272,622
Assets - (Liabilities + Equity) 0 0 0 0 0 0 0 0 0 0 0
x STATEMENT OF CASHFLOWS
Fiscal Year 2011A 2012A 2013A 2014A 2015A 2016A 2017P 2018P 2019P 2020P 2021P
Operating activities
Net income 236,931 256,730 278,902 308,854 310,068 183,405 140,554 100,614 80,281 55,909
Depreciation 130,553 134,453 149,795 162,273 167,760 167,361 169,184 171,082 173,069 175,160
Change in Accounts Receivables (4,396) (17,024) 2,655 (7,135) (11,839) (12,460) (6,311) (6,949) (7,687) (8,546)
Change in Merchandise Inventories, Net (40,080) (86,563) (173,136) (74,541) (90,437) (216,602) (52,379) (57,333) (63,081) (69,763)
Change in Deferred Income Taxes 14,132 (8,036) (23,148) 427 (6,901) (4,646) (9,015) (9,913) (10,955) (12,165)
Change in Prepaid Expenses (3,068) (2,151) (8,970) (956) (8,389) 5,129 (3,744) (4,134) (4,585) (5,110)
Change in Restricted Cash (2,220) (1,323) 1,766 14,289 0 0 0 0 0 0
Change in Prepaid Catalog Expenses 2,531 (2,937) 3,675 (386) 5,023 (12,023) (6,168) (6,829) (7,594) (8,483)
Change in Other Assets (1,053) (590) (1,033) (2,153) 1,567 (1,648) (2,085) (2,309) (2,568) (2,869)
Change in Other Non Current Assets (16,452) (9,054) (8,042) 3,437 (1,653) (5,312) (2,530) (2,769) (3,046) (3,368)
Change in Accounts Payable (9,634) 40,833 145,629 (7,754) 50,375 76,035 16,093 17,493 19,122 21,014
Change in Accrued Salaries, Benefits and Other (10,666) 8,858 17,549 (2,169) (8,890) 1,366 4,421 4,818 5,279 5,814
Change in Income Taxes Payable (19,562) 19,414 7,516 (16,877) 34,564 (16,780) 2,930 3,220 3,556 3,946
Change in Customer Deposits (2,033) 16,998 20,778 33,486 35,148 17,506 18,303 20,115 22,214 24,655
Change in Other Liabilities 1,725 (704) 12,436 7,983 11,250 (11,704) 3,134 3,450 3,816 4,241
Change in Deferred Rent and Lease Incentives (20,373) (10,564) (13,342) 9,069 6,136 6,369 7,316 7,998 8,790 9,711
Cashflow from Operating Activities 256,335 338,340 413,030 427,847 493,782 175,996 279,703 238,553 216,610 190,145
Investing Activities
Change in Property and Equipment, net (134,669) (211,818) (187,051) (195,992) (171,561) (165,251) (178,823) (181,113) (183,574) (186,212)
Cashflow from Investing Activities (134,669) (211,818) (187,051) (195,992) (171,561) (165,251) (178,823) (181,113) (183,574) (186,212)
Financing Activities
Change in Revolving line of credit 0 0 0 0 0 148,037 56,131 99,321 123,442 152,214
Change in Term Loan A 0 0 0 0 0 0 942,857 (157,143) (157,143) (157,143)
- 2. Change in Current Portion of Long-term Debt 253 (71) 61 183 (1,968) 0 0 0 0 0
Change in Long-term Debt (1,652) (1,725) (1,785) (1,968) 0 0 0 0 0 0
Change in Other Long-term Obligations (5,381) (74) 13,349 2,886 (12,985) 14,111 3,336 3,661 4,037 4,476
Contributions from (payments to) shareholders (240,532) (202,854) (332,038) (340,150) (336,548) 0 (1,100,000) 0 0 0
Cashflow from Financing Activities (247,312) (204,724) (320,413) (339,049) (351,501) 162,148 (97,677) (54,161) (29,663) (453)
Cash - beginning balance 628,403 502,757 424,555 330,121 222,927 193,647 366,540 369,744 373,022 376,394
Change in cash per SCF (125,646) (78,202) (94,434) (107,194) (29,280) 172,893 3,204 3,278 3,372 3,479
Cash - ending balance per SCF 502,757 424,555 330,121 222,927 193,647 366,540 369,744 373,022 376,394 379,873
Cash - ending balance per B/S 502,757 424,555 330,121 222,927 193,647 366,540 369,744 373,022 376,394 379,873
Difference 0 0 0 0 0 0 0 0 0 0
x PROFITABILTY, SOLVENCY AND LIQUIDITY RATIOS
Fiscal Year 2011A 2012A 2013A 2014A 2015A 2016A 2017P 2018P 2019P 2020P 2021P
Profitability ratios
Return on Equity Decomposition
Return on Equity (ROE = CSL x CEL x ROA) 18.85% 20.02% 21.75% 24.90% 25.59% 14.22% 15.58% 21.29% 14.26% 8.86%
Capital Structure Leverage (CSL) 1.67 1.66 1.76 1.88 1.96 2.04 3.20 6.31 5.49 5.09
Common Earnings Leverage (CEL) 100% 100% 100% 100% 100% 100% 100% 100% 100% 100%
Return on Assets (ROA = PM x ATO) 11.30% 12.06% 12.31% 13.24% 13.08% 6.98% 4.87% 3.37% 2.60% 1.74%
Profit Margin (PM) 6.37% 6.34% 6.35% 6.57% 6.24% 3.50% 2.55% 1.73% 1.30% 0.85%
Asset Turnover (ATO) 1.77 1.90 1.94 2.01 2.10 1.99 1.91 1.95 2.00 2.04
Return on Equity (ROE = RONA + FLEV x SPREAD) 18.85% 20.02% 21.75% 24.90% 25.59% 14.22% 15.58% 21.29% 14.26% 8.86%
Return on Net Operating Assets (RONA) 18.02% 19.19% 20.78% 23.68% 24.47% 13.62% 14.53% 18.58% 12.63% 7.90%
Financial Leverage (FLEV) 0.05 0.04 0.05 0.05 0.05 0.04 0.07 0.15 0.13 0.12
Spread (SPREAD = RONA - EIR) 18.13% 20.13% 21.40% 23.62% 23.78% 13.62% 14.53% 18.58% 12.63% 7.90%
RONA = PM x nATO 18.02% 19.19% 20.78% 23.68% 24.47% 13.62% 14.53% 18.58% 12.63% 7.90%
Profit Margin (PM) 6% 6% 6% 7% 6% 4% 3% 2% 1% 1%
Net Operating Asset Turnover (nATO) 2.83 3.03 3.27 3.60 3.92 3.89 5.70 10.76 9.70 9.25
Effecitive Interest Rate (EIR) -0.11% -0.94% -0.62% 0.06% 0.70% 0.00% 0.00% 0.00% 0.00% 0.00%
Liquidity Ratios
Current Ratio 2.25 2.02 1.66 1.59 1.48 1.56 1.51 1.42 1.32 1.23
Quick Ratio 1.29 1.05 0.72 0.58 0.50 0.58 0.56 0.52 0.49 0.45
Solvency Ratio
Debt to equity ratio 0.01 0.00 0.00 0.00 0.00 0.11 1.27 2.31 1.87 1.66
Debt to Assets Ratio 0.14 0.16 0.23 0.21 0.24 0.24 0.56 0.49 0.43 0.38
Interest coverage ratio n.m. n.m. n.m. n.m. n.m. 45.54 5.67 2.96 2.59 2.09
Profit Margin Decomposition
Revenues 100% 100% 100% 100% 100% 100% 100% 100% 100% 100%
Cost of Goods Sold -60.77% -60.61% -61.16% -61.68% -62.94% -64.50% -64.65% -64.80% -64.95% -65.10%
Selling, General and Administrative Expenses -28.97% -29.27% -28.54% -27.63% -27.24% -29.75% -30.37% -31.00% -31.62% -32.25%
Interest Income/expense-net 0.00% 0.02% 0.01% 0.00% -0.01% 0.00% 0.00% 0.00% 0.00% 0.00%
Earnings before Taxes 10.26% 10.14% 10.32% 10.69% 9.81% 5.62% 4.10% 2.78% 2.10% 1.38%
Provision for Income Tax -3.89% -3.79% -3.96% -4.11% -3.58% -2.12% -1.55% -1.06% -0.80% -0.53%
Earnings before Interest (EBI) 6.37% 6.35% 6.36% 6.57% 6.23% 3.50% 2.55% 1.73% 1.30% 0.85%
Turnover Decomposition
Accounts Receivable Turnover 85 74 71 74 68 61 58 57 57 56
Inventory Turnover - Sales 7 7 6 6 5 5 5 5 5 5
Inventory Turnover - Cost of Sales 4 4 4 3 3 3 3 3 3 3
Fixed Asset Turover 5 5 5 5 6 6 6 6 7 7
Intermediate Calculations
Sales 3,720,895 4,042,870 4,387,889 4,698,719 4,976,090 5,234,472 5,516,769 5,826,702 6,168,675 6,547,895
NI 236,931 256,730 278,902 308,854 310,068 183,405 140,554 100,614 80,281 55,909
Int exp (98) (793) (584) 62 627 0 0 0 0 0
ETR 0.38 0.37 0.38 0.39 0.36 0.38 0.38 0.38 0.38 0.38
Int exp, net of tax (61) (497) (360) 38 398 0 0 0 0 0
EBI 236,870 256,233 278,542 308,892 310,466 183,405 140,554 100,614 80,281 55,909
avg A 2,096,300 2,124,259 2,262,207 2,333,506 2,373,852 2,626,600 2,883,309 2,982,619 3,091,089 3,210,204
avg D 57,200 52,875 57,753 64,116 57,190 56,768 65,491 68,989 72,838 77,095
avg E 1,257,063 1,282,200 1,282,570 1,240,354 1,211,466 1,289,929 901,908 472,492 562,939 631,034
avg D+E 1,314,263 1,335,075 1,340,323 1,304,470 1,268,656 1,346,697 967,400 541,482 635,778 708,129
x FORECAST ASSUMPTIONS
Fiscal Year Notes 2011A 2012A 2013A 2014A 2015A 2016A 2017P 2018P 2019P 2020P 2021P
Income Statement Assumptions
Revenues
Retail Net Revenue (1) n.m. n.m. n.m. 2.43% 5.39% 2.09% 1.92% 1.75% 1.58% 1.41%
E-commerce Net Revenues (1) n.m. n.m. n.m. 12.09% 6.41% 8.21% 8.58% 8.95% 9.32% 9.69%
Net Revenues (1) 6.19% 8.65% -100.00% n.m. n.m. 0.00% 0.00% 0.00% 0.00% 0.00%
Expenses
Cost of Goods Sold (2) -60.77% -60.61% -61.16% -61.68% -62.94% -64.50% -64.65% -64.80% -64.95% -65.10%
Selling, General and Administrative Ex (2) -28.97% -29.27% -28.54% -27.63% -27.24% -29.75% -30.37% -31.00% -31.62% -32.25%
Interest Income/expense-net (2) 0.00% 0.02% 0.01% 0.00% -0.01% 0.00% 0.00% 0.00% 0.00% 0.00%
Taxes and Other Expenses
Provision for Income Tax (4) -37.95% -37.38% -38.39% -38.50% -36.46% -37.70% -37.83% -37.96% -38.09% -38.22%
Net Income (Loss)
Balance Sheet Assumptions
Current Assets
Cash and Cash Equivalents (2) 13.51% 10.50% 7.52% 4.74% 3.89% 7.00% 6.70% 6.40% 6.10% 5.80%
Accounts Receivables (2) 1.24% 1.56% 1.37% 1.44% 1.59% 1.75% 1.78% 1.80% 1.83% 1.85%
Merchandise Inventories, Net (2) 14.87% 15.83% 18.53% 18.89% 19.66% 22.82% 22.61% 22.39% 22.17% 21.95%
Deferred Income Taxes (2) 3.18% 2.58% 2.56% 2.88% 2.71% 2.80% 2.82% 2.84% 2.86% 2.88%
Prepaid Expenses (2) 0.65% 0.65% 0.80% 0.77% 0.90% 0.76% 0.78% 0.81% 0.84% 0.87%
Restricted Cash (2) 0.40% 0.40% 0.33% 0.00% 0.00% 0.00% 0.00% 0.00% 0.00% 0.00%
Prepaid Catalog Expenses (2) 0.92% 0.92% 0.76% 0.72% 0.58% 0.78% 0.85% 0.93% 1.00% 1.07%
Other Assets (2) 0.25% 0.24% 0.25% 0.28% 0.23% 0.25% 0.28% 0.30% 0.33% 0.35%
Total Current Assets
Non Current Assets
Property and Equipment, net (2) 19.74% 20.09% 19.36% 18.79% 17.82% 16.90% 16.21% 15.52% 14.83% 14.14%
Other Assets (2) 1.01% 1.15% 1.24% 1.09% 1.06% 1.11% 1.10% 1.09% 1.08% 1.07%
Total Assets
Current Liabilities
Accounts Payable (2) 5.87% 6.41% 9.23% 8.45% 8.99% 10.00% 9.78% 9.56% 9.34% 9.12%
Accrued Salaries, Benefits and Other (2) 3.00% 2.98% 3.15% 2.89% 2.55% 2.45% 2.41% 2.36% 2.32% 2.27%
Current Portion of Long-term Debt (2) 0.05% 0.04% 0.04% 0.04% 0.00% 0.00% 0.00% 0.00% 0.00% 0.00%
Income Taxes Payable (2) 0.60% 1.04% 1.13% 0.69% 1.35% 0.96% 0.96% 0.97% 0.97% 0.98%
Customer Deposits (2) 5.12% 5.13% 5.20% 5.57% 5.97% 6.01% 6.03% 6.05% 6.08% 6.10%
Other Liabilities (2) 0.73% 0.65% 0.88% 1.00% 1.17% 0.88% 0.90% 0.91% 0.92% 0.93%
Total Current Liabilities
Non Current Liabilities
Long-term Debt (2) 0.15% 0.09% 0.04% 0.00% 0.00% 0.00% 0.00% 0.00% 0.00% 0.00%
Other Long-term Obligations (2) 1.25% 1.15% 1.36% 1.33% 1.00% 1.22% 1.22% 1.22% 1.21% 1.21%
Deferred Rent and Lease Incentives (2) 4.88% 4.23% 3.60% 3.55% 3.48% 3.43% 3.39% 3.34% 3.30% 3.26%
notes
(1) Annual growth rate
(2) Percent of sales for year
(3) Percent of average debt (EBI)
- 3. (4) Percent of pre-tax income (ETR)
x EQUITY SCHEDULE
Fiscal Year 2011A 2012A 2013A 2014A 2015A 2016A 2017P 2018P 2019P 2020P 2021P
Equity, BOP 1,198,226 1,381,631 422,185 522,799 603,080
Plus: Net income 183,405 140,554 100,614 80,281 55,909
Less: Planned dividends and net repurchases 0 0 0 0 0
Less: Net repurchases on transaction (1,100,000)
Less: Stock Repurchase using excess cash 0 0 0 0
Equity, EOP 1,198,226 1,381,631 422,185 522,799 603,080 658,989
x REVOLVING LINE OF CREDIT
Fiscal Year 2011A 2012A 2013A 2014A 2015A 2016A 2017P 2018P 2019P 2020P 2021P
Revolver needs analysis
Cash, BOP 193,647 366,540 369,744 373,022 376,394
Less: Minimum cash desired at EOP (366,540) (369,744) (373,022) (376,394) (379,873)
Equals: Excess cash at BOP (172,893) (3,204) (3,278) (3,372) (3,479)
Plus: CFO 175,996 279,703 238,553 216,610 190,145
Plus: CFI (165,251) (178,823) (181,113) (183,574) (186,212)
Plus: Planned debt cash flows 14,111 946,193 (153,482) (153,105) (152,667)
Plus: Planned equity cash flows 0 (1,100,000)
Equals: Cash surplus (shortage) (148,037) (56,131) (99,321) (123,442) (152,214)
Revolving line of credit
Max (85% of AR+50% of inventory) OK 615,924 691,147 724,210 760,534 800,644
Balance, BOP 0 148,037 204,168 303,489 426,931
Increases (decreases) 148,037 56,131 99,321 123,442 152,214
Balance, EOP 148,037 204,168 303,489 426,931 579,145
Revolving line of credit, average balance 74,019 176,102 253,828 365,210 503,038
Interest rate 8.9300% 8.9300% 8.9300% 8.9300% 8.9300%
Interest expense, revolving line of credit 6,610 15,726 22,667 32,613 44,921
x DEBT SCHEDULE
Fiscal Year 2011A 2012A 2013A 2014A 2015A 2016A 2017P 2018P 2019P 2020P 2021P
Coverage ratios
EBITDA 468,361 443,660 415,819 384,361 348,693
Debt/EBITDA OK 0.00 2.1 1.9 1.6 1.4
EBIT/Interest OK 45.54 5.67 2.96 2.59 2.09
Term loan A, BOP 0 0 942,857 785,714 628,571
Planned increases/decreases 0 942,857 (157,143) (157,143) (157,143)
Prepayments with excess cash 0 0 0 0 (0)
Term loan A, EOP 0 942,857 785,714 628,571 471,429
Term loan A, average balance 0 471,429 864,286 707,143 550,000
Interest rate 6.9300% 6.9300% 6.9300% 6.9300% 6.9300%
Interest expense, Term loan A 0 0 32,670 59,895 49,005 38,115
x INTERNAL RATE OF RETURN
EXIT PROCEEDS EXIT SALES MULTIPLE SCENARIOS
Exit EV/SALES Step 0.2x 0.7x 0.9x 1.1x 1.3x 1.5x
Sales 6,547,895 6,547,895 6,547,895 6,547,895 6,547,895
Enterprise Value 4,820,586 6,130,165 7,439,745 8,749,324 10,058,903
Net debt (1,129,906) (1,129,906) (1,129,906) (1,129,906) (1,129,906)
Equity value 3,690,680 5,000,260 6,309,839 7,619,418 8,928,997
Sponsor ownership percentage 87.74% 87.74% 87.74% 87.74% 87.74%
Sponsor equity value 3,238,106 4,387,096 5,536,086 6,685,076 7,834,066
EV/SALES IRR 2017P 2018P 2019P 2020P 2021P
0.7x 10% (4,253,006) 0 0 0 3,238,105.78
0.9x 18% (4,253,006) 0 0 0 4,387,095.94
1.1x 24% (4,253,006) 0 0 0 5,536,086.10
1.3x 29% (4,253,006) 0 0 0 6,685,076.27
1.5x 34% (4,253,006) 0 0 0 7,834,066.43
EXIT PROCEEDS EXIT EBITDA MULTIPLE SCENARIOS
Exit EV/EBITDA Step 1.0x 10.7x 11.7x 12.7x 13.7x 14.7x
EBITDA 348,693 348,693 348,693 348,693 348,693
Enterprise Value 3,730,448 4,079,140 4,427,833 4,776,526 5,125,218
Net debt (1,129,906) (1,129,906) (1,129,906) (1,129,906) (1,129,906)
Equity value 2,600,542 2,949,235 3,297,927 3,646,620 3,995,312
Sponsor ownership percentage 87.74% 87.74% 87.74% 87.74% 87.74%
Sponsor equity value 2,281,647 2,587,581 2,893,514 3,199,448 3,505,382
EV/EBITDA IRR 2017P 2018P 2019P 2020P 2021P
10.7x -14% (4,253,006) 0 0 0 2,281,647
11.7x -12% (4,253,006) 0 0 0 2,587,581
12.7x -9% (4,253,006) 0 0 0 2,893,514
13.7x -7% (4,253,006) 0 0 0 3,199,448
14.7x -5% (4,253,006) 0 0 0 3,505,382
x