
Recommandé
Contenu connexe
Tendances
Tendances (20)
Similaire à REBGV January 2020 Statistics Package
Similaire à REBGV January 2020 Statistics Package (18)
Plus de Vicky Aulakh
Plus de Vicky Aulakh (20)
Dernier
Dernier (20)
REBGV January 2020 Statistics Package
- 1. News Release FOR IMMEDIATE RELEASE: Home sale activity up, supply down to start 2020 VANCOUVER, BC – February 4, 2020 – Home sale and price activity remained steady in Metro Vancouver* to start 2020 while home listing activity declined in January. The Real Estate Board of Greater Vancouver (REBGV) reports that residential home sales in the region totalled 1,571 in January 2020, a 42.4 per cent increase from the 1,103 sales recorded in January 2019, and a 22.1 per cent decrease from the 2,016 homes sold in December 2019. Last month’s sales were 7.3 per cent below the 10-year January sales average. “We've begun 2020 with steady home buyer demand that tracks close to the region's long-term average,” Ashley Smith, REBGV president said. “Looking at supply, we’re seeing fewer homes listed for sale than is typical for this time of year. As we approach the traditionally more active spring market, we’ll keep a close eye on supply to see if the number of homes being listed is keeping pace with demand.” There were 3,872 detached, attached and apartment properties newly listed for sale on the Multiple Listing Service® (MLS®) in Metro Vancouver in January 2020. This represents a 20.1 per cent decrease compared to the 4,848 homes listed in January 2019 and a 143.8 per cent increase compared to December 2019 when 1,588 homes were listed. Last month’s new listings were 17.4 per cent below January’s 10-year average. The total number of homes currently listed for sale on the MLS® system in Metro Vancouver is 8,617, a 20.3 per cent decrease compared to January 2019 (10,808) and a 0.2 per cent increase compared to December 2019 (8,603), and is 13.7 per cent below the 10-year January average. For all property types, the sales-to-active listings ratio for January 2020 is 18.2 per cent. By property type, the ratio is 11.6 per cent for detached homes, 22.6 per cent for townhomes, and 23.9 per cent for apartments. Generally, analysts say downward pressure on home prices occurs when the ratio dips below 12 per cent for a sustained period, while home prices often experience upward pressure when it surpasses 20 per cent over several months.
- 2. The MLS® Home Price Index composite benchmark price for all residential properties in Metro Vancouver is currently $1,008,700. This represents a 1.2 per cent decrease over January 2019, a 1.4 per cent increase over the past six months, and a 0.8 per cent increase compared to December 2019. Sales of detached homes in January 2020 reached 439, a 29.5 per cent increase from the 339 detached sales recorded in January 2019. The benchmark price for detached properties is $1,431,200. This represents a 1.7 per cent decrease from January 2019, a one per cent increase over the past six months, and a 0.5 per cent increase compared to December 2019. Sales of apartment homes reached 814 in January 2020, a 45.6 per cent increase compared to the 559 sales in January 2019. The benchmark price of an apartment property is $663,200. This represents a one per cent decrease from January 2019, a 1.5 per cent increase over the past six months, and a one per cent increase compared to December 2019. Attached home sales in January 2020 totalled 318, a 55.1 per cent increase compared to the 205 sales in January 2019. The benchmark price of an attached unit is $782,500. This represents a 0.7 per cent decrease from January 2019, a 1.6 per cent increase over the past six months, and a 0.5 per cent increase compared to December 2019. -30- *Editor’s Note: Areas covered by the Real Estate Board of Greater Vancouver include: Burnaby, Coquitlam, Maple Ridge, New Westminster, North Vancouver, Pitt Meadows, Port Coquitlam, Port Moody, Richmond, South Delta, Squamish, Sunshine Coast, Vancouver, West Vancouver, and Whistler. The real estate industry is a key economic driver in British Columbia. In 2019, 25,351 homes changed ownership in the Board’s area, generating $1.8 billion in economic spin-off activity and an estimated 12,910 jobs. The total dollar value of residential sales transacted through the MLS® system in Greater Vancouver totalled $25.3 billion in 2019. The Real Estate Board of Greater Vancouver is an association representing more than 14,000 REALTORS® and their companies. The Board provides a variety of member services, including the Multiple Listing Service®. For more information on real estate, statistics, and buying or selling a home, contact a local REALTOR® or visit www.rebgv.org. For more information please contact: Craig Munn Manager, Communication Real Estate Board of Greater Vancouver 604.730.3146 cmunn@rebgv.org
- 3. Property Type Area Benchmark Price Price Index 1 Month Change % 3 Month Change % 6 Month Change % 1 Year Change % 3 Year Change % 5 Year Change % 10 Year Change % Residential / Composite Lower Mainland $951,300 261.8 0.7% 1.2% 0.8% -0.6% 13.9% 60.5% 80.3% Greater Vancouver $1,008,700 262.4 0.8% 1.6% 1.4% -1.2% 10.3% 53.8% 76.7% Bowen Island $918,300 199.1 -1.8% -5.7% -3.4% -5.3% 10.6% 58.1% 50.7% Burnaby East $930,200 258.0 1.2% 0.9% 0.0% -2.7% 8.2% 52.6% 73.3% Burnaby North $873,300 263.7 1.3% 2.6% 0.5% -0.1% 12.1% 59.0% 79.0% Burnaby South $954,800 269.7 1.0% 1.8% 1.0% -3.4% 8.6% 55.2% 82.6% Coquitlam $896,400 265.9 -0.2% 1.4% 0.6% -1.7% 18.5% 64.2% 88.0% Ladner $791,700 222.9 0.3% 1.7% 0.0% -3.8% 1.3% 40.7% 57.7% Maple Ridge $742,700 236.5 -0.8% -0.5% -1.3% -1.3% 20.1% 71.8% 74.9% New Westminster $642,200 282.5 0.7% 0.7% -0.7% -2.3% 22.7% 70.6% 88.1% North Vancouver $1,045,200 234.9 1.6% 2.5% 1.6% 0.4% 6.6% 47.6% 67.7% Pitt Meadows $726,800 264.2 -0.5% -1.1% -2.0% -4.3% 24.4% 73.4% 88.6% Port Coquitlam $745,500 255.2 0.1% 2.4% 0.9% -1.4% 22.5% 70.7% 76.9% Port Moody $903,700 249.8 1.1% 1.0% -1.0% -1.0% 17.9% 65.1% 81.4% Richmond $917,300 272.7 0.6% 0.8% 1.6% -2.9% 8.0% 54.2% 75.8% Squamish $780,400 248.3 0.1% -0.6% 2.3% 3.3% 21.0% 76.3% 100.7% Sunshine Coast $569,700 199.6 -1.7% -5.7% -5.3% -5.8% 12.6% 61.4% 50.3% Tsawwassen $922,000 231.1 0.3% 1.4% -0.8% -2.5% 1.0% 47.3% 67.8% Vancouver East $1,074,300 315.4 1.5% 3.5% 3.9% 0.7% 9.6% 56.5% 97.0% Vancouver West $1,255,900 261.7 1.6% 2.3% 2.7% -1.5% 4.2% 42.5% 68.9% West Vancouver $2,098,900 231.1 -1.0% 0.2% -1.2% -3.1% -11.9% 22.6% 62.7% Whistler $912,700 212.7 -0.5% -0.5% 2.2% 4.0% 26.9% 75.9% 74.3% Single Family Detached Lower Mainland $1,227,500 260.3 0.6% 1.2% 0.7% -0.6% 2.6% 50.1% 82.0% Greater Vancouver $1,431,200 263.3 0.5% 1.5% 1.0% -1.7% -3.2% 40.7% 77.7% Bowen Island $918,300 199.1 -1.8% -5.7% -3.4% -5.3% 10.6% 58.1% 50.7% Burnaby East $1,176,100 263.0 2.5% 2.0% -0.5% 0.7% 2.2% 52.0% 77.5% Burnaby North $1,416,400 273.9 2.0% 3.7% 3.1% 0.1% -4.3% 41.0% 83.8% Burnaby South $1,493,500 285.9 -0.1% 1.4% 1.1% -2.6% -8.7% 40.8% 94.5% Coquitlam $1,170,200 259.7 0.5% 1.6% 0.1% -2.1% 5.6% 50.4% 83.7% Ladner $936,700 225.8 0.1% 2.2% -1.0% -0.7% -3.2% 40.9% 62.4% Maple Ridge $809,800 230.7 0.2% 0.7% -1.7% 0.7% 13.8% 68.4% 74.1% New Westminster $1,043,900 260.4 2.8% 2.6% -0.2% -0.9% 2.1% 52.3% 73.4% North Vancouver $1,536,800 242.0 1.6% 4.9% 3.2% 1.6% -2.9% 44.0% 74.2% Pitt Meadows $877,600 247.3 -0.4% -0.5% -2.5% -2.6% 13.9% 64.5% 76.9% Port Coquitlam $949,200 253.1 -0.3% 3.8% 3.3% 0.6% 13.4% 60.6% 78.7% Port Moody $1,399,800 258.5 0.0% 0.4% -2.9% -3.8% 4.3% 51.8% 84.1% Richmond $1,503,100 291.2 0.5% 0.1% 1.9% -5.0% -7.1% 40.6% 80.3% Squamish $988,100 260.4 1.0% 0.2% 0.7% 4.7% 19.0% 78.7% 103.4% Sunshine Coast $564,900 197.9 -1.7% -5.6% -5.2% -5.9% 12.4% 61.0% 49.0% Tsawwassen $1,157,300 249.2 0.3% 2.4% -1.3% 0.4% -0.4% 52.2% 81.9% Vancouver East $1,407,700 313.1 1.3% 3.5% 4.1% -0.8% -1.0% 44.4% 104.2% Vancouver West $2,929,600 300.4 0.3% 0.6% 1.2% -3.8% -14.2% 24.7% 77.2% West Vancouver $2,566,700 242.3 -0.9% 1.7% 0.7% -2.1% -12.5% 22.5% 71.8% Whistler $1,611,700 224.2 -1.1% -2.9% -2.3% 4.8% 16.2% 59.3% 74.3% HOW TO READ THE TABLE: • Benchmark Price: Estimated sale price of a benchmark property. Benchmarks represent a typical property within each market. • Price Index: Index numbers estimate the percentage change in price on typical and constant quality properties over time. All figures are based on past sales. • x Month/Year Change %: Percentage change of index over a period of x month(s)/year(s) * In January 2005, the indexes are set to 100. Townhome properties are similar to Attached properties, a category that was used in the previous MLSLink HPI, but do not included duplexes. The above info is deemed reliable, but is not guaranteed. All dollar amounts in CDN. January 2020* * MLS®, Multiple Listing Service®, and all related graphics are trademarks of The Canadian Real Estate Association 1 of 16
- 4. Property Type Area Benchmark Price Price Index 1 Month Change % 3 Month Change % 6 Month Change % 1 Year Change % 3 Year Change % 5 Year Change % 10 Year Change % January 2020* Townhouse Lower Mainland $668,600 240.9 0.6% 0.9% 0.6% -0.7% 18.4% 62.7% 71.1% Greater Vancouver $782,500 251.1 0.5% 1.4% 1.6% -0.7% 15.9% 58.2% 73.1% Burnaby East $654,900 241.9 0.7% 0.3% 1.0% -3.7% 18.2% 52.5% 64.1% Burnaby North $720,700 269.0 -0.5% -0.4% -0.3% -0.4% 21.0% 57.9% 82.6% Burnaby South $768,100 264.6 0.7% -1.1% 1.0% -3.1% 12.8% 56.5% 79.1% Coquitlam $664,900 244.0 0.3% 2.5% 1.8% -1.1% 21.3% 63.0% 76.7% Ladner $648,100 230.5 1.5% 2.5% 2.7% -6.7% 7.1% 41.2% 52.6% Maple Ridge $522,300 242.5 -2.1% -1.2% -0.3% -3.0% 25.9% 74.7% 74.5% New Westminster $732,900 268.8 1.2% 1.1% 2.7% -2.0% 20.3% 58.9% 79.7% North Vancouver $947,400 230.2 2.0% 1.2% 0.3% -3.3% 12.3% 54.2% 66.4% Pitt Meadows $598,600 259.0 0.7% 0.1% -0.2% -5.6% 23.8% 72.6% 87.3% Port Coquitlam $621,000 235.1 -0.8% -0.1% -1.7% -2.6% 15.2% 63.3% 65.1% Port Moody $627,300 212.0 0.1% 1.1% -4.5% -2.6% 22.4% 47.1% 53.6% Richmond $775,500 254.6 0.7% 0.3% 0.6% -4.0% 8.3% 50.4% 68.9% Squamish $733,500 241.2 0.2% 3.9% 6.6% 7.7% 22.5% 80.5% 99.7% Tsawwassen $631,300 248.5 4.0% 3.9% 2.9% -6.5% 12.4% 52.3% 64.6% Vancouver East $903,600 289.5 2.6% 6.0% 6.6% 7.5% 18.6% 62.3% 86.5% Vancouver West $1,147,200 268.2 1.0% 3.0% 2.9% 2.3% 8.3% 52.3% 77.3% Whistler $971,400 234.2 2.1% 5.2% 6.1% 9.4% 31.5% 91.8% 95.3% Apartment Lower Mainland $648,300 272.6 0.9% 1.4% 1.0% -0.6% 28.9% 75.0% 81.9% Greater Vancouver $663,200 265.1 1.0% 1.6% 1.5% -1.0% 24.1% 67.6% 76.7% Burnaby East $714,500 274.1 -0.1% 0.4% -0.9% -4.0% 18.6% 59.6% 76.0% Burnaby North $606,900 259.1 1.4% 2.8% -0.4% 0.1% 25.5% 77.5% 77.2% Burnaby South $661,700 265.7 1.5% 2.5% 1.3% -3.8% 20.1% 66.7% 79.4% Coquitlam $521,900 286.4 -1.2% 1.0% 1.1% 1.2% 38.0% 89.5% 100.6% Ladner $430,400 204.0 -0.8% -0.2% -0.5% -7.1% 13.0% 39.2% 46.7% Maple Ridge $342,400 244.5 -1.5% -2.3% -1.5% -4.8% 36.3% 73.9% 72.8% New Westminster $509,900 288.9 0.3% 0.3% -1.0% -2.8% 29.9% 77.1% 92.1% North Vancouver $558,300 227.7 1.6% 0.8% 0.7% 0.3% 19.7% 52.4% 60.4% Pitt Meadows $479,900 283.0 -1.1% -2.2% -1.8% -4.6% 35.6% 81.2% 98.5% Port Coquitlam $450,200 269.2 0.8% 2.9% 0.9% -1.9% 37.1% 87.1% 80.7% Port Moody $640,700 267.0 2.2% 1.6% 1.9% 1.8% 29.9% 89.9% 96.6% Richmond $634,100 271.5 0.6% 1.4% 1.9% -0.9% 30.0% 77.6% 77.8% Squamish $478,800 236.0 -1.6% -6.4% 0.0% -3.6% 26.3% 79.6% 97.3% Tsawwassen $457,200 192.8 -0.3% -1.2% -0.3% -8.1% 12.7% 43.2% 38.6% Vancouver East $568,600 324.5 1.7% 3.0% 3.3% 0.6% 22.7% 71.7% 89.5% Vancouver West $775,700 251.7 2.0% 2.9% 3.1% -1.0% 16.4% 55.9% 67.2% West Vancouver $996,600 202.5 -1.3% -5.0% -8.2% -6.8% 0.1% 35.9% 41.0% Whistler $482,000 188.8 -2.3% -4.3% 1.3% -1.5% 30.2% 77.8% 58.1% HOW TO READ THE TABLE: • Benchmark Price: Estimated sale price of a benchmark property. Benchmarks represent a typical property within each market. • Price Index: Index numbers estimate the percentage change in price on typical and constant quality properties over time. All figures are based on past sales. • x Month/Year Change %: Percentage change of index over a period of x month(s)/year(s) In January 2005, the indexes are set to 100. * Townhome properties are similar to attached properties, a category that was used in the previous MLSLink HPI, but do not included duplexes. Lower Mainland includes areas serviced by both Real Estate Board of Greater Vancouver & Fraser Valley Real Estate Board. The above info is deemed reliable, but is not guaranteed. All dollar amounts in CDN. * MLS®, Multiple Listing Service®, and all related graphics are trademarks of The Canadian Real Estate Association 2 of 16
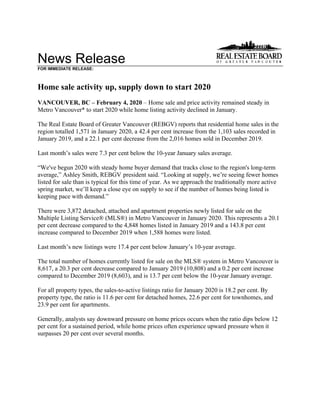
- 5. C:DATAMonthEndHpiexporthi_resgv-hpi2.tifGreaterVancouver 5YearTrend 60 110 160 210 260 310 Jan 2015 Mar 2015 May 2015 Jul 2015 Sep 2015 Nov 2015 Jan 2016 Mar 2016 May 2016 Jul 2016 Sep 2016 Nov 2016 Jan 2017 Mar 2017 May 2017 Jul 2017 Sep 2017 Nov 2017 Jan 2018 Mar 2018 May 2018 Jul 2018 Sep 2018 Nov 2018 Jan 2019 Mar 2019 May 2019 Jul 2019 Sep 2019 Nov 2019 Jan 2020 Price Index ResidentialDetachedTownhouseApartment Jan2005HPI=100
- 8. Listing & Sales Activity Summary Listings Sales 1 2 3 Col. 2 & 3 5 6 7 Col. 6 & 7 9 10 Col. 9 & 10 Jan Dec Jan Percentage Jan Dec Jan Percentage Nov 2018 - Nov 2019 - Percentage 2019 2019 2020 Variance 2019 2019 2020 Variance Jan 2019 Jan 2020 Variance BURNABY % % % DETACHED 142 37 123 232.4 26 50 41 -18.0 90 169 87.8 ATTACHED 123 30 80 166.7 24 59 37 -37.3 65 142 118.5 APARTMENTS 285 100 250 150.0 80 160 124 -22.5 260 495 90.4 COQUITLAM DETACHED 161 42 117 178.6 27 51 41 -19.6 106 181 70.8 ATTACHED 67 19 61 221.1 18 37 32 -13.5 65 109 67.7 APARTMENTS 142 53 124 134.0 42 104 71 -31.7 139 252 81.3 DELTA DETACHED 79 18 70 288.9 16 19 23 21.1 57 79 38.6 ATTACHED 25 9 28 211.1 7 6 13 116.7 23 41 78.3 APARTMENTS 26 22 51 131.8 6 21 20 -4.8 23 60 160.9 MAPLE RIDGE/PITT MEADOWS DETACHED 153 46 130 182.6 39 80 67 -16.3 153 256 67.3 ATTACHED 60 23 71 208.7 33 29 36 24.1 80 108 35.0 APARTMENTS 65 34 55 61.8 20 43 32 -25.6 72 111 54.2 NORTH VANCOUVER DETACHED 171 38 131 244.7 35 56 24 -57.1 116 158 36.2 ATTACHED 77 12 60 400.0 15 25 13 -48.0 63 76 20.6 APARTMENTS 179 59 175 196.6 41 74 63 -14.9 150 237 58.0 NEW WESTMINSTER DETACHED 42 5 28 460.0 10 11 7 -36.4 42 41 -2.4 ATTACHED 17 6 19 216.7 10 9 4 -55.6 21 25 19.0 APARTMENTS 134 39 88 125.6 55 56 38 -32.1 157 182 15.9 PORT MOODY/BELCARRA DETACHED 34 9 24 166.7 8 8 9 12.5 26 29 11.5 ATTACHED 13 8 11 37.5 5 15 12 -20.0 21 41 95.2 APARTMENTS 35 11 28 154.5 18 13 16 23.1 46 46 0.0 PORT COQUITLAM DETACHED 42 14 37 164.3 13 24 22 -8.3 52 74 42.3 ATTACHED 31 17 35 105.9 9 23 15 -34.8 37 58 56.8 APARTMENTS 63 24 55 129.2 16 34 23 -32.4 67 99 47.8 RICHMOND DETACHED 302 87 168 93.1 30 86 52 -39.5 110 205 86.4 ATTACHED 159 59 109 84.7 25 53 63 18.9 94 184 95.7 APARTMENTS 289 99 242 144.4 66 142 101 -28.9 215 379 76.3 SUNSHINE COAST DETACHED 67 37 49 32.4 19 32 21 -34.4 63 100 58.7 ATTACHED 15 6 10 66.7 5 3 4 33.3 13 16 23.1 APARTMENTS 16 17 3 -82.4 2 4 3 -25.0 8 9 12.5 SQUAMISH DETACHED 31 11 28 154.5 8 13 12 -7.7 27 42 55.6 ATTACHED 23 2 16 700.0 8 11 6 -45.5 20 34 70.0 APARTMENTS 17 12 24 100.0 8 12 11 -8.3 22 35 59.1 VANCOUVER EAST DETACHED 195 64 120 87.5 44 74 53 -28.4 143 233 62.9 ATTACHED 67 18 63 250.0 13 35 30 -14.3 62 121 95.2 APARTMENTS 194 78 171 119.2 48 98 78 -20.4 191 321 68.1 VANCOUVER WEST DETACHED 235 66 144 118.2 34 59 35 -40.7 128 159 24.2 ATTACHED 115 35 92 162.9 20 37 30 -18.9 67 101 50.7 APARTMENTS 613 203 500 146.3 133 260 210 -19.2 479 775 61.8 WHISTLER/PEMBERTON DETACHED 29 18 23 27.8 9 4 7 75.0 21 26 23.8 ATTACHED 36 17 31 82.4 12 15 19 26.7 37 64 73.0 APARTMENTS 47 28 44 57.1 17 21 18 -14.3 54 59 9.3 WEST VANCOUVER/HOWE SOUND DETACHED 160 30 136 353.3 18 28 21 -25.0 58 101 74.1 ATTACHED 14 2 7 250.0 1 7 2 -71.4 7 11 57.1 APARTMENTS 54 14 31 121.4 7 11 6 -45.5 21 29 38.1 GRAND TOTALS DETACHED 1843 522 1328 154.4 336 595 435 -26.9 1192 1853 55.5 ATTACHED 842 263 693 163.5 205 364 316 -13.2 675 1131 67.6 APARTMENTS 2159 793 1841 132.2 559 1053 814 -22.7 1904 3089 62.2