
Recommandé
Recommandé
Contenu connexe
Similaire à October 2022 Real Estate Board of Greater Vancouver Statistics Package
Similaire à October 2022 Real Estate Board of Greater Vancouver Statistics Package (20)
Plus de VickyAulakh1
Plus de VickyAulakh1 (20)
Dernier
Dernier (20)
October 2022 Real Estate Board of Greater Vancouver Statistics Package
- 1. News Release FOR IMMEDIATE RELEASE: Inflation, rising interest rates create caution across Metro Vancouver’s housing market VANCOUVER, BC – November 2, 2022 – Home sale activity across the Metro Vancouver* housing market continued to trend well below historical averages in October. The Real Estate Board of Greater Vancouver (REBGV) reports that residential home sales in the region totalled 1,903 in October 2022, a 45.5 per cent decrease from the 3,494 sales recorded in October 2021, and a 12.8 per cent increase from the 1,687 homes sold in September 2022. Last month’s sales were 33.3 per cent below the 10-year October sales average. “Inflation and rising interest rates continue to dominate headlines, leading many buyers and sellers to assess how these factors impact their housing options,” Andrew Lis, REBGV’s director, economics and data analytics said. “With sales remaining near historic lows, the number of active listings continues to inch upward, causing home prices to recede from the record highs set in the spring of 2022.” There were 4,033 detached, attached and apartment properties newly listed for sale on the Multiple Listing Service® (MLS®) in Metro Vancouver in October 2022. This represents a 0.4 per cent decrease compared to the 4,049 homes listed in October 2021 and a 4.6 per cent decrease compared to September 2022 when 4,229 homes were listed. The total number of homes currently listed for sale on the MLS® system in Metro Vancouver is 9,852, a 22.6 per cent increase compared to October 2021 (8,034) and a 1.2 per cent decrease compared to September 2022 (9,971). “Recent years have been characterized by a frenetic pace of sales amplified by scarce listings on the market to choose from. Today’s market cycle is a marked departure, with a slower pace of sales and more selection to choose from,” Lis said. “This environment provides buyers and sellers more time to conduct home inspections, strata minute reviews, and other due diligence. With the possibly of yet another rate hike by the Bank of Canada this December, it has become even more important to secure financing as early in the process as possible.” For all property types, the sales-to-active listings ratio for October 2022 is 19.3 per cent. By property type, the ratio is 14.3 per cent for detached homes, 21.6 per cent for townhomes, and 23.2 per cent for apartments.
- 2. Generally, analysts say downward pressure on home prices occurs when the ratio dips below 12 per cent for a sustained period, while home prices often experience upward pressure when it surpasses 20 per cent over several months. The MLS® Home Price Index composite benchmark price for all residential properties in Metro Vancouver is currently $1,148,900. This represents a 2.1 per cent increase from October 2021, a 9.2 per cent decrease over the last six months, and a 0.6 per cent decrease compared to September 2022. Sales of detached homes in October 2022 reached 575, a 47.2 per cent decrease from the 1,090 detached sales recorded in October 2021. The benchmark price for a detached home is $1,892,100. This represents a 1.6 per cent increase from October 2021 and a 0.7 per cent decrease compared to September 2022. Sales of apartment homes reached 995 in October 2022, a 44.8 per cent decrease compared to the 1,801 sales in October 2021. The benchmark price of an apartment home is $727,100. This represents a 5.1 per cent increase from October 2021 and a 0.2 per cent decrease compared to September 2022. Attached home sales in October 2022 totalled 333, a 44.8 per cent decrease compared to the 603 sales in October 2021. The benchmark price of an attached unit is $1,043,600. This represents a 7.1 per cent increase from October 2021 and a 0.5 per cent decrease compared to September 2022. -30- *Editor’s Note: Areas covered by the Real Estate Board of Greater Vancouver include: Burnaby, Coquitlam, Maple Ridge, New Westminster, North Vancouver, Pitt Meadows, Port Coquitlam, Port Moody, Richmond, South Delta, Squamish, Sunshine Coast, Vancouver, West Vancouver, and Whistler. The real estate industry is a key economic driver in British Columbia. In 2021, 43,999 homes changed ownership in the Board’s area, generating $2.98 billion in economic spin-off activity and an estimated 20,942 jobs. The total dollar value of residential sales transacted through the MLS® system in Greater Vancouver totalled $53.4 billion in 2021. The Real Estate Board of Greater Vancouver is an association representing more than 14,000 REALTORS® and their companies. The Board provides a variety of member services, including the Multiple Listing Service®. For more information on real estate, statistics, and buying or selling a home, contact a local REALTOR® or visit www.rebgv.org. For more information please contact: Craig Munn V.P., Communication and Events Real Estate Board of Greater Vancouver 604.730.3146 cmunn@rebgv.org
- 3. Property Type Area Benchmark Price Price Index 1 Month Change % 3 Month Change % 6 Month Change % 1 Year Change % 3 Year Change % 5 Year Change % 10 Year Change % Residential / Composite Lower Mainland $1,093,000 331.2 -0.9% -6.2% -11.7% 2.1% 33.8% 16.3% 88.1% Greater Vancouver $1,148,900 324.5 -0.6% -4.8% -9.2% 2.1% 27.8% 9.6% 77.2% Bowen Island $1,412,000 297.7 -2.7% -12.8% -15.6% -0.4% 52.0% 54.3% 143.2% Burnaby East $1,125,900 352.3 1.1% -2.4% -7.7% 6.3% 27.0% 15.9% 95.6% Burnaby North $994,400 330.5 -0.3% -5.4% -7.6% 4.8% 28.2% 12.1% 97.7% Burnaby South $1,064,300 332.9 -0.3% -3.3% -10.3% 4.4% 23.2% 11.8% 89.5% Coquitlam $1,074,200 334.3 -1.2% -5.3% -11.5% 3.6% 35.4% 23.3% 107.8% Ladner $1,110,600 321.9 0.6% -5.0% -10.0% 4.3% 43.1% 24.8% 110.9% Maple Ridge $941,200 324.8 -2.3% -9.6% -17.3% -1.0% 44.9% 40.0% 141.8% New Westminster $809,800 364.3 0.2% -2.9% -6.5% 7.4% 33.6% 27.1% 111.9% North Vancouver $1,330,800 306.6 0.8% -5.6% -10.1% 2.0% 27.1% 11.5% 92.0% Pitt Meadows $873,100 341.5 -2.7% -8.6% -15.4% 1.1% 42.7% 39.2% 140.8% Port Coquitlam $911,000 350.8 -0.1% -3.7% -12.1% 5.7% 44.0% 37.1% 134.3% Port Moody $1,117,500 352.2 -2.0% -6.7% -8.6% 7.6% 44.2% 30.2% 137.5% Richmond $1,121,200 366.5 -0.9% -3.5% -6.6% 5.0% 30.5% 10.6% 85.5% Squamish $1,076,600 353.9 -0.6% -9.5% -8.4% 2.7% 37.2% 42.9% 161.0% Sunshine Coast $835,900 307.9 -3.3% -9.2% -10.9% 4.1% 48.9% 56.5% 149.5% Tsawwassen $1,218,400 317.5 0.2% -3.1% -9.4% 5.7% 36.8% 18.7% 102.7% Vancouver East $1,127,300 350.4 -1.6% -5.8% -10.0% 0.4% 24.3% 9.1% 85.2% Vancouver West $1,276,800 299.6 -0.3% -2.9% -7.7% -2.2% 12.3% -10.3% 46.1% West Vancouver $2,732,300 295.1 1.1% -2.8% -3.8% 1.8% 25.5% -2.9% 61.1% Whistler $1,419,700 312.7 0.4% -9.0% -7.2% 2.7% 42.7% 57.8% 163.2% Single Family Detached Lower Mainland $1,685,100 369.0 -1.1% -7.2% -13.3% 0.8% 37.2% 21.1% 100.9% Greater Vancouver $1,892,100 352.3 -0.7% -5.4% -10.0% 1.6% 31.2% 11.0% 81.9% Bowen Island $1,412,600 297.7 -2.7% -12.7% -15.5% -0.3% 52.0% 54.4% 143.4% Burnaby East $1,826,700 388.5 2.3% 1.2% -7.6% 7.6% 35.6% 26.4% 122.4% Burnaby North $1,946,300 371.9 -0.6% -6.3% -8.4% 7.1% 33.7% 16.0% 109.3% Burnaby South $2,067,300 384.0 -0.6% -1.9% -11.6% 5.1% 28.5% 11.7% 101.5% Coquitlam $1,750,400 400.5 -1.6% -5.5% -10.8% 5.1% 45.7% 34.4% 144.1% Ladner $1,354,900 327.2 -0.1% -7.2% -12.5% 1.0% 46.9% 25.1% 114.1% Maple Ridge $1,199,900 350.8 -2.4% -10.7% -18.4% -2.7% 46.5% 47.1% 156.1% New Westminster $1,497,400 374.3 1.1% 0.7% -7.6% 6.4% 41.8% 29.6% 120.3% North Vancouver $2,124,600 331.4 1.5% -6.7% -11.2% 0.8% 29.9% 14.9% 109.2% Pitt Meadows $1,189,400 351.4 -4.2% -10.9% -19.2% -6.9% 41.3% 38.9% 142.0% Port Coquitlam $1,313,100 371.1 -0.1% -5.9% -14.7% 2.9% 46.0% 39.3% 148.2% Port Moody $2,029,800 384.4 -2.1% -7.0% -8.5% 8.4% 46.4% 33.1% 145.0% Richmond $2,053,800 419.2 -1.3% -3.6% -6.5% 4.2% 30.4% 13.7% 100.3% Squamish $1,685,700 418.0 1.6% -5.7% -4.6% 5.8% 50.8% 57.1% 229.4% Sunshine Coast $917,000 319.7 -3.1% -8.0% -10.8% 5.4% 55.4% 62.5% 158.0% Tsawwassen $1,536,100 340.2 -0.3% -3.7% -11.2% 3.9% 43.1% 26.0% 119.3% Vancouver East $1,719,100 384.7 -1.3% -5.7% -11.5% 0.6% 26.4% 13.1% 105.0% Vancouver West $3,188,400 332.7 -2.1% -5.7% -9.8% -5.1% 10.5% -10.5% 53.0% West Vancouver $3,317,500 308.5 1.6% -1.8% -2.1% 3.1% 26.5% 0.7% 68.5% Whistler $2,639,400 356.4 2.0% -5.9% -4.0% 7.0% 55.4% 59.0% 192.9% HOW TO READ THE TABLE: • Benchmark Price: Estimated sale price of a benchmark property. Benchmarks represent a typical property within each market. • Price Index: Index numbers estimate the percentage change in price on typical and constant quality properties over time. All figures are based on past sales. • x Month/Year Change %: Percentage change of index over a period of x month(s)/year(s) * In January 2005, the indexes are set to 100. Townhome properties are similar to Attached properties, a category that was used in the previous MLSLink HPI, but do not included duplexes. The above info is deemed reliable, but is not guaranteed. All dollar amounts in CDN. October 2022 * * MLS®, Multiple Listing Service®, and all related graphics are trademarks of The Canadian Real Estate Association 1 of 19
- 4. Property Type Area Benchmark Price Price Index 1 Month Change % 3 Month Change % 6 Month Change % 1 Year Change % 3 Year Change % 5 Year Change % 10 Year Change % October 2022 * Townhouse Lower Mainland $927,900 351.1 -1.0% -6.1% -10.9% 7.5% 39.0% 36.6% 127.8% Greater Vancouver $1,043,600 359.5 -0.5% -4.8% -9.1% 7.1% 34.1% 30.4% 124.0% Burnaby East $840,300 353.8 -1.5% -7.0% -5.3% 10.6% 26.3% 27.4% 112.1% Burnaby North $879,500 357.1 -1.8% -6.7% -7.7% 9.2% 27.0% 29.8% 124.2% Burnaby South $942,300 350.2 -1.3% -4.8% -10.4% 6.0% 22.1% 24.3% 115.2% Coquitlam $1,014,600 393.0 -1.7% -6.1% -11.7% 7.8% 42.5% 40.5% 151.6% Ladner $941,100 361.4 2.4% -3.4% -8.3% 6.6% 33.0% 30.4% 125.6% Maple Ridge $732,700 364.0 -2.4% -7.6% -17.0% 3.3% 41.0% 41.4% 165.3% New Westminster $917,500 390.6 1.6% -2.9% -3.6% 13.1% 41.4% 39.8% 132.4% North Vancouver $1,230,600 334.2 0.8% -7.9% -11.2% 4.5% 34.3% 28.4% 125.5% Pitt Meadows $818,700 396.7 0.0% -4.2% -11.1% 9.5% 43.1% 50.2% 171.2% Port Coquitlam $892,300 357.3 -2.0% -2.5% -13.5% 6.1% 42.1% 37.3% 151.4% Port Moody $1,021,600 387.9 -2.0% -8.9% -10.1% 9.9% 43.6% 47.8% 154.5% Richmond $1,059,300 379.9 0.7% -1.9% -6.1% 10.5% 35.8% 28.9% 118.6% Squamish $992,000 357.6 -1.3% -8.0% -9.3% 5.4% 39.9% 44.0% 187.7% Sunshine Coast $718,500 325.9 -0.7% -7.1% -8.9% 6.5% 43.4% 49.0% 166.3% Tsawwassen $952,600 298.9 2.1% -3.7% -8.2% 6.2% 18.5% 7.6% 82.8% Vancouver East $1,028,500 336.8 -3.9% -10.6% -10.9% -2.1% 21.3% 14.1% 95.8% Vancouver West $1,477,700 330.4 1.5% 1.0% -4.6% 6.7% 24.1% 15.0% 100.6% Whistler $1,417,200 361.3 -1.7% -7.8% -9.5% 8.2% 45.7% 59.2% 202.8% Apartment Lower Mainland $678,800 336.4 -0.2% -3.9% -7.1% 6.4% 24.6% 20.4% 105.7% Greater Vancouver $727,100 332.2 -0.2% -3.7% -6.3% 5.1% 20.4% 17.3% 102.7% Burnaby East $771,200 323.9 0.6% -5.3% -8.6% 5.2% 19.8% 19.5% 91.0% Burnaby North $711,900 359.4 0.6% -3.1% -4.4% 8.0% 30.6% 30.5% 123.4% Burnaby South $751,600 357.7 0.2% -3.5% -7.0% 6.8% 20.5% 21.0% 112.9% Coquitlam $665,000 377.2 0.5% -2.3% -8.0% 7.8% 26.2% 29.9% 145.4% Ladner $717,100 364.8 1.2% 1.8% -1.9% 14.1% 51.6% 51.7% 146.0% Maple Ridge $525,500 362.9 -2.0% -5.9% -8.4% 11.6% 40.8% 51.6% 164.1% New Westminster $632,200 379.0 -0.3% -4.4% -6.0% 8.4% 25.2% 28.4% 127.8% North Vancouver $780,400 311.7 -0.9% -2.8% -5.9% 7.9% 23.4% 19.8% 113.2% Pitt Meadows $594,600 400.9 -1.5% -5.9% -9.0% 10.6% 34.9% 42.8% 172.2% Port Coquitlam $610,200 414.8 1.0% -2.6% -7.5% 10.8% 37.2% 42.4% 166.4% Port Moody $699,000 372.6 -1.6% -3.8% -7.4% 4.1% 25.2% 30.2% 151.6% Richmond $699,600 378.0 -0.6% -3.4% -4.5% 7.1% 25.6% 25.9% 116.6% Squamish $532,900 316.1 -7.3% -20.7% -15.6% -9.1% 12.1% 35.7% 148.7% Sunshine Coast $506,100 290.0 -6.6% -22.3% -16.6% -12.1% 4.1% 19.8% 93.1% Tsawwassen $741,000 345.9 1.1% 1.2% -1.6% 13.4% 36.8% 33.1% 130.1% Vancouver East $678,900 388.8 -1.2% -5.7% -6.9% 2.6% 15.8% 12.7% 108.7% Vancouver West $827,700 312.5 0.7% -1.9% -5.9% 2.1% 12.1% 5.2% 90.1% West Vancouver $1,193,200 233.0 0.0% -4.0% -9.8% 3.4% 8.9% 2.0% 63.6% Whistler $603,900 260.3 -5.2% -20.4% -14.1% -8.0% 17.6% 47.0% 130.4% HOW TO READ THE TABLE: • Benchmark Price: Estimated sale price of a benchmark property. Benchmarks represent a typical property within each market. • Price Index: Index numbers estimate the percentage change in price on typical and constant quality properties over time. All figures are based on past sales. • x Month/Year Change %: Percentage change of index over a period of x month(s)/year(s) In January 2005, the indexes are set to 100. * Townhome properties are similar to attached properties, a category that was used in the previous MLSLink HPI, but do not included duplexes. Lower Mainland includes areas serviced by both Real Estate Board of Greater Vancouver & Fraser Valley Real Estate Board. The above info is deemed reliable, but is not guaranteed. All dollar amounts in CDN. * MLS®, Multiple Listing Service®, and all related graphics are trademarks of The Canadian Real Estate Association 2 of 19
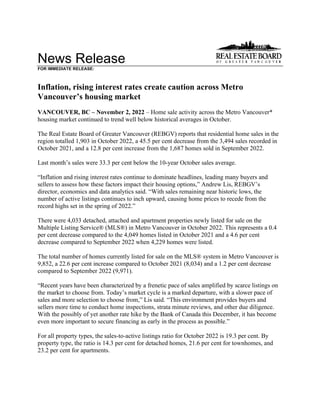
- 5. C:DATAMonthEndHpiexporthi_resgv-hpi2.tif Greater Vancouver 5 Year Trend 60 110 160 210 260 310 360 410 460 Oct 2017 Dec 2017 Feb 2018 Apr 2018 Jun 2018 Aug 2018 Oct 2018 Dec 2018 Feb 2019 Apr 2019 Jun 2019 Aug 2019 Oct 2019 Dec 2019 Feb 2020 Apr 2020 Jun 2020 Aug 2020 Oct 2020 Dec 2020 Feb 2021 Apr 2021 Jun 2021 Aug 2021 Oct 2021 Dec 2021 Feb 2022 Apr 2022 Jun 2022 Aug 2022 Oct 2022 Price Index Residential Detached Townhouse Apartment Jan 2005 HPI = 100
- 8. Listing & Sales Activity Summary Listings Sales 1 2 3 Col. 2 & 3 5 6 7 Col. 6 & 7 9 10 Col. 9 & 10 Oct Sep Oct Percentage Oct Sep Oct Percentage Aug 2021 - Aug 2022 - Percentage 2021 2022 2022 Variance 2021 2022 2022 Variance Oct 2021 Oct 2022 Variance BURNABY % % % DETACHED 104 102 94 -7.8 97 35 43 22.9 244 128 -47.5 ATTACHED 70 81 95 17.3 73 32 48 50.0 240 112 -53.3 APARTMENTS 270 253 290 14.6 291 157 147 -6.4 792 485 -38.8 COQUITLAM DETACHED 82 114 105 -7.9 100 52 56 7.7 273 157 -42.5 ATTACHED 29 46 47 2.2 39 15 29 93.3 124 78 -37.1 APARTMENTS 165 159 186 17.0 163 74 109 47.3 436 256 -41.3 DELTA DETACHED 59 57 64 12.3 51 30 24 -20.0 163 74 -54.6 ATTACHED 24 11 13 18.2 27 3 13 333.3 70 28 -60.0 APARTMENTS 22 27 20 -25.9 24 8 12 50.0 73 38 -47.9 MAPLE RIDGE/PITT MEADOWS DETACHED 119 199 140 -29.6 122 65 75 15.4 348 203 -41.7 ATTACHED 40 60 60 0.0 38 38 21 -44.7 140 92 -34.3 APARTMENTS 41 67 58 -13.4 58 31 23 -25.8 157 86 -45.2 NORTH VANCOUVER DETACHED 94 148 107 -27.7 94 50 62 24.0 246 154 -37.4 ATTACHED 54 77 71 -7.8 30 21 45 114.3 107 87 -18.7 APARTMENTS 142 173 165 -4.6 136 57 87 52.6 350 205 -41.4 NEW WESTMINSTER DETACHED 18 35 34 -2.9 29 9 9 0.0 64 30 -53.1 ATTACHED 28 24 20 -16.7 17 7 4 -42.9 51 28 -45.1 APARTMENTS 124 112 90 -19.6 118 51 58 13.7 325 157 -51.7 PORT MOODY/BELCARRA DETACHED 18 24 24 0.0 21 9 12 33.3 63 26 -58.7 ATTACHED 12 16 20 25.0 19 16 8 -50.0 41 36 -12.2 APARTMENTS 38 46 32 -30.4 32 28 23 -17.9 94 67 -28.7 PORT COQUITLAM DETACHED 42 29 31 6.9 37 15 22 46.7 111 65 -41.4 ATTACHED 23 31 32 3.2 31 13 12 -7.7 75 50 -33.3 APARTMENTS 66 63 58 -7.9 50 22 28 27.3 127 75 -40.9 RICHMOND DETACHED 141 144 130 -9.7 116 53 59 11.3 339 168 -50.4 ATTACHED 117 93 125 34.4 117 42 58 38.1 319 148 -53.6 APARTMENTS 278 224 197 -12.1 243 115 124 7.8 694 361 -48.0 SUNSHINE COAST DETACHED 58 89 75 -15.7 63 36 27 -25.0 200 92 -54.0 ATTACHED 10 10 9 -10.0 10 4 4 0.0 27 11 -59.3 APARTMENTS 6 16 8 -50.0 10 2 2 0.0 33 8 -75.8 SQUAMISH DETACHED 28 35 34 -2.9 24 12 15 25.0 63 35 -44.4 ATTACHED 18 20 16 -20.0 20 6 5 -16.7 57 19 -66.7 APARTMENTS 28 19 24 26.3 25 13 9 -30.8 46 28 -39.1 VANCOUVER EAST DETACHED 158 130 122 -6.2 137 66 56 -15.2 377 179 -52.5 ATTACHED 87 96 115 19.8 76 28 34 21.4 191 114 -40.3 APARTMENTS 233 222 200 -9.9 178 84 103 22.6 486 273 -43.8 VANCOUVER WEST DETACHED 158 174 147 -15.5 108 54 73 35.2 265 184 -30.6 ATTACHED 124 98 95 -3.1 68 33 33 0.0 213 107 -49.8 APARTMENTS 689 635 616 -3.0 417 214 236 10.3 1276 732 -42.6 WHISTLER/PEMBERTON DETACHED 13 22 24 9.1 19 7 11 57.1 63 26 -58.7 ATTACHED 15 21 29 38.1 29 10 15 50.0 76 38 -50.0 APARTMENTS 34 23 37 60.9 36 22 18 -18.2 102 63 -38.2 WEST VANCOUVER/HOWE SOUND DETACHED 126 122 105 -13.9 60 26 27 3.8 144 81 -43.8 ATTACHED 14 19 13 -31.6 9 6 4 -33.3 24 14 -41.7 APARTMENTS 22 48 46 -4.2 19 10 16 60.0 58 47 -19.0 GRAND TOTALS DETACHED 1218 1424 1236 -13.2 1078 519 571 10.0 2963 1602 -45.9 ATTACHED 665 703 760 8.1 603 274 333 21.5 1755 962 -45.2 APARTMENTS 2158 2087 2027 -2.9 1800 888 995 12.0 5049 2881 -42.9