Contenu connexe
Similaire à Devi Medical Table.doc (6)
Devi Medical Table.doc
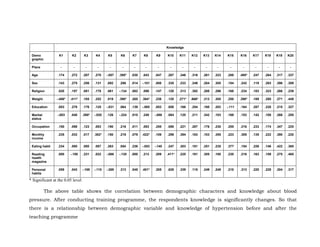
- 1. Knowledge
Demo
graphic
K1 K2 K3 K4 K5 K6 K7 K8 K9 K10 K11 K12 K13 K14 K15 K16 K17 K18 K19 K20
Place - - - - - - - - - - - - - - - - - - - -
Age .174 .272 .287 .270 -.057 .395* .030 .043 .047 .287 .346 .316 .261 .323 .288 .495* .247 .264 .317 .337
Sex .143 .275 .256 .131 .092 .286 .014 -.101 .008 .335 .233 .246 .284 .305 .154 .242 .119 .263 .396 .389
Religion .020 .157 .081 .178 .061 -.134 .062 .098 .147 .120 .313 .392 .288 .296 .168 .234 .183 .323 .266 .239
Weight -.406* .411* .185 .252 .019 .390* .265 .364* .236 .120 .271* .666* .313 .305 .250 .390* .189 .280 .271 .449
Education .053 .278 .176 .125 -.031 .064 .139 -.085 .053 .050 .166 .254 .160 .203 -.111 .164 .287 .228 .215 .327
Marital
status
-.003 .040 .388* -.020 .126 -.224 .010 .240 -.086 .084 .120 .211 .342 .103 .169 .153 .142 .108 .266 .255
Occupation .150 .098 .123 .083 .190 .216 .011 .083 .255 .088 .221 .287 .176 .230 .255 .216 .233 .174 .347 .225
Monthly
income
.235 .033 .017 .382* .150 .219 .079 .422* .109 .299 .394 .163 .103 .355 .223 .309 .135 .222 .390 .220
Eating habit .234 .000 .000 .087 .263 .054 .236 -.053 -.140 .247 .303 .181 .251 .235 .377 .154 .226 .146 .422 .365
Reading
health
magazine
.000 -.150 .231 .022 -.066 -.135 .000 .213 .209 .411* .225 .181 .305 .100 .230 .216 .163 .159 .275 .465
Personal
habits
.059 .043 -.169 -.110 -.269 .313 .045 .401* .305 .628 .339 .115 .249 .248 .210 .313 .220 .228 .304 .317
* Significant at the 0.05 level
The above table shows the correlation between demographic characters and knowledge about blood
pressure. After conducting training programme, the respondents knowledge is significantly changes. So that
there is a relationship between demographic variable and knowledge of hypertension before and after the
teaching programme
- 2. Practice
Demo
graphic
P1 P2 P3 P4 P5 P6 P7 P8 P9 P10 P11 P12 P13 P14 P15 P16 P17 P18 P19 P20
Place - - - - - - - - - - - - - - - - - - - -
Age .039 - .026 .141 .277 .038 .105 .013 .058 .123 - - .228 .328 .231 .328 - - .244 .220
Sex .148 - -.002 -.036 .247 .133 -.084 .094 -.162 .157 - - .286 .448 .230 .386 - - .378 .214
Religion -.034 - .104 .159 .128 .087 .371* -.083 .000 .407* - - .234 .434 .170 .334 - - .212 .867**
Weight .148 - .086 .256 .056 .127 .274 -.311 .193 .375* - - .229 .448 .240 .248 - - .283 .282
Education .255 - .266 .004 .141 .345 .134 .107 .116 .024 - - .355 .278 .332 .344 - - .284 .340
Marital
status
.122 - .062 -.263 .444* .308 .062 -.209 .060 .124 - - .222 .422 .446 .426 - - .242 .218
Occupation .129 - .187 .123 .241 .328 -.182 .133 .450* .206 - - .155 .329 .259 .340 - - .245 .211
Monthly
income
.337 - -.052 .034 -.238 .217 .118 .247 .000 .406* - - .202 .402 .309 .202 - - .224 .473**
Eating habit .131 - .036 -.202 .148 .190 .177 .063 .000 -.022 - - .231 .331 .268 .331 - - .367 .336
Reading
health
magazine
.131 - .072 .404* -.084 .190 .177 .063 -.274 .044 - - .331 .231 .338 .431 - - .367 .218
Personal
habits
.275 - .160 .043 .008 .086 -.017 .030 .130 .058 - - .275 .100 .315 .100 - - .308 .323
* Significant at the 0.05 level
** Significant at the 0.01 level
The above table shows the correlation between demographic characters and practice about blood
pressure. After conducting training programme, the respondents knowledge is significantly changes. So that
there is a relationship between demographic variable and practice of hypertension before and after the teaching
programme