Cardiac Cycle.pptx
•Télécharger en tant que PPTX, PDF•
11 j'aime•35,967 vues

this content will be beneficial for b.sc nursing 1st year students.

Recommandé
Contenu connexe
Tendances
Tendances (20)
Similaire à Cardiac Cycle.pptx
Similaire à Cardiac Cycle.pptx (20)
Plus de Vipin Chandran
Plus de Vipin Chandran (20)
Dernier
Dernier (20)
Cardiac Cycle.pptx
- 2. Cardiac Cycle: Definition: The sequence of changes in the pressure and flow in the heart chambers and blood vessels in between the two subsequent cardiac contractions is known as cardiac cycle. • Normal duration: 0.8 second at heart rate of 75 per minute. • Atrial systole: 0.1 second • Ventricular systole: 0.3 second • Atrial diastole: 0.7 second • Ventricular diastole: 0.5 second
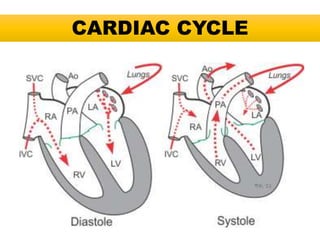
- 3. Events in Cardiac Cycle: • The parts of heart normally beat in an orderly sequence- atrial systole, ventricular systole, atrial diastole and ventricular diastole.
- 4. Events in Cardiac Cycle:
- 5. A. Atrial Systole: 1) Duration 0.1 second. It is seen following the impulse generation in the SAN. 2) Atrial muscle contracts and atrial pressure rises with ventricular pressure following it. 3) It propels approximately 30% additional blood into the ventricles.
- 6. B. Ventricular Systole: 1) Total duration 0.3 second. It is seen after the ventricles get invaded by the excitation process. Ventricular contraction begins and ventricular pressure exceeds atrial pressure very rapidly causing closure of AV valves with production of first heart sound (HS1). 2) The amount of blood ejected by each ventricle per stroke at rest is 70-80 mL. this is called stroke volume. This is approximately 65% of the end- diastolic ventricular blood volume (EDV).
- 7. C. Atrial Diastole: 1) Duration 0.7 second. 2) During this phase, atrial muscles relax and atrial pressure gradually increases due to continuous venous return.
- 8. D. Ventricular Diastole: 1) Total duration 0.5 second. During ventricular diastole the arterial pressure is better sustained due to elastic recoil of the vessel wall and immediately arterial pressure exceeds that in the ventricle this results in closure of semilunar valves causing sharp second heart sound (HS2). 2) The ventricular filling occurs passively during this phase due to continuous blood return to the heart (venous return) and due to atrial systole.
- 10. Electrocardiogram (ECG): • Body is a volume conductor, i.e. body fluids are good conductor of electricity. Therefore electrical changes which occur in the heart with each heart beat are conducted all over the body and can be picked up from the body surface. The record of these electrical fluctuations during cardiac cycle is called electrocardiogram (ECG).
- 12. NORMAL ECG: • The wave associated with electrical activity of the various parts of the heart tissue during each cardiac cycle are represented by letter P,Q,R,S and T. 1) P wave: It is due to atrial depolarisation and represents the spread of impulse from SA node to atrial muscles. 2) P-R segment: Following the P wave there is a brief isoelectric period of 0.04 second called P-R segment. 3) QRS complex: It is due to ventricular depolarisation.
- 13. NORMAL ECG: 4) Q wave: Its duration less than 0.04 second, beginning of Q wave represents invasion of mid- portion of the interventricular septum by excitation process. 5) R wave: It is a prominent and positive wave, it represent excitation process, its height is directly proportional to the functional activity of ventricles. 6) S wave: It is negative deflection which follows the ‘R’ wave, it represent excitation of more basal parts of ventricles.
- 14. NORMAL ECG: 7) S-T segment: Following QRS complex there is long isoelectric period which extend from the end of S wave to the beginning T wave called S-T segment. Its duration is 0.04 to 0.08 second. 8) T wave: Rounded positive deflection of duration 0.27 second and 0.5 mV height, It represents ventricular repolarisation.