SlideShare une entreprise Scribd logo
1  sur  2
How are Banking Ratios Compiled ?
Financial institutions such as banks, financial service companies, insurance companies, securities firms
and credit unions have very different ways of reporting financial information. This guide gives you the most
pertinent information to analyze a financial service company's financial statements.
Income Statement
Return on Average Assets
USBR calculates Return on Assets (ROA) by dividing net operating income by total assets.
Return on Average Assets = ( Net Operating Income/ Total Assets )
Return on Equity
Return on Equity = ( Net Income/Stockholder Equity )
Return on Equity is determined by dividing net income (minus preferred dividends) by average common
stockholders equity to get the return on equity.
Rate Paid on Funds
The Rate Paid on Funds is determined by dividing total interest expense by total earning assets. The
formula is as follows:
Rate Paid on Funds = Total Interest Expense / Total Earning Assets
This indicates what percentage or rate of interest is paid from assets.
Net Interest Margin
Net Interest Margin
Net interest margin is computed by dividing net interest income by total earning assets.
Net Interest Margin = Net Interest income/ Earning Assets
Provision for Loan Losses
This important figure is a reserve account to cover unexpected defaults on loans by borrowers. These are
generally referred to as nonperforming loans.
Reserve as a percentage of loans: ( Reserve/ Total loans )
Chargeoffs as percentage of loans: (Charge-offs/ Total Loans )
The higher the nonperforming loan and charge-off percentages, the higher the provision for loan losses
should probably be. Consequently, this would reduce net income and earnings per share.
Long Term Debt to Total Liabilities and Equity
The higher this figure, the more difficult it would be for a bank to borrow more funds.This figure is
determined as follows:
Long Term Debt to Total Liabilities and Equity = ( Long Term Debt / Total Liabilities plus Equity )
Loans to Assets
The loans to assets ratio measures the total loans outstanding as a percentage of total assets. The higher
this ratio indicates a bank is loaned up and its liquidity is low. The higher the ratio, the more risky a bank
may be to higher defaults.
This figure is determined as follows:
Loans to Assets = ( Loans / Total Assets )
Equity to Assets
Equity to total assets is a common measure used to analyze capital adequancy of a bank. This figure is
determined as follows:
Equity to Assets = ( Stockholders Equity / Average Total Assets )
Equity to Loans
Equity to Loans reflects the degree of equity coverage to outstanding loans. This figure is determined as
follows:
Equity to Loans = ( Average Common Equity / Average Total Assets )
Tier I Capital
Tier I
Banks must maintain a ratio which is within the guidelines set by the FDIC guidelines. This figure is
determined as follows:
Tier 1 Capital = ( Stockholder Equity/ Risk-Adjusted Assets )
Total Capital
Total Capital includes Tier I and the reserve for loan losses ( up to 1.25 % of Risk Adjusted Capital) plus
subordinated notes (to 50 percent of Tier I capital). This figure is also set by FDIC guidelines.

Contenu connexe

Tendances

financial sector -Anshu.pptx
financial sector -Anshu.pptxfinancial sector -Anshu.pptx
financial sector -Anshu.pptxaNshupAL19
 
Investment strategy in EMDEs for a portfolio investor
Investment strategy in EMDEs for a portfolio investorInvestment strategy in EMDEs for a portfolio investor
Investment strategy in EMDEs for a portfolio investorFarida Taman
 
Annual Percentage Rate (APR) | Accounting
Annual Percentage Rate (APR) | AccountingAnnual Percentage Rate (APR) | Accounting
Annual Percentage Rate (APR) | AccountingTransweb Global Inc
 
ERI Tutorial
ERI TutorialERI Tutorial
ERI Tutorialgregcook3
 
How gold exchange traded funds work
How gold exchange traded funds workHow gold exchange traded funds work
How gold exchange traded funds workitaltecgold
 
BankRISK Presentation
BankRISK PresentationBankRISK Presentation
BankRISK PresentationTriNovus LLC
 
Finance presentation
Finance presentationFinance presentation
Finance presentationbenlaugh
 
July 2013, European Leveraged Loan Market Analysis
July 2013, European Leveraged Loan Market Analysis July 2013, European Leveraged Loan Market Analysis
July 2013, European Leveraged Loan Market Analysis Leveraged Commentary & Data
 
Edar Iasb Fasb Presentation
Edar Iasb Fasb PresentationEdar Iasb Fasb Presentation
Edar Iasb Fasb PresentationDoug Barnert
 
Traditional types of Investments vs the new Investment era
Traditional types of Investments vs the new Investment eraTraditional types of Investments vs the new Investment era
Traditional types of Investments vs the new Investment erafinancialhospital
 

Tendances (19)

Sxu finance 2017
Sxu finance 2017Sxu finance 2017
Sxu finance 2017
 
financial sector -Anshu.pptx
financial sector -Anshu.pptxfinancial sector -Anshu.pptx
financial sector -Anshu.pptx
 
Investment strategy in EMDEs for a portfolio investor
Investment strategy in EMDEs for a portfolio investorInvestment strategy in EMDEs for a portfolio investor
Investment strategy in EMDEs for a portfolio investor
 
Annual Percentage Rate (APR) | Accounting
Annual Percentage Rate (APR) | AccountingAnnual Percentage Rate (APR) | Accounting
Annual Percentage Rate (APR) | Accounting
 
Fixed deposit
Fixed depositFixed deposit
Fixed deposit
 
ERI Tutorial
ERI TutorialERI Tutorial
ERI Tutorial
 
Macro 14
Macro 14Macro 14
Macro 14
 
Macro 15
Macro 15Macro 15
Macro 15
 
How gold exchange traded funds work
How gold exchange traded funds workHow gold exchange traded funds work
How gold exchange traded funds work
 
BankRISK Presentation
BankRISK PresentationBankRISK Presentation
BankRISK Presentation
 
Budgets and budgeting
Budgets and budgetingBudgets and budgeting
Budgets and budgeting
 
L Pch8
L Pch8L Pch8
L Pch8
 
Private Lending
Private LendingPrivate Lending
Private Lending
 
Finance presentation
Finance presentationFinance presentation
Finance presentation
 
Presentation real estate
Presentation real estatePresentation real estate
Presentation real estate
 
July 2013, European Leveraged Loan Market Analysis
July 2013, European Leveraged Loan Market Analysis July 2013, European Leveraged Loan Market Analysis
July 2013, European Leveraged Loan Market Analysis
 
Edar Iasb Fasb Presentation
Edar Iasb Fasb PresentationEdar Iasb Fasb Presentation
Edar Iasb Fasb Presentation
 
PM1_Allocate
PM1_AllocatePM1_Allocate
PM1_Allocate
 
Traditional types of Investments vs the new Investment era
Traditional types of Investments vs the new Investment eraTraditional types of Investments vs the new Investment era
Traditional types of Investments vs the new Investment era
 

Similaire à How are banking ratios compiled

Performance measurement of banks npa analysis & credentials of parameters
Performance measurement of banks  npa analysis & credentials of parametersPerformance measurement of banks  npa analysis & credentials of parameters
Performance measurement of banks npa analysis & credentials of parametersvikaas12
 
TOPIC-5-Interest-Rate-and-Its-Role-in-Finance.pdf
TOPIC-5-Interest-Rate-and-Its-Role-in-Finance.pdfTOPIC-5-Interest-Rate-and-Its-Role-in-Finance.pdf
TOPIC-5-Interest-Rate-and-Its-Role-in-Finance.pdfkaylamaepalmadelacru
 
Credit Union Key Ratios
Credit Union Key RatiosCredit Union Key Ratios
Credit Union Key RatiosEdward B. Lis
 
22244718ratioanalysisppt 12638286824297-phpapp02
22244718ratioanalysisppt 12638286824297-phpapp0222244718ratioanalysisppt 12638286824297-phpapp02
22244718ratioanalysisppt 12638286824297-phpapp02Amar Singh
 
Ratio Analysis Ppt
Ratio Analysis PptRatio Analysis Ppt
Ratio Analysis PptMobasher Ali
 
05 financial concepts
05 financial concepts05 financial concepts
05 financial conceptsspandane
 
Steps to basic_company_financial_analysis
Steps to basic_company_financial_analysisSteps to basic_company_financial_analysis
Steps to basic_company_financial_analysisIbrahim Hussain
 
R C F,Prashant V V
R C F,Prashant V VR C F,Prashant V V
R C F,Prashant V Vpachhya
 
Unit 3 Analysis of Financial Statements
Unit 3 Analysis of Financial Statements Unit 3 Analysis of Financial Statements
Unit 3 Analysis of Financial Statements Ramesh Kumar Natesan
 
The effect of loan to deposit ratio(LDR), interest income ratio, and non-inte...
The effect of loan to deposit ratio(LDR), interest income ratio, and non-inte...The effect of loan to deposit ratio(LDR), interest income ratio, and non-inte...
The effect of loan to deposit ratio(LDR), interest income ratio, and non-inte...AJHSSR Journal
 
Cost and management accounting
Cost and management accountingCost and management accounting
Cost and management accountingAnuj Bhatia
 

Similaire à How are banking ratios compiled (20)

Bank ratios
Bank ratiosBank ratios
Bank ratios
 
Performance measurement of banks npa analysis & credentials of parameters
Performance measurement of banks  npa analysis & credentials of parametersPerformance measurement of banks  npa analysis & credentials of parameters
Performance measurement of banks npa analysis & credentials of parameters
 
Rasio keuangan
Rasio keuanganRasio keuangan
Rasio keuangan
 
Financial maths
Financial mathsFinancial maths
Financial maths
 
TOPIC-5-Interest-Rate-and-Its-Role-in-Finance.pdf
TOPIC-5-Interest-Rate-and-Its-Role-in-Finance.pdfTOPIC-5-Interest-Rate-and-Its-Role-in-Finance.pdf
TOPIC-5-Interest-Rate-and-Its-Role-in-Finance.pdf
 
Ratio analysis
Ratio analysisRatio analysis
Ratio analysis
 
UNIT-2 Ratio.pptx
UNIT-2 Ratio.pptxUNIT-2 Ratio.pptx
UNIT-2 Ratio.pptx
 
Credit Union Key Ratios
Credit Union Key RatiosCredit Union Key Ratios
Credit Union Key Ratios
 
Camels framework
Camels framework Camels framework
Camels framework
 
22244718ratioanalysisppt 12638286824297-phpapp02
22244718ratioanalysisppt 12638286824297-phpapp0222244718ratioanalysisppt 12638286824297-phpapp02
22244718ratioanalysisppt 12638286824297-phpapp02
 
Ratio Analysis Ppt
Ratio Analysis PptRatio Analysis Ppt
Ratio Analysis Ppt
 
05 financial concepts
05 financial concepts05 financial concepts
05 financial concepts
 
Ratio Analysis
Ratio AnalysisRatio Analysis
Ratio Analysis
 
Steps to basic_company_financial_analysis
Steps to basic_company_financial_analysisSteps to basic_company_financial_analysis
Steps to basic_company_financial_analysis
 
R C F,Prashant V V
R C F,Prashant V VR C F,Prashant V V
R C F,Prashant V V
 
Unit 3 Analysis of Financial Statements
Unit 3 Analysis of Financial Statements Unit 3 Analysis of Financial Statements
Unit 3 Analysis of Financial Statements
 
The effect of loan to deposit ratio(LDR), interest income ratio, and non-inte...
The effect of loan to deposit ratio(LDR), interest income ratio, and non-inte...The effect of loan to deposit ratio(LDR), interest income ratio, and non-inte...
The effect of loan to deposit ratio(LDR), interest income ratio, and non-inte...
 
Cost and management accounting
Cost and management accountingCost and management accounting
Cost and management accounting
 
Ratio Analysis
Ratio AnalysisRatio Analysis
Ratio Analysis
 
Ratio_Analysis_New.ppt
Ratio_Analysis_New.pptRatio_Analysis_New.ppt
Ratio_Analysis_New.ppt
 

Plus de Walid Saafan

Mclaren the banking sector v2
Mclaren the banking sector v2Mclaren the banking sector v2
Mclaren the banking sector v2Walid Saafan
 
EGP flotation impact on some banks
EGP flotation impact on some banksEGP flotation impact on some banks
EGP flotation impact on some banksWalid Saafan
 
ABK Egypt financial statements H1 18
ABK Egypt financial statements H1 18ABK Egypt financial statements H1 18
ABK Egypt financial statements H1 18Walid Saafan
 
ABK Egypt financials' summary H1-18
ABK Egypt financials' summary H1-18ABK Egypt financials' summary H1-18
ABK Egypt financials' summary H1-18Walid Saafan
 
NBK Egypt financial statement H1-18
NBK Egypt financial statement H1-18NBK Egypt financial statement H1-18
NBK Egypt financial statement H1-18Walid Saafan
 
NBK-Egypt financials summary H1-18
NBK-Egypt financials summary H1-18NBK-Egypt financials summary H1-18
NBK-Egypt financials summary H1-18Walid Saafan
 
Facebook effect on SMEs in Egypt
Facebook effect on SMEs in EgyptFacebook effect on SMEs in Egypt
Facebook effect on SMEs in EgyptWalid Saafan
 
Infographic: Fastest growing Egyptian banks in t.assets 03.2016
Infographic: Fastest growing Egyptian banks in t.assets 03.2016Infographic: Fastest growing Egyptian banks in t.assets 03.2016
Infographic: Fastest growing Egyptian banks in t.assets 03.2016Walid Saafan
 
Branch location for selected banks
Branch location for selected banksBranch location for selected banks
Branch location for selected banksWalid Saafan
 
Entrepreneurship as disease
Entrepreneurship as diseaseEntrepreneurship as disease
Entrepreneurship as diseaseWalid Saafan
 
Corporate values' Evaluation
Corporate values' EvaluationCorporate values' Evaluation
Corporate values' EvaluationWalid Saafan
 
Strategic Alliance
Strategic AllianceStrategic Alliance
Strategic AllianceWalid Saafan
 
'Blue Ocean Strategy' book review
'Blue Ocean Strategy' book review'Blue Ocean Strategy' book review
'Blue Ocean Strategy' book reviewWalid Saafan
 
Egypt privatization program
Egypt privatization programEgypt privatization program
Egypt privatization programWalid Saafan
 
Strategic Alliance failure
Strategic Alliance failureStrategic Alliance failure
Strategic Alliance failureWalid Saafan
 
Basel II – Integrated Risk Capital
Basel II – Integrated Risk CapitalBasel II – Integrated Risk Capital
Basel II – Integrated Risk CapitalWalid Saafan
 
Options trading markets
Options trading marketsOptions trading markets
Options trading marketsWalid Saafan
 
How are banking ratios compiled
How are banking ratios compiledHow are banking ratios compiled
How are banking ratios compiledWalid Saafan
 
Corporate culture a source for competitive advantage
Corporate culture a source for competitive advantageCorporate culture a source for competitive advantage
Corporate culture a source for competitive advantageWalid Saafan
 

Plus de Walid Saafan (20)

Mclaren the banking sector v2
Mclaren the banking sector v2Mclaren the banking sector v2
Mclaren the banking sector v2
 
EGP flotation impact on some banks
EGP flotation impact on some banksEGP flotation impact on some banks
EGP flotation impact on some banks
 
ABK Egypt financial statements H1 18
ABK Egypt financial statements H1 18ABK Egypt financial statements H1 18
ABK Egypt financial statements H1 18
 
ABK Egypt financials' summary H1-18
ABK Egypt financials' summary H1-18ABK Egypt financials' summary H1-18
ABK Egypt financials' summary H1-18
 
NBK Egypt financial statement H1-18
NBK Egypt financial statement H1-18NBK Egypt financial statement H1-18
NBK Egypt financial statement H1-18
 
NBK-Egypt financials summary H1-18
NBK-Egypt financials summary H1-18NBK-Egypt financials summary H1-18
NBK-Egypt financials summary H1-18
 
Facebook effect on SMEs in Egypt
Facebook effect on SMEs in EgyptFacebook effect on SMEs in Egypt
Facebook effect on SMEs in Egypt
 
Infographic: Fastest growing Egyptian banks in t.assets 03.2016
Infographic: Fastest growing Egyptian banks in t.assets 03.2016Infographic: Fastest growing Egyptian banks in t.assets 03.2016
Infographic: Fastest growing Egyptian banks in t.assets 03.2016
 
Branch location for selected banks
Branch location for selected banksBranch location for selected banks
Branch location for selected banks
 
Entrepreneurship as disease
Entrepreneurship as diseaseEntrepreneurship as disease
Entrepreneurship as disease
 
Corporate values' Evaluation
Corporate values' EvaluationCorporate values' Evaluation
Corporate values' Evaluation
 
Strategic Alliance
Strategic AllianceStrategic Alliance
Strategic Alliance
 
'Blue Ocean Strategy' book review
'Blue Ocean Strategy' book review'Blue Ocean Strategy' book review
'Blue Ocean Strategy' book review
 
Egypt privatization program
Egypt privatization programEgypt privatization program
Egypt privatization program
 
Strategic Alliance failure
Strategic Alliance failureStrategic Alliance failure
Strategic Alliance failure
 
Basel II – Integrated Risk Capital
Basel II – Integrated Risk CapitalBasel II – Integrated Risk Capital
Basel II – Integrated Risk Capital
 
Options trading markets
Options trading marketsOptions trading markets
Options trading markets
 
How are banking ratios compiled
How are banking ratios compiledHow are banking ratios compiled
How are banking ratios compiled
 
Corporate culture a source for competitive advantage
Corporate culture a source for competitive advantageCorporate culture a source for competitive advantage
Corporate culture a source for competitive advantage
 
What is STRATEGY?
What is STRATEGY?What is STRATEGY?
What is STRATEGY?
 

How are banking ratios compiled

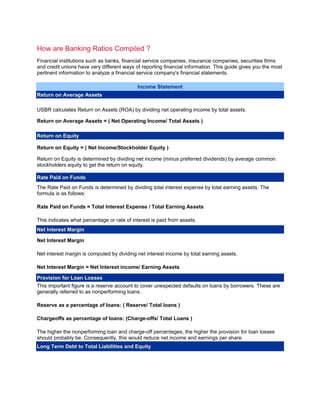
  • 1. How are Banking Ratios Compiled ? Financial institutions such as banks, financial service companies, insurance companies, securities firms and credit unions have very different ways of reporting financial information. This guide gives you the most pertinent information to analyze a financial service company's financial statements. Income Statement Return on Average Assets USBR calculates Return on Assets (ROA) by dividing net operating income by total assets. Return on Average Assets = ( Net Operating Income/ Total Assets ) Return on Equity Return on Equity = ( Net Income/Stockholder Equity ) Return on Equity is determined by dividing net income (minus preferred dividends) by average common stockholders equity to get the return on equity. Rate Paid on Funds The Rate Paid on Funds is determined by dividing total interest expense by total earning assets. The formula is as follows: Rate Paid on Funds = Total Interest Expense / Total Earning Assets This indicates what percentage or rate of interest is paid from assets. Net Interest Margin Net Interest Margin Net interest margin is computed by dividing net interest income by total earning assets. Net Interest Margin = Net Interest income/ Earning Assets Provision for Loan Losses This important figure is a reserve account to cover unexpected defaults on loans by borrowers. These are generally referred to as nonperforming loans. Reserve as a percentage of loans: ( Reserve/ Total loans ) Chargeoffs as percentage of loans: (Charge-offs/ Total Loans ) The higher the nonperforming loan and charge-off percentages, the higher the provision for loan losses should probably be. Consequently, this would reduce net income and earnings per share. Long Term Debt to Total Liabilities and Equity
  • 2. The higher this figure, the more difficult it would be for a bank to borrow more funds.This figure is determined as follows: Long Term Debt to Total Liabilities and Equity = ( Long Term Debt / Total Liabilities plus Equity ) Loans to Assets The loans to assets ratio measures the total loans outstanding as a percentage of total assets. The higher this ratio indicates a bank is loaned up and its liquidity is low. The higher the ratio, the more risky a bank may be to higher defaults. This figure is determined as follows: Loans to Assets = ( Loans / Total Assets ) Equity to Assets Equity to total assets is a common measure used to analyze capital adequancy of a bank. This figure is determined as follows: Equity to Assets = ( Stockholders Equity / Average Total Assets ) Equity to Loans Equity to Loans reflects the degree of equity coverage to outstanding loans. This figure is determined as follows: Equity to Loans = ( Average Common Equity / Average Total Assets ) Tier I Capital Tier I Banks must maintain a ratio which is within the guidelines set by the FDIC guidelines. This figure is determined as follows: Tier 1 Capital = ( Stockholder Equity/ Risk-Adjusted Assets ) Total Capital Total Capital includes Tier I and the reserve for loan losses ( up to 1.25 % of Risk Adjusted Capital) plus subordinated notes (to 50 percent of Tier I capital). This figure is also set by FDIC guidelines.