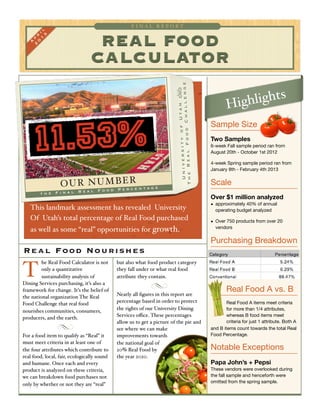
1. REAL FOOD
CALCULATOR
F I N A L R E P O R T
A
p
r
il
2
0
1
3
t h e F i n a l R e a l F o o d P e r c e n t a g e
This landmark assessment has revealed University
Of Utah’s total percentage of Real Food purchased
as well as some “real” opportunities for growth.
OUR NUMBER
he Real Food Calculator is not
only a quantitative
sustainability analysis of
Dining Services purchasing, it’s also a
framework for change. It’s the belief of
the national organization The Real
Food Challenge that real food
nourishes communities, consumers,
producers, and the earth.
For a food item to qualify as “Real” it
must meet criteria in at least one of
the four attributes which contribute to
real food, local, fair, ecologically sound
and humane. Once each and every
product is analyzed on these criteria,
we can breakdown food purchases not
only by whether or not they are “real”
but also what food product category
they fall under or what real food
attribute they contain.
Nearly all figures in this report are
percentage based in order to protect
the rights of our University Dining
Services office. These percentages
allow us to get a picture of the pie and
see where we can make
improvements towards
the national goal of
20% Real Food by
the year 2020.
Sample Size
Two Samples
6-week Fall sample period ran from
August 20th - October 1st 2012
4-week Spring sample period ran from
January 8th - February 4th 2013
Scale
Over $1 million analyzed
• approximately 40% of annual
operating budget analyzed
• Over 750 products from over 20
vendors
Purchasing Breakdown
Real Food A vs. B
Real Food A items meet criteria
for more than 1/4 attributes,
whereas B food items meet
criteria for just 1 attribute. Both A
and B items count towards the total Real
Food Percentage.
Notable Exceptions
Papa John’s + Pepsi
These vendors were overlooked during
the fall sample and henceforth were
omitted from the spring sample.
Real Food Nourishes
T
UniversityofUtah
TheRealFoodChallenge
Highlights
I m a g e c o u r t e s y o f t h e U n i v e r s i t y o f U t a h