SlideShare une entreprise Scribd logo
1  sur  1
Validation of Yeast Cell Analysis Using Automated Image Cytometry
Andrew Yourick, Will Pelland, Kelsey Wahl
Department of Food Science & Human Nutrition, Colorado State University, Fort Collins, CO
Abstract
Test samples of Saccharomyces cerevisiae are routinely procured in
breweries all over the world in order to be analyzed for viability, vitality,
and to conduct cell counts. While these analyses are typically done
manually with a hemocytometer and microscope, new, more automated
technology is gaining popularity. This study looked to validate the
measurements of viability, vitality, and cell counts by comparing the results
of flow cytometry to that of a Nexcelom Cellometer. Methods of
measurement were developed according to the manufacturer of each
instrument. Each instrument was tested using yeast samples of the same
treatment prior to analysis. Data was acquired then evaluated using
Analysis of Variance statistical methods to determine how each yeast
analysis instrument compared to the other.
Introduction
Consistent fermentation and yeast parameters are crucial in maintaining
quality standards in a brewery. This Includes:
• Concentration:
o The amount of yeast cells that are held in a given yeast slurry.
Measured in cells/mL.
• Viability:
o A percentage of living vs. dead cells in a yeast solution, quantified by
the amount of yeast with intact membranes. Measured with
propidium iodide (PI).
• Vitality:
o Yeast that has a measurable level of metabolic activity and the ability
to proliferate. Measured with carboxyfluorescein diacetate (CFDA).
Special Thanks To:
Jeff Biegert – New Belgium Brewery, Colorado State University (adjunct
faculty)
Chris Allen – Colorado State University (Flow Cytometry)
Katie Fromuth –Colorado State University (Brewing Laboratory)
References
1. Laverty D, et al. Journal of Industrial Microbiology & Biotechnology. June 2013; 40(6):581-588.
2.Chan L, et al. Journal Of Industrial Microbiology & Biotechnology. November 2012; 39(11):1615-1623.
3.Saldi S, et al. Journal of the American Society of Brewing Chemists. 2014; 72(4):253-260.
4.Boyd, Andrew, et al. FEMS Yeast Research. ELSEVIER, 10 July 2002.
5.Yeast Concentration and Viability using Image-Based Fluorescence Analysis. Nexcelcom, (2013).
6.Briggs DE, Boulton CA, Brookes PA, Stevens R. Brewing: Science And Practice. Boca Raton: CRC Press; 2004.
7.User’s Manual for Cellometer, X2. Lawrence, MA. Nexcelcom (2013)
Results
• Cell concentration measurements are higher when using the
Cellometer compared to the flow cytometer.
• PI and CFDA measurements are higher when using the Cellometer
compared to the flow cytometer
• PI + CFDA percentages for the flow cytometer are near 100% for
every sample
Methods
• Three yeast samples were taken from yeast storage tanks at New
Belgium Brewery (NBB). One thin slurry (S4), one thick slurry
(S2), and one medium slurry (S3).
• Samples were transported to CSU for processing and testing in
sterile 1L bottles.
• Two more yeast samples were created, one by diluting 4:1 S4:PBS
(S1) and the other via centrifugation of S2 (S5).
• All five yeast samples were then diluted 1:25 with 50mM
EDTA+PBS by one operator to minimize multi-user error.
• See Figure 1 for dilution schematic.
• 110µL of each yeast sample was aliquoted in triplicate into micro-
centrifuge tubes where 110µL of either CFDA or PI were added.
• The CFDA samples were incubated for 45 minutes at 30°C.
• 40µL of each sample was aliquoted off for use by the Cellometer,
the remaining 180µL was used for Flow Cytometry.
• Unstained yeast samples plus counting beads were used for cell
concentration measurement by the Flow Cytometer.
• 20µL of dyed sample is loaded onto a Cellometer counting
chamber and loaded into the machine.
• All Cellometer settings were the same settings used at NBB.
Conclusion
When compared to the flow cytometer, the Cellometer over-
estimated cell counts, viability, and vitality measurements. The
vitality measurement is measuring dead yeast cells where viability is
measuring live cells. Theoretically, if these measurements are
added together the result should be 100% of cells in a sample being
accounted for. Figure 5 shows that the flow cytometer is near 100%
when the data is added; whereas the Cellometer is consistently
higher than 100%. One other factor that is apparent in the data is
the amount of human error introduced by pipetting. The raw data
is highly variable for the Cellometer, even though one person
performed all of the pipetting. Future experiments need to be
performed on ways to reduce the number of dilutions and pipetting
to minimize this error. If the Cellometer overestimates cell counts,
viability, and vitality it could result in underpitching yeast. However,
it may be possible to determine different settings so that the
Cellometer is more accurate, as this technology is more affordable
and accessible for breweries. Future research also needs to be
done with different models of flow cytometery to accurately
calculate cell counts. This is currently done with counting beads
and a calculation, however, this can be variable with human and
pipetting error. Another model of flow cytometer will be used that
accurately measures the volume of a sample and removes the
counting beads.
Figure 3 Graph showing the percentage of yeast cells positive for PI. These cells
are considered dead or metabolically inactive.
Figure 4 Graph showing the percentage of yeast cells positive for CFDA. These cells
are considered metabolically active.
Figure 5 Graph showing the additive percentage of yeast cells positive for both PI
and CFDA. Theoretically, the percentages should be 100%, accounting for all cells
in the sample.
Figure 6 Graph showing the cell concentrations for each sample and yeast
measurement machine. The Cellometer is much higher for cell counts for every
sample compared to the flow cytometer.
Figure 2 Picture of Cellometer bright field image. Green circled cells are
being counted for cell concentrations. Yellow circles are not counted and
indicate cells larger than indicated settings.

Contenu connexe

Tendances

The External Quality Assessment [EQA] analysis achievement for excellent perf...
The External Quality Assessment [EQA] analysis achievement for excellent perf...The External Quality Assessment [EQA] analysis achievement for excellent perf...
The External Quality Assessment [EQA] analysis achievement for excellent perf...kridsada31
 
SF-2016-64-Isolation-and-Identification-of-Staphylococci-Isolated-From-Bovine...
SF-2016-64-Isolation-and-Identification-of-Staphylococci-Isolated-From-Bovine...SF-2016-64-Isolation-and-Identification-of-Staphylococci-Isolated-From-Bovine...
SF-2016-64-Isolation-and-Identification-of-Staphylococci-Isolated-From-Bovine...shadia lazim
 
Gene transfer in the liver using recombinant adeno-associated virus
Gene transfer in the liver using recombinant adeno-associated virusGene transfer in the liver using recombinant adeno-associated virus
Gene transfer in the liver using recombinant adeno-associated virusJonathan G. Godwin
 
Current Applications of Quasi Vivo
Current Applications of Quasi VivoCurrent Applications of Quasi Vivo
Current Applications of Quasi VivoSCIMS4
 
Detection of mutation by ames test
Detection of mutation by ames testDetection of mutation by ames test
Detection of mutation by ames testSambit Kumar Dwibedy
 
Prevalence of antibiotic resistant escherichia coli in healthy male and femal...
Prevalence of antibiotic resistant escherichia coli in healthy male and femal...Prevalence of antibiotic resistant escherichia coli in healthy male and femal...
Prevalence of antibiotic resistant escherichia coli in healthy male and femal...Alexander Decker
 
Effect of Selenium Incorporated In Feed on the Hematological Profile of Oreoc...
Effect of Selenium Incorporated In Feed on the Hematological Profile of Oreoc...Effect of Selenium Incorporated In Feed on the Hematological Profile of Oreoc...
Effect of Selenium Incorporated In Feed on the Hematological Profile of Oreoc...Conferenceproceedings
 
Alkaline hydrolysis-of-prion-positive-materials-r-murphy
Alkaline hydrolysis-of-prion-positive-materials-r-murphyAlkaline hydrolysis-of-prion-positive-materials-r-murphy
Alkaline hydrolysis-of-prion-positive-materials-r-murphyIIAD
 
Sarah's INBRE poster updated Aug 11 LL FINAL-2
Sarah's INBRE poster updated Aug 11 LL FINAL-2Sarah's INBRE poster updated Aug 11 LL FINAL-2
Sarah's INBRE poster updated Aug 11 LL FINAL-2Sarah Sanders
 
PATHOGENICITY AND ANTIBIOTIC SENSITIVITY OF ESCHERICHIA COLI ISOLATED FROM SU...
PATHOGENICITY AND ANTIBIOTIC SENSITIVITY OF ESCHERICHIA COLI ISOLATED FROM SU...PATHOGENICITY AND ANTIBIOTIC SENSITIVITY OF ESCHERICHIA COLI ISOLATED FROM SU...
PATHOGENICITY AND ANTIBIOTIC SENSITIVITY OF ESCHERICHIA COLI ISOLATED FROM SU...Dr. Jibachha Sah
 
Nucleic acid extraction from FFPE cell blocks
Nucleic acid extraction from FFPE cell blocks Nucleic acid extraction from FFPE cell blocks
Nucleic acid extraction from FFPE cell blocks Caroline Seiler
 
Virulence Phenotype, Physicochemical Properties and Biofilm Formation of Pseu...
Virulence Phenotype, Physicochemical Properties and Biofilm Formation of Pseu...Virulence Phenotype, Physicochemical Properties and Biofilm Formation of Pseu...
Virulence Phenotype, Physicochemical Properties and Biofilm Formation of Pseu...IJERA Editor
 
Internship - FMRI, Gurgaon (Dec '18 - Jan '19)
Internship - FMRI, Gurgaon (Dec '18 - Jan '19) Internship - FMRI, Gurgaon (Dec '18 - Jan '19)
Internship - FMRI, Gurgaon (Dec '18 - Jan '19) AryanDugar
 
Baquba teaching lab- المختبرات التعليمية في مستشفى بعقوبة التعليمي
Baquba teaching lab- المختبرات التعليمية في مستشفى بعقوبة التعليميBaquba teaching lab- المختبرات التعليمية في مستشفى بعقوبة التعليمي
Baquba teaching lab- المختبرات التعليمية في مستشفى بعقوبة التعليميDrm Aliraqi
 
Microbiological-examination-methods-of-food-and-water-a-laboratory-manual
Microbiological-examination-methods-of-food-and-water-a-laboratory-manualMicrobiological-examination-methods-of-food-and-water-a-laboratory-manual
Microbiological-examination-methods-of-food-and-water-a-laboratory-manualNagarajan Abimannan
 
Measuring parameters of Bovine Enterovirus infection
Measuring parameters of Bovine Enterovirus infectionMeasuring parameters of Bovine Enterovirus infection
Measuring parameters of Bovine Enterovirus infectionMatthew Dower
 

Tendances (20)

The External Quality Assessment [EQA] analysis achievement for excellent perf...
The External Quality Assessment [EQA] analysis achievement for excellent perf...The External Quality Assessment [EQA] analysis achievement for excellent perf...
The External Quality Assessment [EQA] analysis achievement for excellent perf...
 
SF-2016-64-Isolation-and-Identification-of-Staphylococci-Isolated-From-Bovine...
SF-2016-64-Isolation-and-Identification-of-Staphylococci-Isolated-From-Bovine...SF-2016-64-Isolation-and-Identification-of-Staphylococci-Isolated-From-Bovine...
SF-2016-64-Isolation-and-Identification-of-Staphylococci-Isolated-From-Bovine...
 
Gene transfer in the liver using recombinant adeno-associated virus
Gene transfer in the liver using recombinant adeno-associated virusGene transfer in the liver using recombinant adeno-associated virus
Gene transfer in the liver using recombinant adeno-associated virus
 
Current Applications of Quasi Vivo
Current Applications of Quasi VivoCurrent Applications of Quasi Vivo
Current Applications of Quasi Vivo
 
Detection of mutation by ames test
Detection of mutation by ames testDetection of mutation by ames test
Detection of mutation by ames test
 
Prevalence of antibiotic resistant escherichia coli in healthy male and femal...
Prevalence of antibiotic resistant escherichia coli in healthy male and femal...Prevalence of antibiotic resistant escherichia coli in healthy male and femal...
Prevalence of antibiotic resistant escherichia coli in healthy male and femal...
 
Effect of Selenium Incorporated In Feed on the Hematological Profile of Oreoc...
Effect of Selenium Incorporated In Feed on the Hematological Profile of Oreoc...Effect of Selenium Incorporated In Feed on the Hematological Profile of Oreoc...
Effect of Selenium Incorporated In Feed on the Hematological Profile of Oreoc...
 
Alkaline hydrolysis-of-prion-positive-materials-r-murphy
Alkaline hydrolysis-of-prion-positive-materials-r-murphyAlkaline hydrolysis-of-prion-positive-materials-r-murphy
Alkaline hydrolysis-of-prion-positive-materials-r-murphy
 
Sarah's INBRE poster updated Aug 11 LL FINAL-2
Sarah's INBRE poster updated Aug 11 LL FINAL-2Sarah's INBRE poster updated Aug 11 LL FINAL-2
Sarah's INBRE poster updated Aug 11 LL FINAL-2
 
M0557376
M0557376M0557376
M0557376
 
PATHOGENICITY AND ANTIBIOTIC SENSITIVITY OF ESCHERICHIA COLI ISOLATED FROM SU...
PATHOGENICITY AND ANTIBIOTIC SENSITIVITY OF ESCHERICHIA COLI ISOLATED FROM SU...PATHOGENICITY AND ANTIBIOTIC SENSITIVITY OF ESCHERICHIA COLI ISOLATED FROM SU...
PATHOGENICITY AND ANTIBIOTIC SENSITIVITY OF ESCHERICHIA COLI ISOLATED FROM SU...
 
Nucleic acid extraction from FFPE cell blocks
Nucleic acid extraction from FFPE cell blocks Nucleic acid extraction from FFPE cell blocks
Nucleic acid extraction from FFPE cell blocks
 
Virulence Phenotype, Physicochemical Properties and Biofilm Formation of Pseu...
Virulence Phenotype, Physicochemical Properties and Biofilm Formation of Pseu...Virulence Phenotype, Physicochemical Properties and Biofilm Formation of Pseu...
Virulence Phenotype, Physicochemical Properties and Biofilm Formation of Pseu...
 
paper
paperpaper
paper
 
Be 4100 poster
Be 4100 posterBe 4100 poster
Be 4100 poster
 
Internship - FMRI, Gurgaon (Dec '18 - Jan '19)
Internship - FMRI, Gurgaon (Dec '18 - Jan '19) Internship - FMRI, Gurgaon (Dec '18 - Jan '19)
Internship - FMRI, Gurgaon (Dec '18 - Jan '19)
 
Baquba teaching lab- المختبرات التعليمية في مستشفى بعقوبة التعليمي
Baquba teaching lab- المختبرات التعليمية في مستشفى بعقوبة التعليميBaquba teaching lab- المختبرات التعليمية في مستشفى بعقوبة التعليمي
Baquba teaching lab- المختبرات التعليمية في مستشفى بعقوبة التعليمي
 
NHRP!
NHRP!NHRP!
NHRP!
 
Microbiological-examination-methods-of-food-and-water-a-laboratory-manual
Microbiological-examination-methods-of-food-and-water-a-laboratory-manualMicrobiological-examination-methods-of-food-and-water-a-laboratory-manual
Microbiological-examination-methods-of-food-and-water-a-laboratory-manual
 
Measuring parameters of Bovine Enterovirus infection
Measuring parameters of Bovine Enterovirus infectionMeasuring parameters of Bovine Enterovirus infection
Measuring parameters of Bovine Enterovirus infection
 

Similaire à FTEC 492 Poster

Techniques in biochemistry laboratoty
Techniques in biochemistry laboratotyTechniques in biochemistry laboratoty
Techniques in biochemistry laboratotybio_epi_gen
 
Accurate Cell Counters for CAR T Therapy
Accurate Cell Counters for  CAR T TherapyAccurate Cell Counters for  CAR T Therapy
Accurate Cell Counters for CAR T TherapyNexcelom-Bioscience
 
Accurate Cell Counters for CAR T Therapy
Accurate Cell Counters for  CAR T TherapyAccurate Cell Counters for  CAR T Therapy
Accurate Cell Counters for CAR T Therapynexcelom
 
Up to Speed: Cell Culture Development. European Biopharmaceutical Review July...
Up to Speed: Cell Culture Development. European Biopharmaceutical Review July...Up to Speed: Cell Culture Development. European Biopharmaceutical Review July...
Up to Speed: Cell Culture Development. European Biopharmaceutical Review July...KBI Biopharma
 
High-throughput Miniaturized Bioreactors for Cell Culture Process Developmen...
High-throughput Miniaturized Bioreactors for Cell Culture  Process Developmen...High-throughput Miniaturized Bioreactors for Cell Culture  Process Developmen...
High-throughput Miniaturized Bioreactors for Cell Culture Process Developmen...KBI Biopharma
 
Measurement of microbial growth
Measurement of microbial growthMeasurement of microbial growth
Measurement of microbial growthKalavati Prajapati
 
4 Factors That Affect Research Reproducibility
4 Factors That Affect Research Reproducibility4 Factors That Affect Research Reproducibility
4 Factors That Affect Research ReproducibilityCellero
 
Biotechnology and gene expression profiling for mechanistic understanding of ...
Biotechnology and gene expression profiling for mechanistic understanding of ...Biotechnology and gene expression profiling for mechanistic understanding of ...
Biotechnology and gene expression profiling for mechanistic understanding of ...Hana Fayed
 
Biol500 Cell Growth & Kinetics
Biol500 Cell Growth & KineticsBiol500 Cell Growth & Kinetics
Biol500 Cell Growth & KineticsFaryn
 
Isolating Primary Cells 101
Isolating Primary Cells 101Isolating Primary Cells 101
Isolating Primary Cells 101allcells
 
High Throughput Purification and Characterization of a Protein Variant Library
High Throughput Purification and Characterization of a Protein Variant LibraryHigh Throughput Purification and Characterization of a Protein Variant Library
High Throughput Purification and Characterization of a Protein Variant LibraryChris Suh
 
Continuous On-Line Microbial Monitoring of Pharmaceutical Waters
Continuous On-Line Microbial Monitoring of Pharmaceutical WatersContinuous On-Line Microbial Monitoring of Pharmaceutical Waters
Continuous On-Line Microbial Monitoring of Pharmaceutical WatersAlliance Technical Sales, Inc.
 
Scalability of Cell Culture Processes in Single-use Bioreactors using Differe...
Scalability of Cell Culture Processes in Single-use Bioreactors using Differe...Scalability of Cell Culture Processes in Single-use Bioreactors using Differe...
Scalability of Cell Culture Processes in Single-use Bioreactors using Differe...KBI Biopharma
 
Identification of bacteria for micro.pptx
Identification of bacteria for micro.pptxIdentification of bacteria for micro.pptx
Identification of bacteria for micro.pptxRamDayalVishwakarma
 
Undergraduate Research Conference Poster 2015
Undergraduate Research Conference Poster 2015Undergraduate Research Conference Poster 2015
Undergraduate Research Conference Poster 2015Kendra Liu
 
Validation of bevacizumab elisa ich q2 ver3,0 dt14.03
Validation of bevacizumab elisa   ich q2 ver3,0 dt14.03Validation of bevacizumab elisa   ich q2 ver3,0 dt14.03
Validation of bevacizumab elisa ich q2 ver3,0 dt14.03krishgen
 

Similaire à FTEC 492 Poster (20)

Techniques in biochemistry laboratoty
Techniques in biochemistry laboratotyTechniques in biochemistry laboratoty
Techniques in biochemistry laboratoty
 
Accurate Cell Counters for CAR T Therapy
Accurate Cell Counters for  CAR T TherapyAccurate Cell Counters for  CAR T Therapy
Accurate Cell Counters for CAR T Therapy
 
Accurate Cell Counters for CAR T Therapy
Accurate Cell Counters for  CAR T TherapyAccurate Cell Counters for  CAR T Therapy
Accurate Cell Counters for CAR T Therapy
 
Up to Speed: Cell Culture Development. European Biopharmaceutical Review July...
Up to Speed: Cell Culture Development. European Biopharmaceutical Review July...Up to Speed: Cell Culture Development. European Biopharmaceutical Review July...
Up to Speed: Cell Culture Development. European Biopharmaceutical Review July...
 
High-throughput Miniaturized Bioreactors for Cell Culture Process Developmen...
High-throughput Miniaturized Bioreactors for Cell Culture  Process Developmen...High-throughput Miniaturized Bioreactors for Cell Culture  Process Developmen...
High-throughput Miniaturized Bioreactors for Cell Culture Process Developmen...
 
Measurement of microbial growth
Measurement of microbial growthMeasurement of microbial growth
Measurement of microbial growth
 
4 Factors That Affect Research Reproducibility
4 Factors That Affect Research Reproducibility4 Factors That Affect Research Reproducibility
4 Factors That Affect Research Reproducibility
 
Biotechnology and gene expression profiling for mechanistic understanding of ...
Biotechnology and gene expression profiling for mechanistic understanding of ...Biotechnology and gene expression profiling for mechanistic understanding of ...
Biotechnology and gene expression profiling for mechanistic understanding of ...
 
Bacterial Cells Enumeration
Bacterial Cells EnumerationBacterial Cells Enumeration
Bacterial Cells Enumeration
 
anti tumor 1.doc
anti tumor 1.docanti tumor 1.doc
anti tumor 1.doc
 
Biol500 Cell Growth & Kinetics
Biol500 Cell Growth & KineticsBiol500 Cell Growth & Kinetics
Biol500 Cell Growth & Kinetics
 
Flowcytometry
FlowcytometryFlowcytometry
Flowcytometry
 
Isolating Primary Cells 101
Isolating Primary Cells 101Isolating Primary Cells 101
Isolating Primary Cells 101
 
High Throughput Purification and Characterization of a Protein Variant Library
High Throughput Purification and Characterization of a Protein Variant LibraryHigh Throughput Purification and Characterization of a Protein Variant Library
High Throughput Purification and Characterization of a Protein Variant Library
 
GROUP 3.pptx
GROUP 3.pptxGROUP 3.pptx
GROUP 3.pptx
 
Continuous On-Line Microbial Monitoring of Pharmaceutical Waters
Continuous On-Line Microbial Monitoring of Pharmaceutical WatersContinuous On-Line Microbial Monitoring of Pharmaceutical Waters
Continuous On-Line Microbial Monitoring of Pharmaceutical Waters
 
Scalability of Cell Culture Processes in Single-use Bioreactors using Differe...
Scalability of Cell Culture Processes in Single-use Bioreactors using Differe...Scalability of Cell Culture Processes in Single-use Bioreactors using Differe...
Scalability of Cell Culture Processes in Single-use Bioreactors using Differe...
 
Identification of bacteria for micro.pptx
Identification of bacteria for micro.pptxIdentification of bacteria for micro.pptx
Identification of bacteria for micro.pptx
 
Undergraduate Research Conference Poster 2015
Undergraduate Research Conference Poster 2015Undergraduate Research Conference Poster 2015
Undergraduate Research Conference Poster 2015
 
Validation of bevacizumab elisa ich q2 ver3,0 dt14.03
Validation of bevacizumab elisa   ich q2 ver3,0 dt14.03Validation of bevacizumab elisa   ich q2 ver3,0 dt14.03
Validation of bevacizumab elisa ich q2 ver3,0 dt14.03
 

Plus de William Pelland

Plus de William Pelland (6)

final project FTEC (modified) (1)
final project FTEC (modified) (1)final project FTEC (modified) (1)
final project FTEC (modified) (1)
 
FTEC_460LR3
FTEC_460LR3FTEC_460LR3
FTEC_460LR3
 
422labreport
422labreport422labreport
422labreport
 
ERHS220 poster
ERHS220 posterERHS220 poster
ERHS220 poster
 
PvOResearchPaper
PvOResearchPaperPvOResearchPaper
PvOResearchPaper
 
OdellResume
OdellResumeOdellResume
OdellResume
 

FTEC 492 Poster

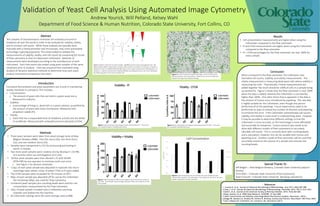
  • 1. Validation of Yeast Cell Analysis Using Automated Image Cytometry Andrew Yourick, Will Pelland, Kelsey Wahl Department of Food Science & Human Nutrition, Colorado State University, Fort Collins, CO Abstract Test samples of Saccharomyces cerevisiae are routinely procured in breweries all over the world in order to be analyzed for viability, vitality, and to conduct cell counts. While these analyses are typically done manually with a hemocytometer and microscope, new, more automated technology is gaining popularity. This study looked to validate the measurements of viability, vitality, and cell counts by comparing the results of flow cytometry to that of a Nexcelom Cellometer. Methods of measurement were developed according to the manufacturer of each instrument. Each instrument was tested using yeast samples of the same treatment prior to analysis. Data was acquired then evaluated using Analysis of Variance statistical methods to determine how each yeast analysis instrument compared to the other. Introduction Consistent fermentation and yeast parameters are crucial in maintaining quality standards in a brewery. This Includes: • Concentration: o The amount of yeast cells that are held in a given yeast slurry. Measured in cells/mL. • Viability: o A percentage of living vs. dead cells in a yeast solution, quantified by the amount of yeast with intact membranes. Measured with propidium iodide (PI). • Vitality: o Yeast that has a measurable level of metabolic activity and the ability to proliferate. Measured with carboxyfluorescein diacetate (CFDA). Special Thanks To: Jeff Biegert – New Belgium Brewery, Colorado State University (adjunct faculty) Chris Allen – Colorado State University (Flow Cytometry) Katie Fromuth –Colorado State University (Brewing Laboratory) References 1. Laverty D, et al. Journal of Industrial Microbiology & Biotechnology. June 2013; 40(6):581-588. 2.Chan L, et al. Journal Of Industrial Microbiology & Biotechnology. November 2012; 39(11):1615-1623. 3.Saldi S, et al. Journal of the American Society of Brewing Chemists. 2014; 72(4):253-260. 4.Boyd, Andrew, et al. FEMS Yeast Research. ELSEVIER, 10 July 2002. 5.Yeast Concentration and Viability using Image-Based Fluorescence Analysis. Nexcelcom, (2013). 6.Briggs DE, Boulton CA, Brookes PA, Stevens R. Brewing: Science And Practice. Boca Raton: CRC Press; 2004. 7.User’s Manual for Cellometer, X2. Lawrence, MA. Nexcelcom (2013) Results • Cell concentration measurements are higher when using the Cellometer compared to the flow cytometer. • PI and CFDA measurements are higher when using the Cellometer compared to the flow cytometer • PI + CFDA percentages for the flow cytometer are near 100% for every sample Methods • Three yeast samples were taken from yeast storage tanks at New Belgium Brewery (NBB). One thin slurry (S4), one thick slurry (S2), and one medium slurry (S3). • Samples were transported to CSU for processing and testing in sterile 1L bottles. • Two more yeast samples were created, one by diluting 4:1 S4:PBS (S1) and the other via centrifugation of S2 (S5). • All five yeast samples were then diluted 1:25 with 50mM EDTA+PBS by one operator to minimize multi-user error. • See Figure 1 for dilution schematic. • 110µL of each yeast sample was aliquoted in triplicate into micro- centrifuge tubes where 110µL of either CFDA or PI were added. • The CFDA samples were incubated for 45 minutes at 30°C. • 40µL of each sample was aliquoted off for use by the Cellometer, the remaining 180µL was used for Flow Cytometry. • Unstained yeast samples plus counting beads were used for cell concentration measurement by the Flow Cytometer. • 20µL of dyed sample is loaded onto a Cellometer counting chamber and loaded into the machine. • All Cellometer settings were the same settings used at NBB. Conclusion When compared to the flow cytometer, the Cellometer over- estimated cell counts, viability, and vitality measurements. The vitality measurement is measuring dead yeast cells where viability is measuring live cells. Theoretically, if these measurements are added together the result should be 100% of cells in a sample being accounted for. Figure 5 shows that the flow cytometer is near 100% when the data is added; whereas the Cellometer is consistently higher than 100%. One other factor that is apparent in the data is the amount of human error introduced by pipetting. The raw data is highly variable for the Cellometer, even though one person performed all of the pipetting. Future experiments need to be performed on ways to reduce the number of dilutions and pipetting to minimize this error. If the Cellometer overestimates cell counts, viability, and vitality it could result in underpitching yeast. However, it may be possible to determine different settings so that the Cellometer is more accurate, as this technology is more affordable and accessible for breweries. Future research also needs to be done with different models of flow cytometery to accurately calculate cell counts. This is currently done with counting beads and a calculation, however, this can be variable with human and pipetting error. Another model of flow cytometer will be used that accurately measures the volume of a sample and removes the counting beads. Figure 3 Graph showing the percentage of yeast cells positive for PI. These cells are considered dead or metabolically inactive. Figure 4 Graph showing the percentage of yeast cells positive for CFDA. These cells are considered metabolically active. Figure 5 Graph showing the additive percentage of yeast cells positive for both PI and CFDA. Theoretically, the percentages should be 100%, accounting for all cells in the sample. Figure 6 Graph showing the cell concentrations for each sample and yeast measurement machine. The Cellometer is much higher for cell counts for every sample compared to the flow cytometer. Figure 2 Picture of Cellometer bright field image. Green circled cells are being counted for cell concentrations. Yellow circles are not counted and indicate cells larger than indicated settings.