COVID 19 Segmentation of CT Lung Images using custom U-Net Architecture:
COVID 19 CT Image Segmentation
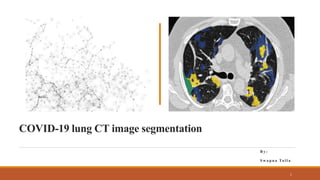
To study the segmentation process and work on the CT Image segmentation insights from segment radiology on axial lung slices using the U-Net method. The objective of segmenting consolidations in COVID-19 lung CT scans is to provide a more detailed and accurate view of the degree and severity of COVID-19 lung involvement in patients.
The primary goal is to detect disease-affected regions of the lung and assess the degree of involvement. This allows radiologists and doctors to better assess the severity of each patient's condition and select the best course of treatment. By this analysis we are going to predict whether the person is having the Corona Virus or not and how much the lungs were affected can be analyzed in this process. Record the observations obtained on implementing the CT Image Segmentation.
Dataset: Segmentation of lung changes from CT images (https://www.kaggle.com/c/covidsegmentation/data) a. Segmentation of consolidations only with the use of custom U-Net architecture (max 70%)
Purpose:
The purpose of COVID-19 segmentation is to identify and segregate people who are infected from those who are not. This is done to assist prevent the virus's spread and to give appropriate care to people who have been afflicted.
Aside from testing and isolation, segmentation may also entail identifying and monitoring close contacts of individuals who have tested positive for COVID-19, as well as implementing measures such as mask use, hand cleanliness, and so on.
The overall purpose of COVID-19 segmentation is to prevent the virus's propagation and protect public health segmentation of consolidations in COVID-19 lung CT scans is a useful tool for detecting and managing COVID-19 patients, and it can assist improve illness outcomes.
For complete information regarding the ppt description please check out the link:
https://covid-19segmentationoflungctimages.blogspot.com/2023/03/segmentation-of-lung-changes-from-ct.html
4. Dataset
It consists of two parts:
Medseg part:
images_medseg.npy - training images – 100 slices 512x512 size
masks_medseg.npy - training masks – 100 masks with 4 channels: (0
- "ground glass", 1 - "consolidations", 2 - "lungs other", 3 -
"background" )
test_images_medseg.npy - test images – 10 slices 512x512 size
Radiopedia part:
images_radiopsedia.npy - training images – 829 slices 512x512 size
masks_radiopedia.npy - training masks – 829 masks with 4
channels: (0 - "ground glass", 1 - "consolidations", 2 - "lungs other", 3
- "background" )
4
5. Methods
U-Net Architecture:
Images were segmented by a radiologist using 3 labels: ground-glass
(mask value =1), consolidation (=2) and pleural effusion (=3).
Hyperparameter Tuning:
Size of the Conv2D layers' filters (3x3)
Filter count in Conv2D layers (32, 64, 128, 256, 512)
Conv2DTranspose layers' stride size, for instance in (2, 2)
Activation Function, "relu"
padding ( "same")
5
6. Random CT Image
Visualization(medseg)
# Choose a random image and its mask to
visualize
idx = 0 # index of the image you want to v
isualize
image = images_medseg[idx, :, :, 0]
mask = masks_medseg[idx, :, :, 0]
fig, axs = plt.subplots(1, 3, figsize=(20, 10
))
axs[0].imshow(image, cmap='gray')
axs[0].set_title('CT Image')
axs[1].imshow(mask, cmap='gray')
axs[1].set_title('GGO')
axs[2].imshow(masks_medseg[idx, :, :, 1],
cmap='gray')
axs[2].set_title('Consolidations')
plt.show()
6
7. Random CT Image
Visualization(Radiopedia)
# Visualizing the data
# Plot an example image and its corre
sponding mask
idx = 30 # index of the image you w
ant to visualize
image = images_radiopedia[idx, :, :,
0]
mask = masks_radiopedia[idx, :, :, 1]
fig, axs = plt.subplots(1, 3, figsize=(2
0, 10))
axs[0].imshow(image, cmap='gray')
axs[0].set_title('Image')
axs[1].imshow(masks_radiopedia[idx
, :, :, 0], cmap='gray')
axs[1].set_title('GGO')
axs[2].imshow(mask, cmap='gray')
axs[2].set_title('Consolidations')
plt.show()
7
8. Normalization & Splitting Data
# Normalize images to [0, 1] range
images_medseg = (images_medseg -
np.min(images_medseg)) / (np.max(images_medseg) -
np.min(images_medseg))
images_radiopedia = (images_radiopedia -
np.min(images_radiopedia)) / (np.max(images_radiopedia) -
np.min(images_radiopedia))
test_images_medseg = (test_images_medseg -
np.min(test_images_medseg)) / (np.max(test_images_medseg) -
np.min(test_images_medseg))
# Split the data into training, validation, and testing sets
x_train = images_radiopedia
y_train = masks_radiopedia
x_val = images_medseg
y_val = masks_medseg
8
10. Model Compile and
Evaluation
# Model Compile
model.compile(optimizer='adam', loss='binary_cr
ossentropy', metrics=['accuracy'])
10
11. # Model Evaluation
history = unet_model.fit(x_train, y_trai
n, batch_size=32, epochs=10, validatio
n_data=(x_val, y_val))
11
12. Conclusion
• In computer vision, image
segmentation is a very beneficial
process that may be used in a range
of use-cases, including medical
imaging and driverless cars, to
collect various segments or classes
in real-time. One can now
experiment with utilizing U-Net to
implement image segmentation on
various challenges or by
investigating other models that are
helpful in image segmentation.
12